
Rationale and Objectives
Evaluation of chest computed tomography (CT) is usually qualitative or semiquantitative, resulting in subjective descriptions often by different observers over time and imprecise determinations of disease severity within distorted lobes. There is a need for standardized imaging biomarkers to quantify regional disease, maximize diagnostic yield, and facilitate multicenter comparisons. We applied lobe-based voxelwise image analysis to derive regional air (Vair) and tissue (Vtissue) volumes and fractional tissue volume (FTV = tissue/[tissue+air] volume) as internally standardized parameter for assessing interstitial lung disease (ILD).
Materials and Methods
High-resolution CT was obtained at supine and prone end-inspiration and supine end-expiration in 29 patients with ILD and 20 normal subjects. Lobar Vair, Vtissue, and FTV were expressed along standard coordinate axes.
Results
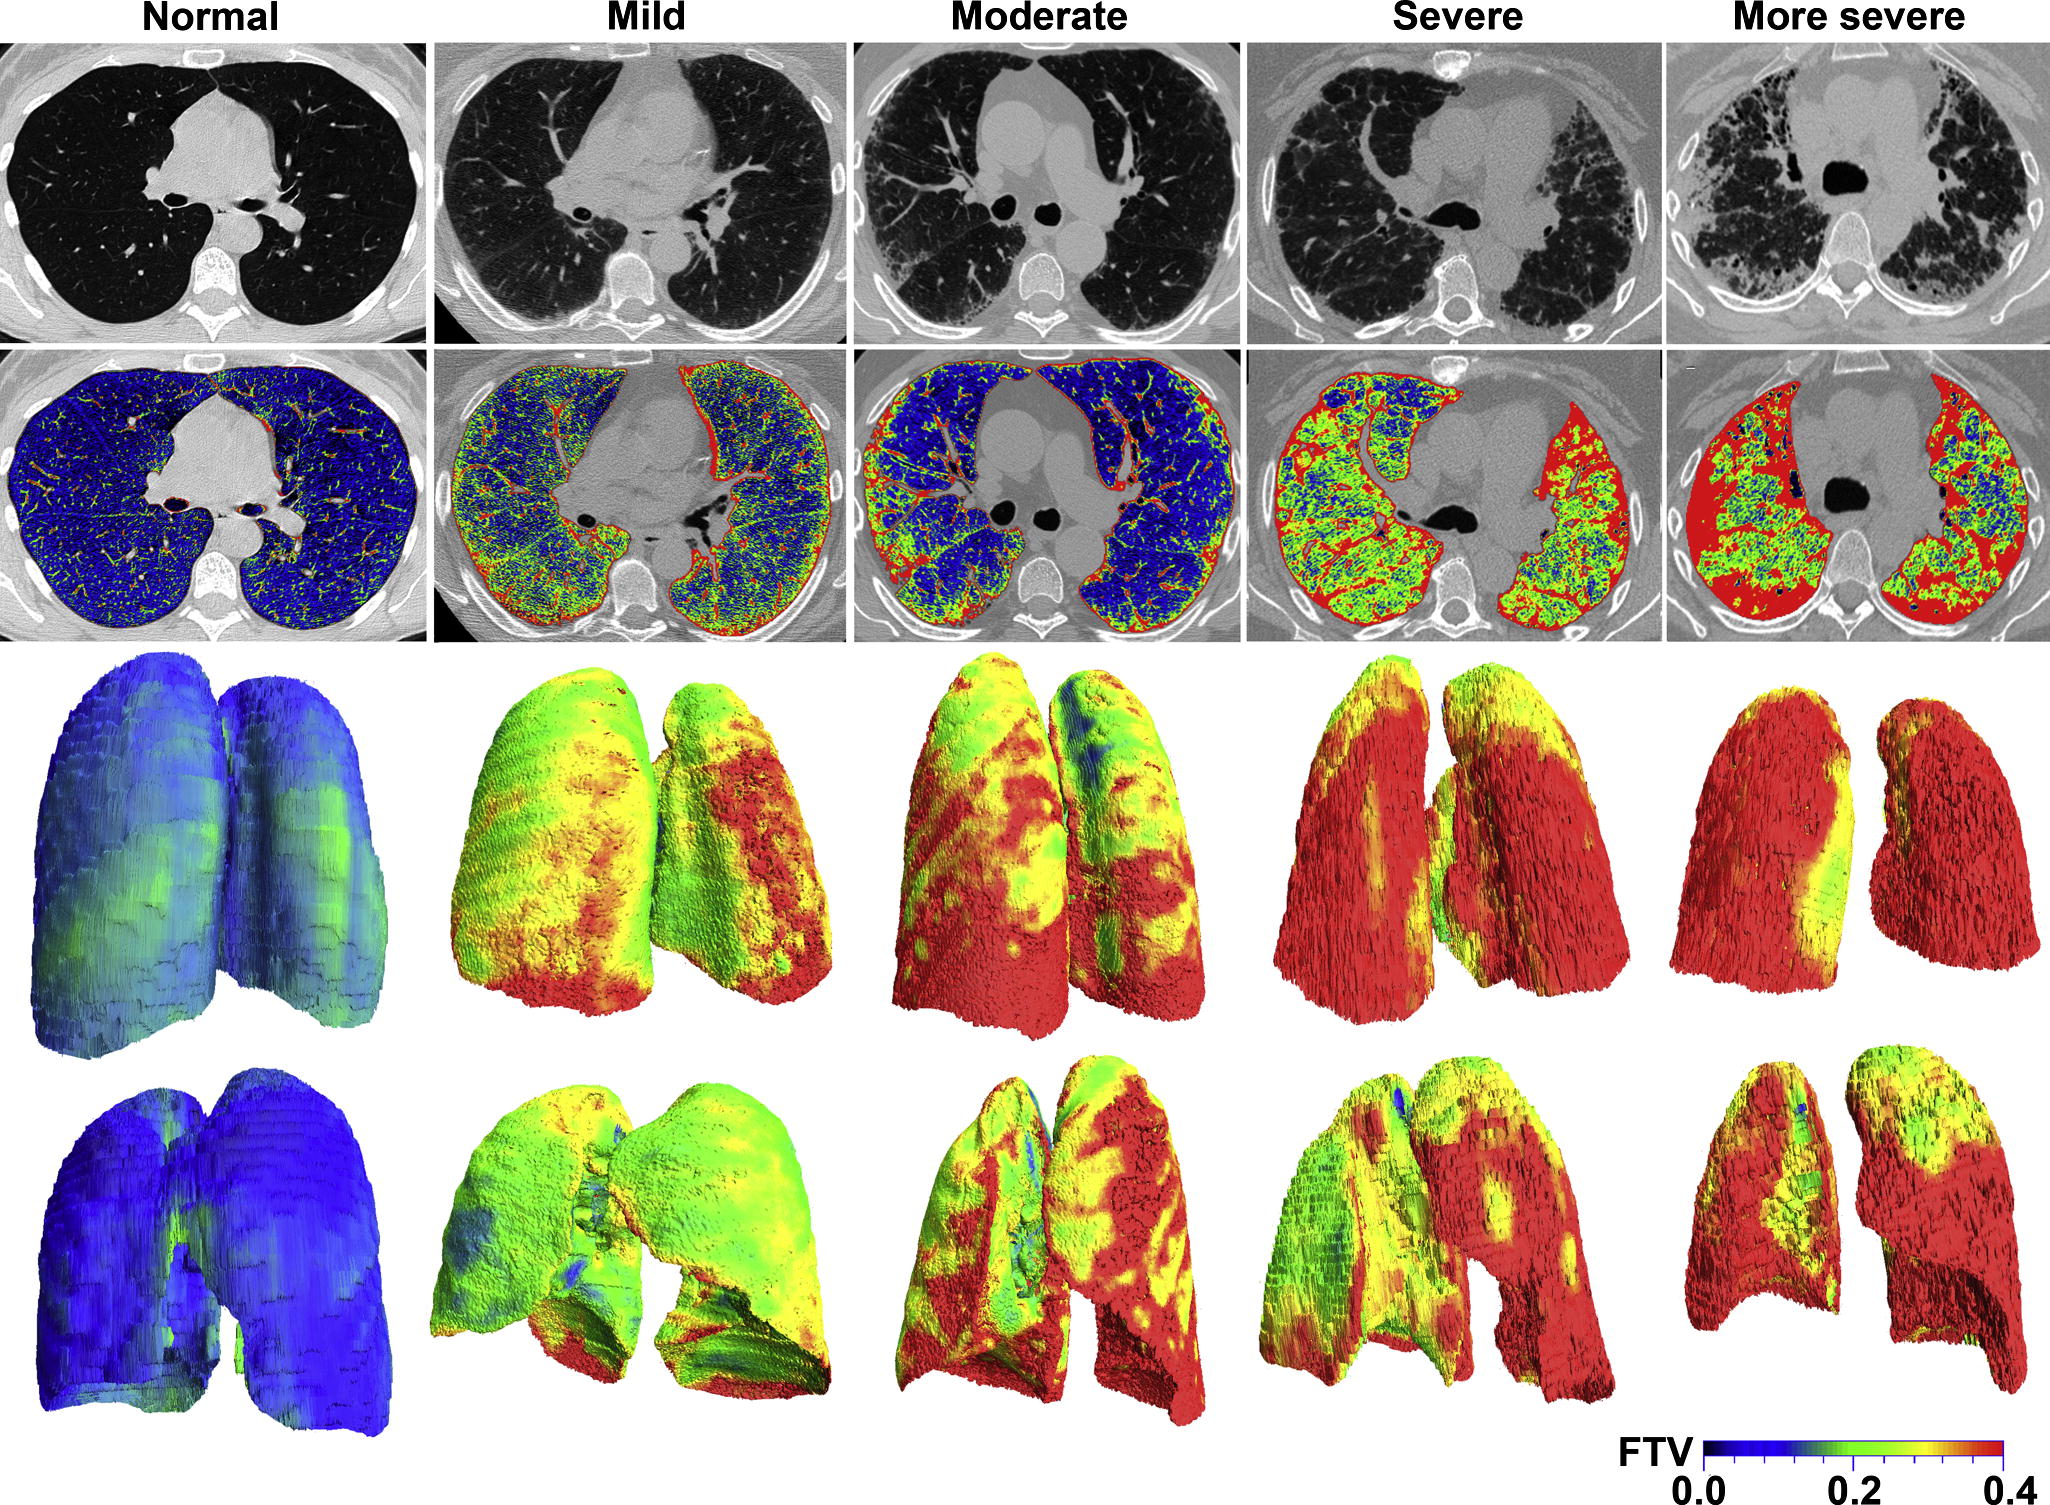
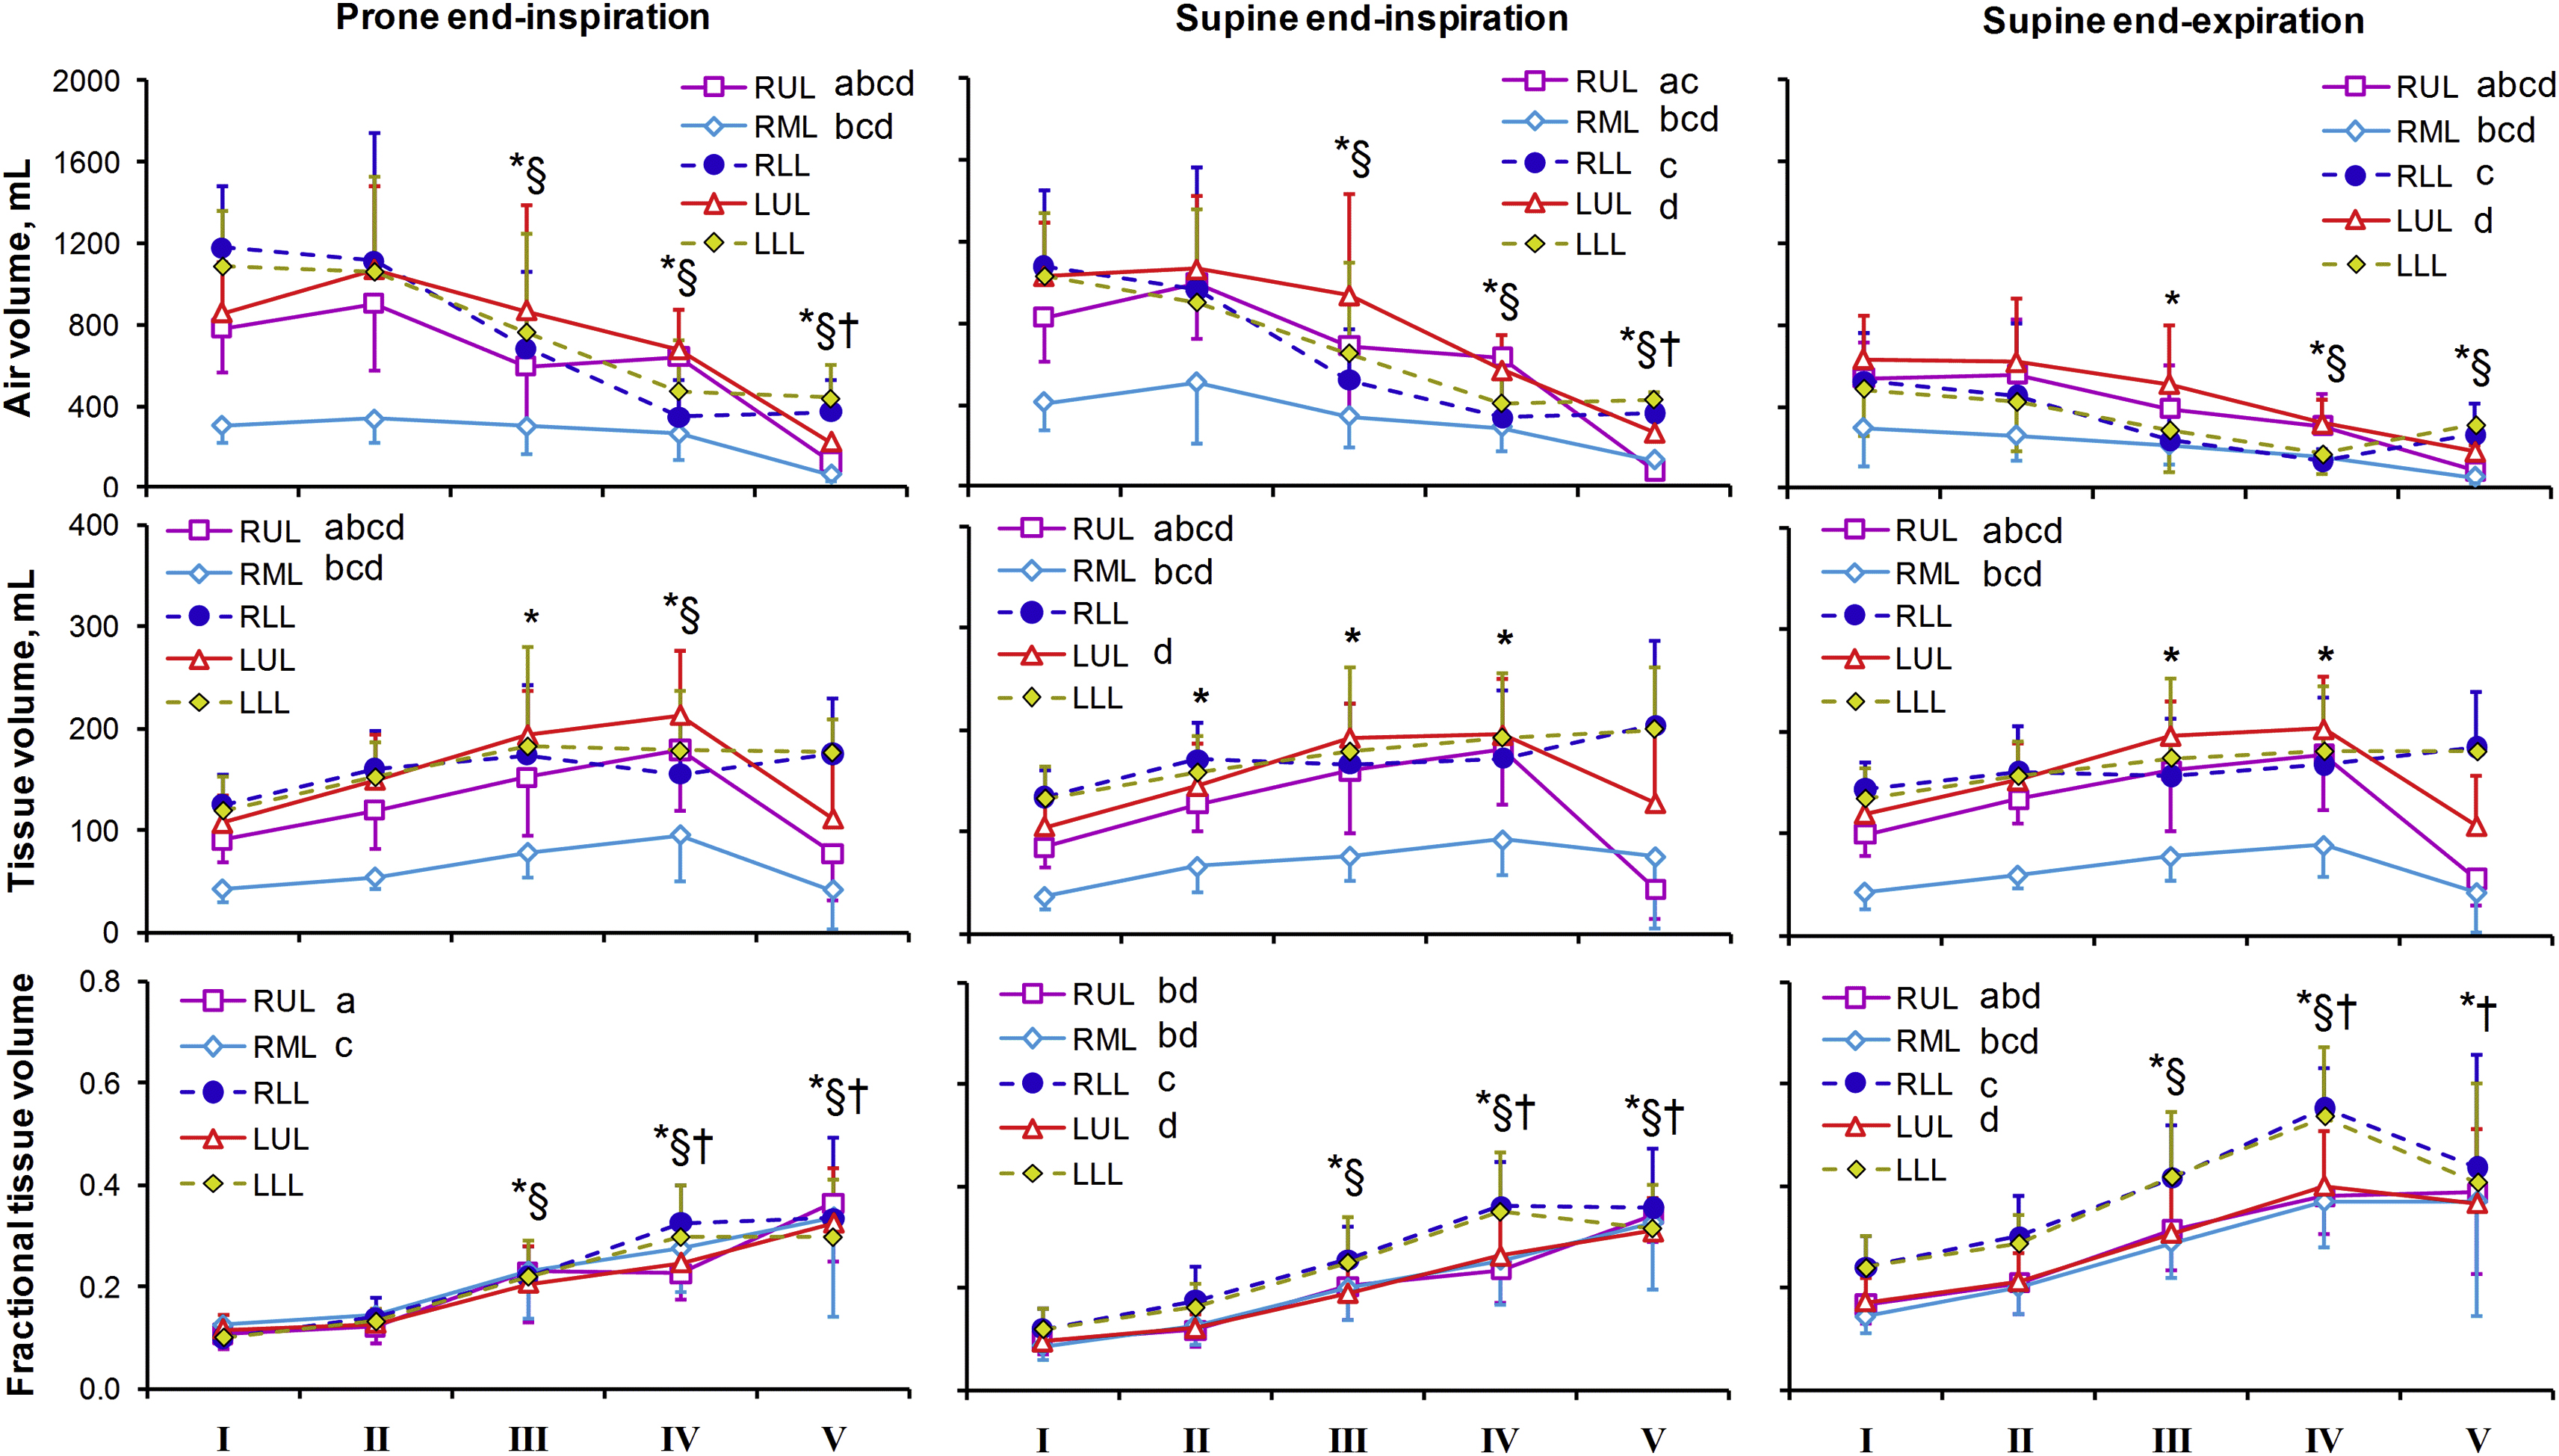
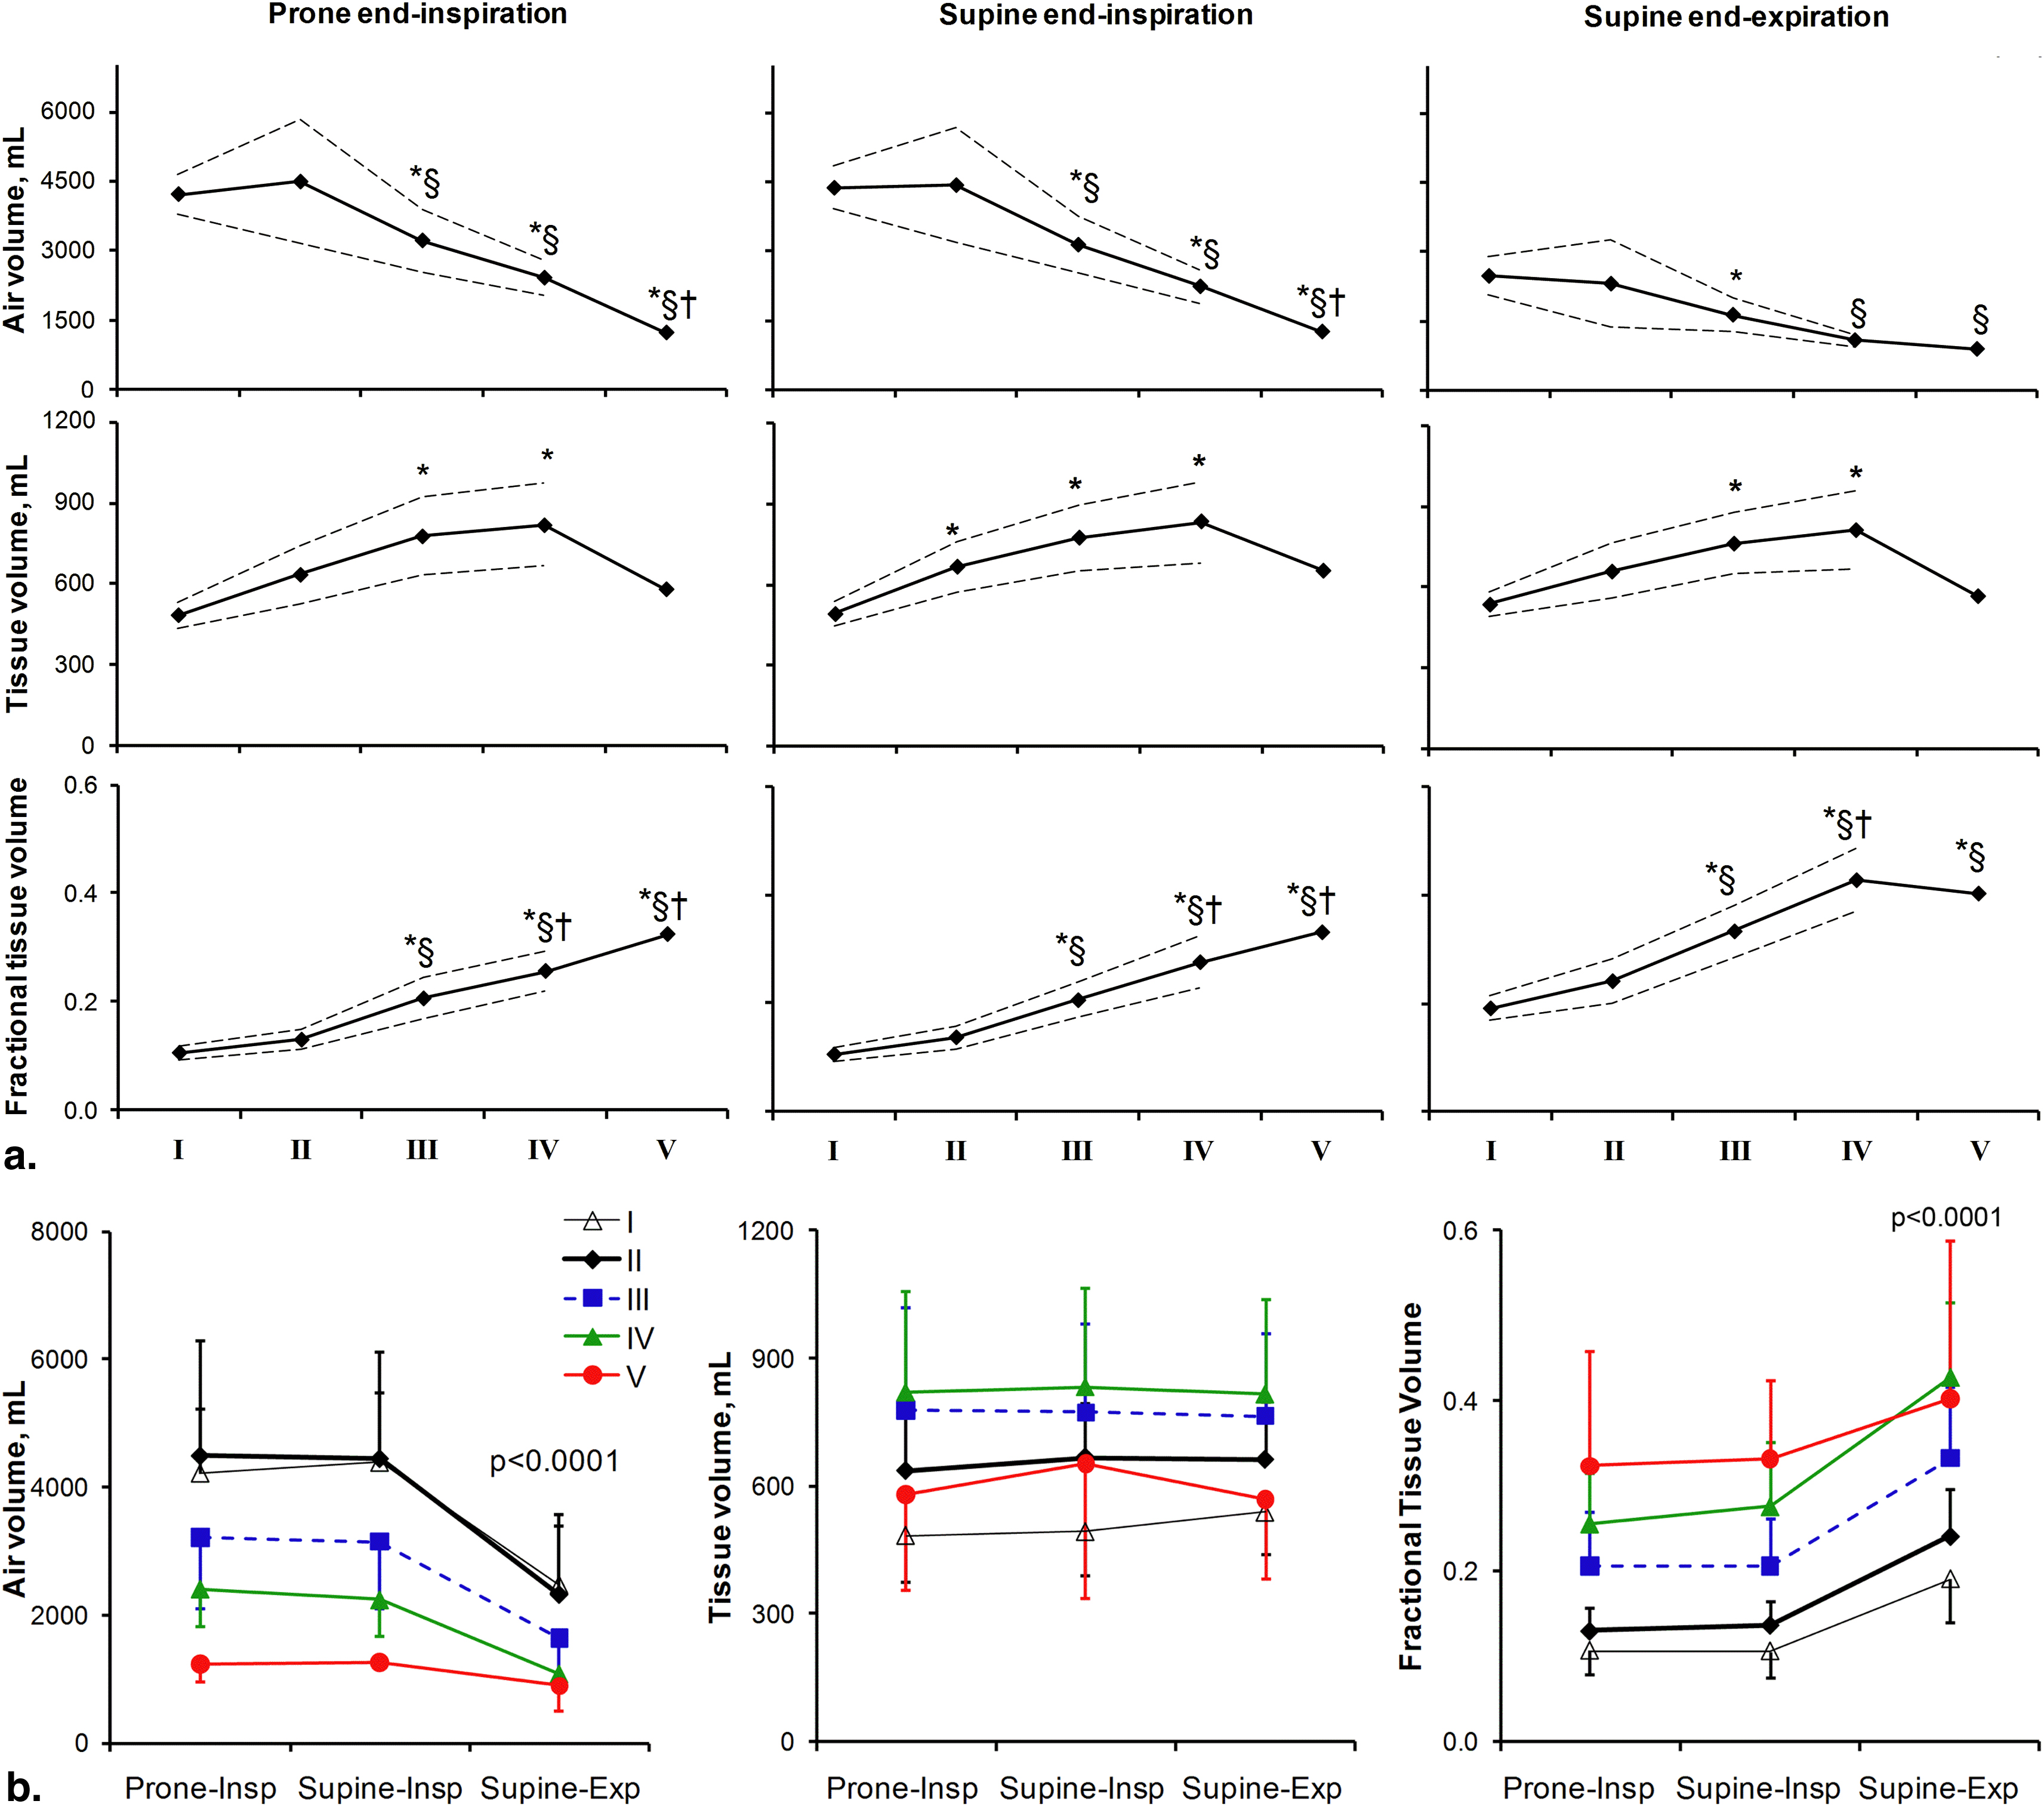
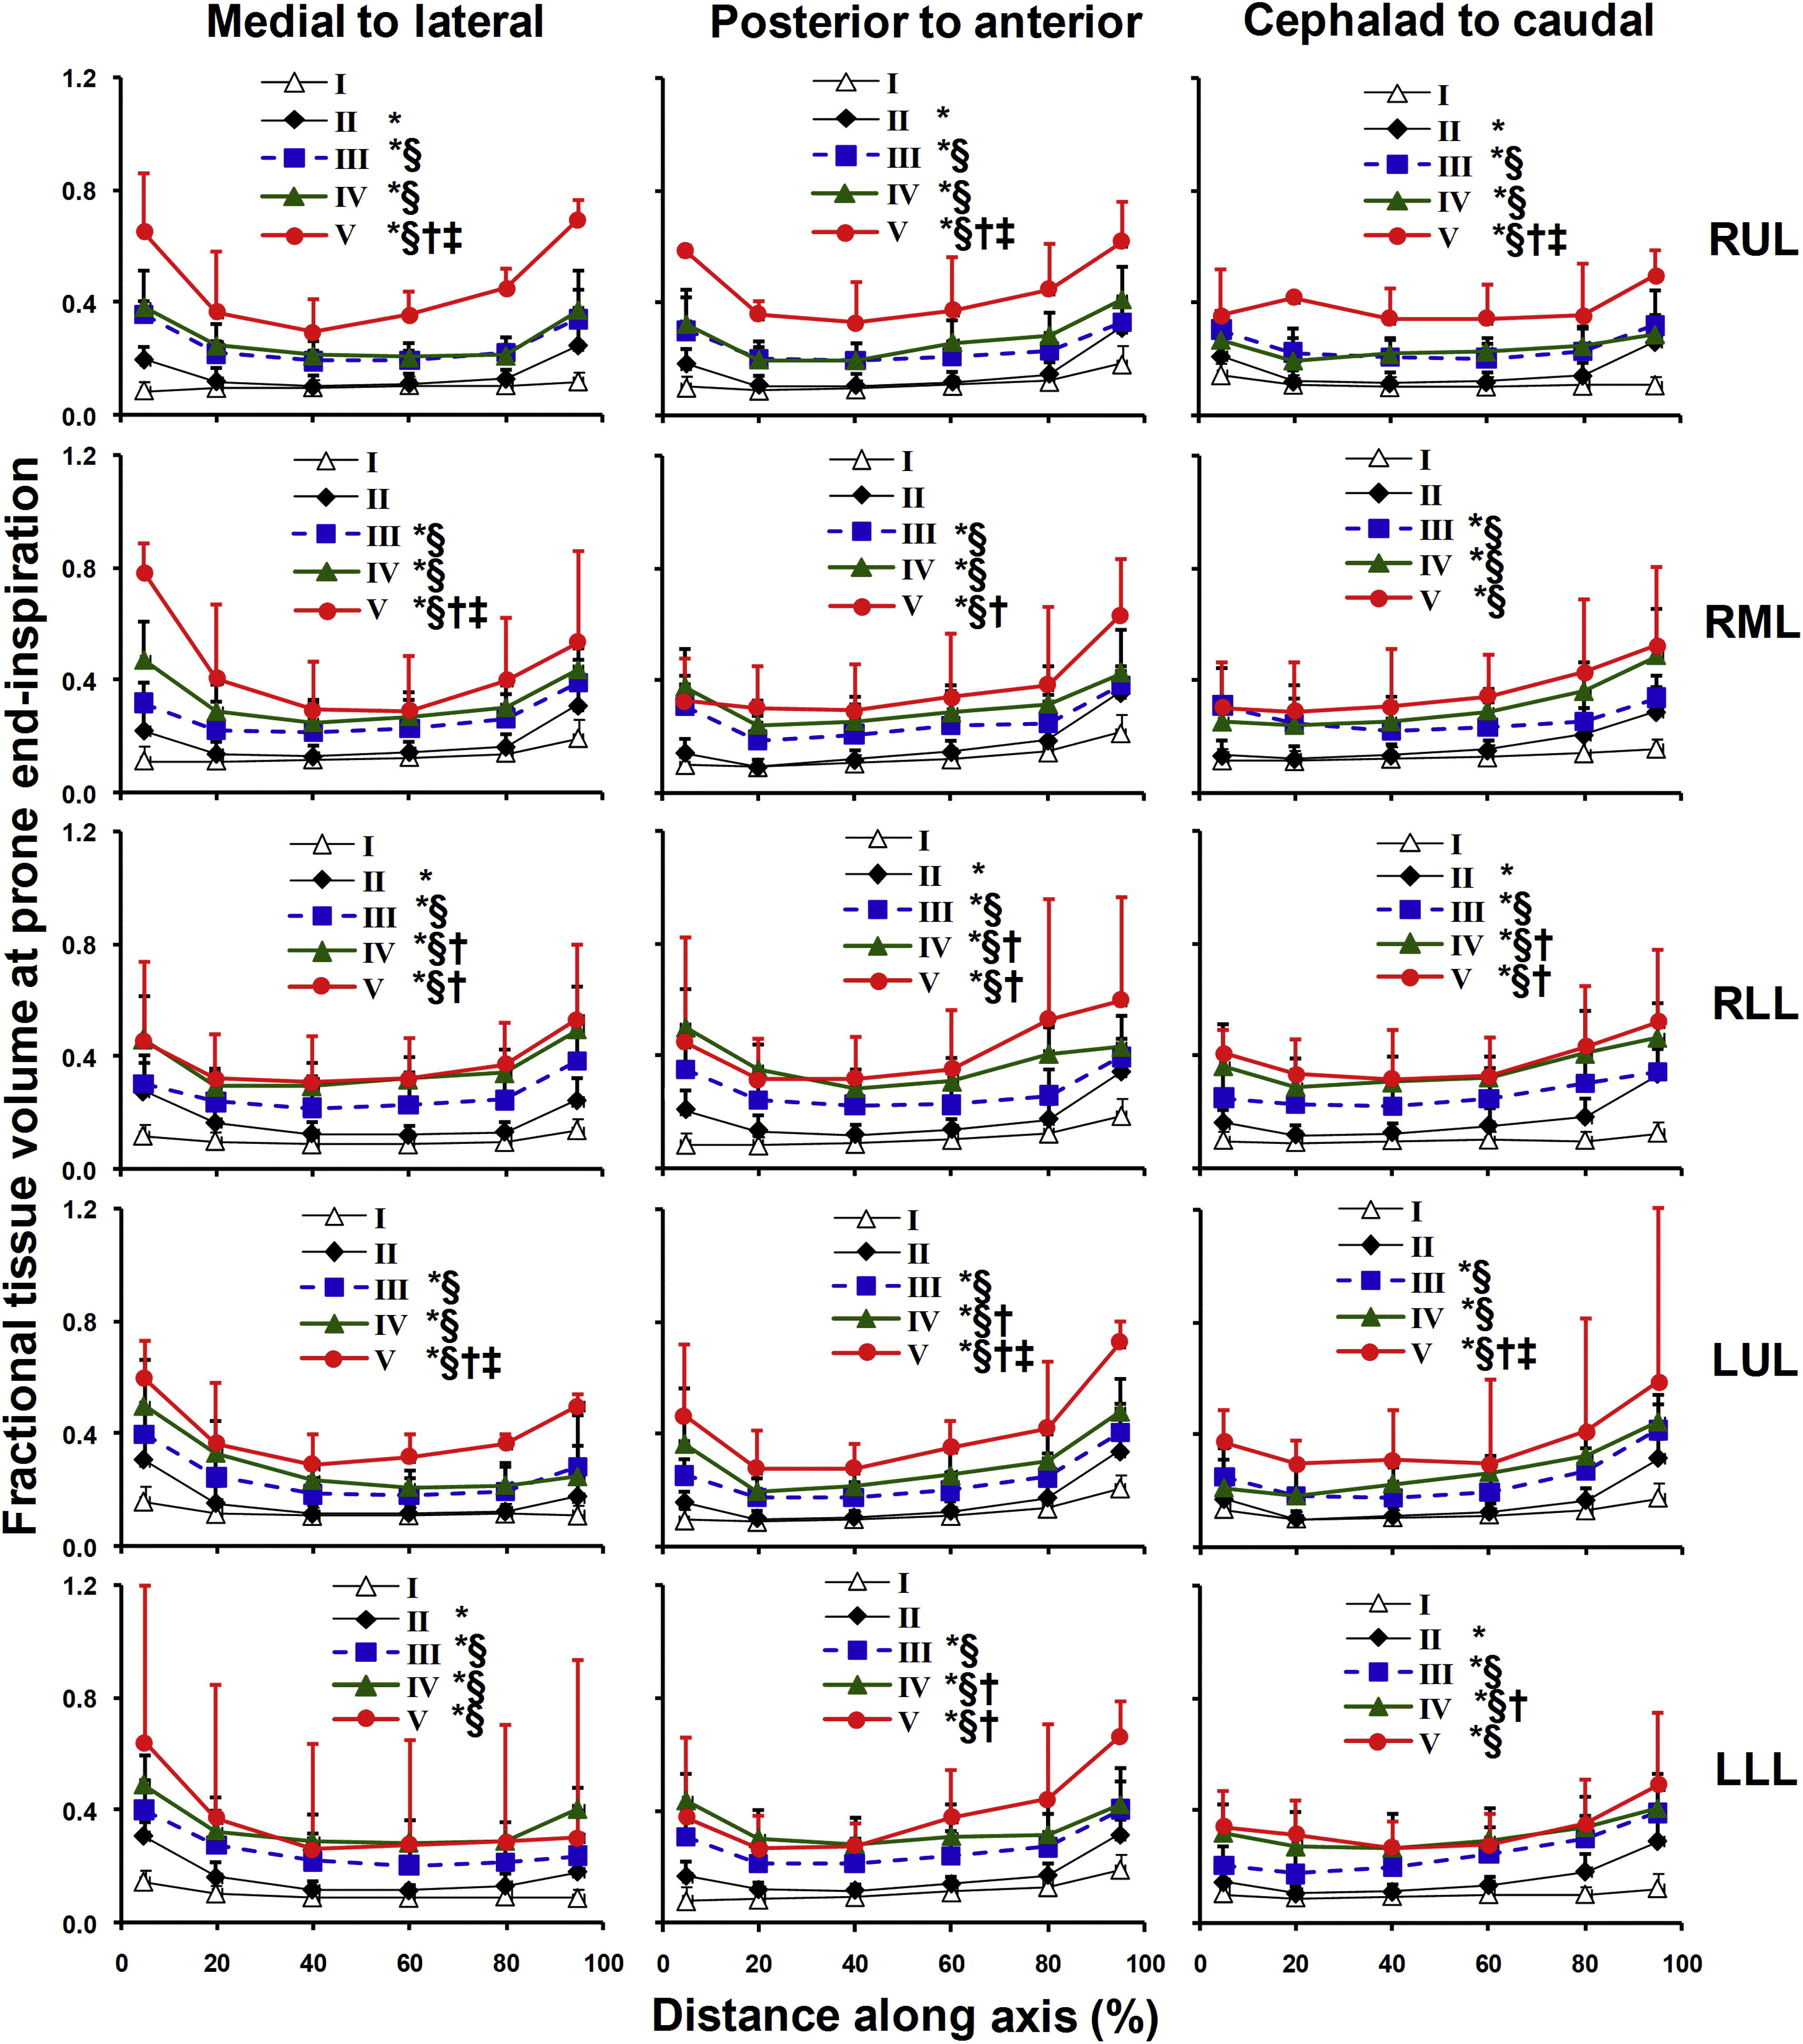
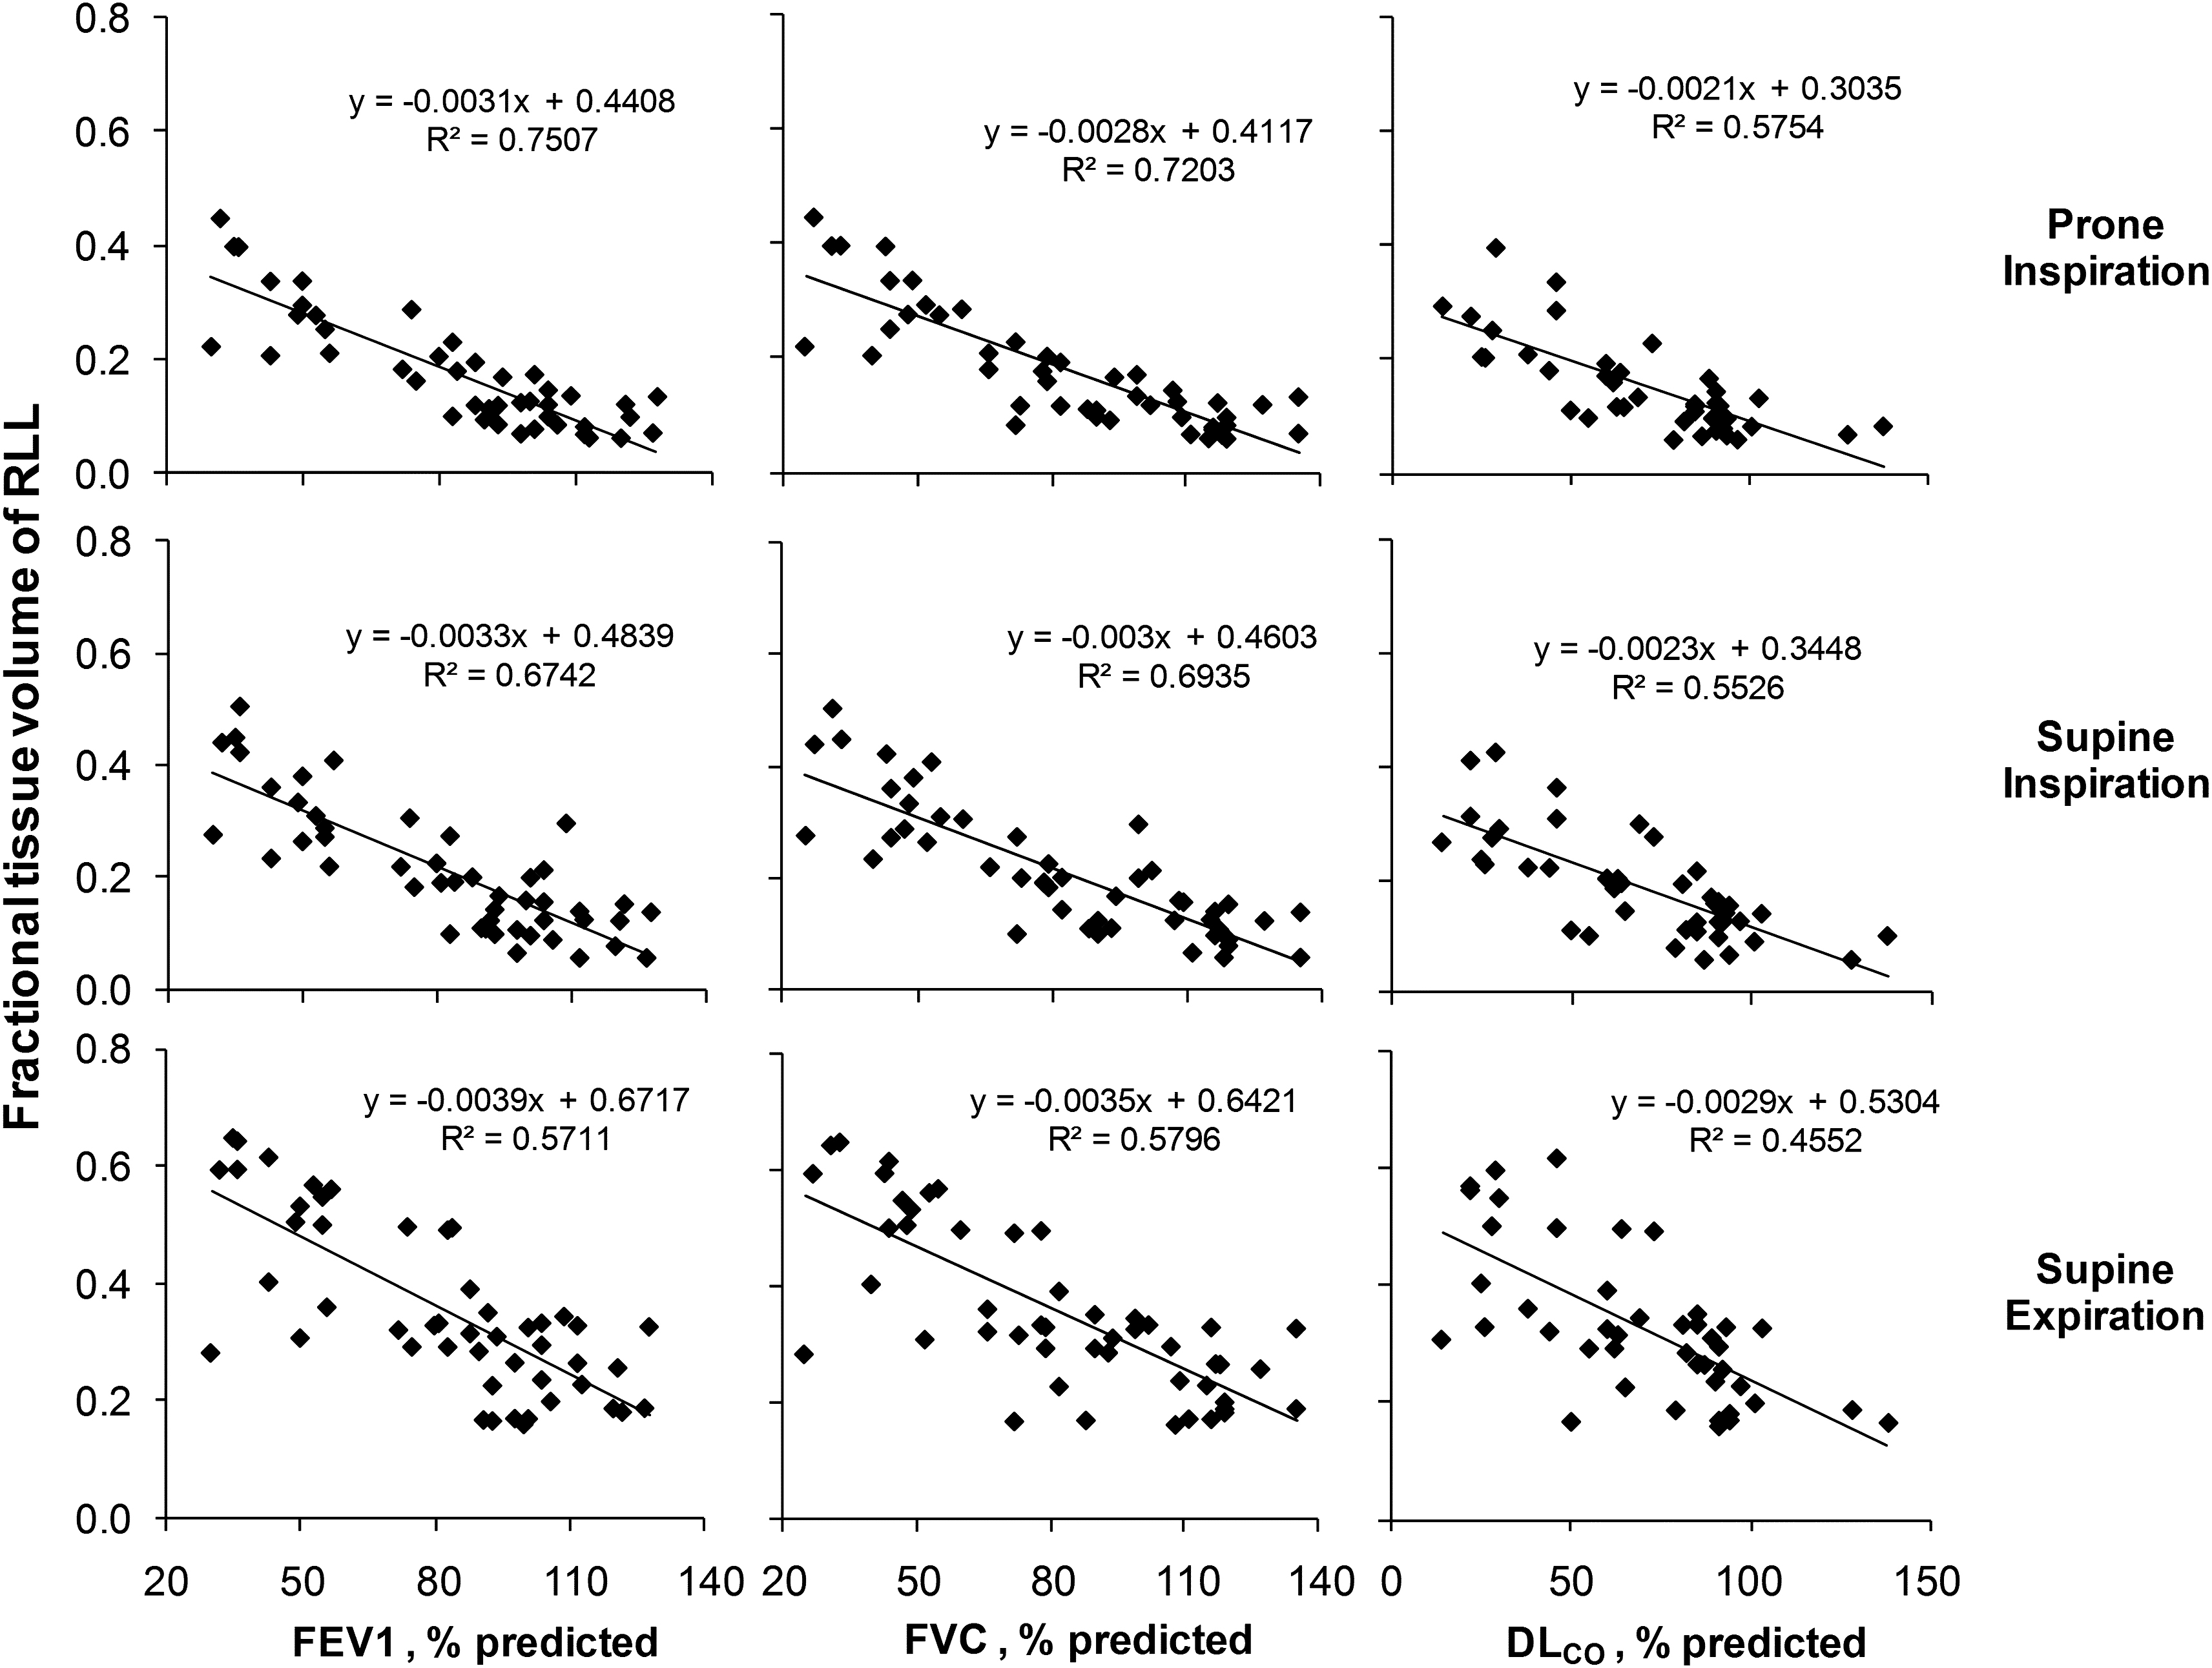
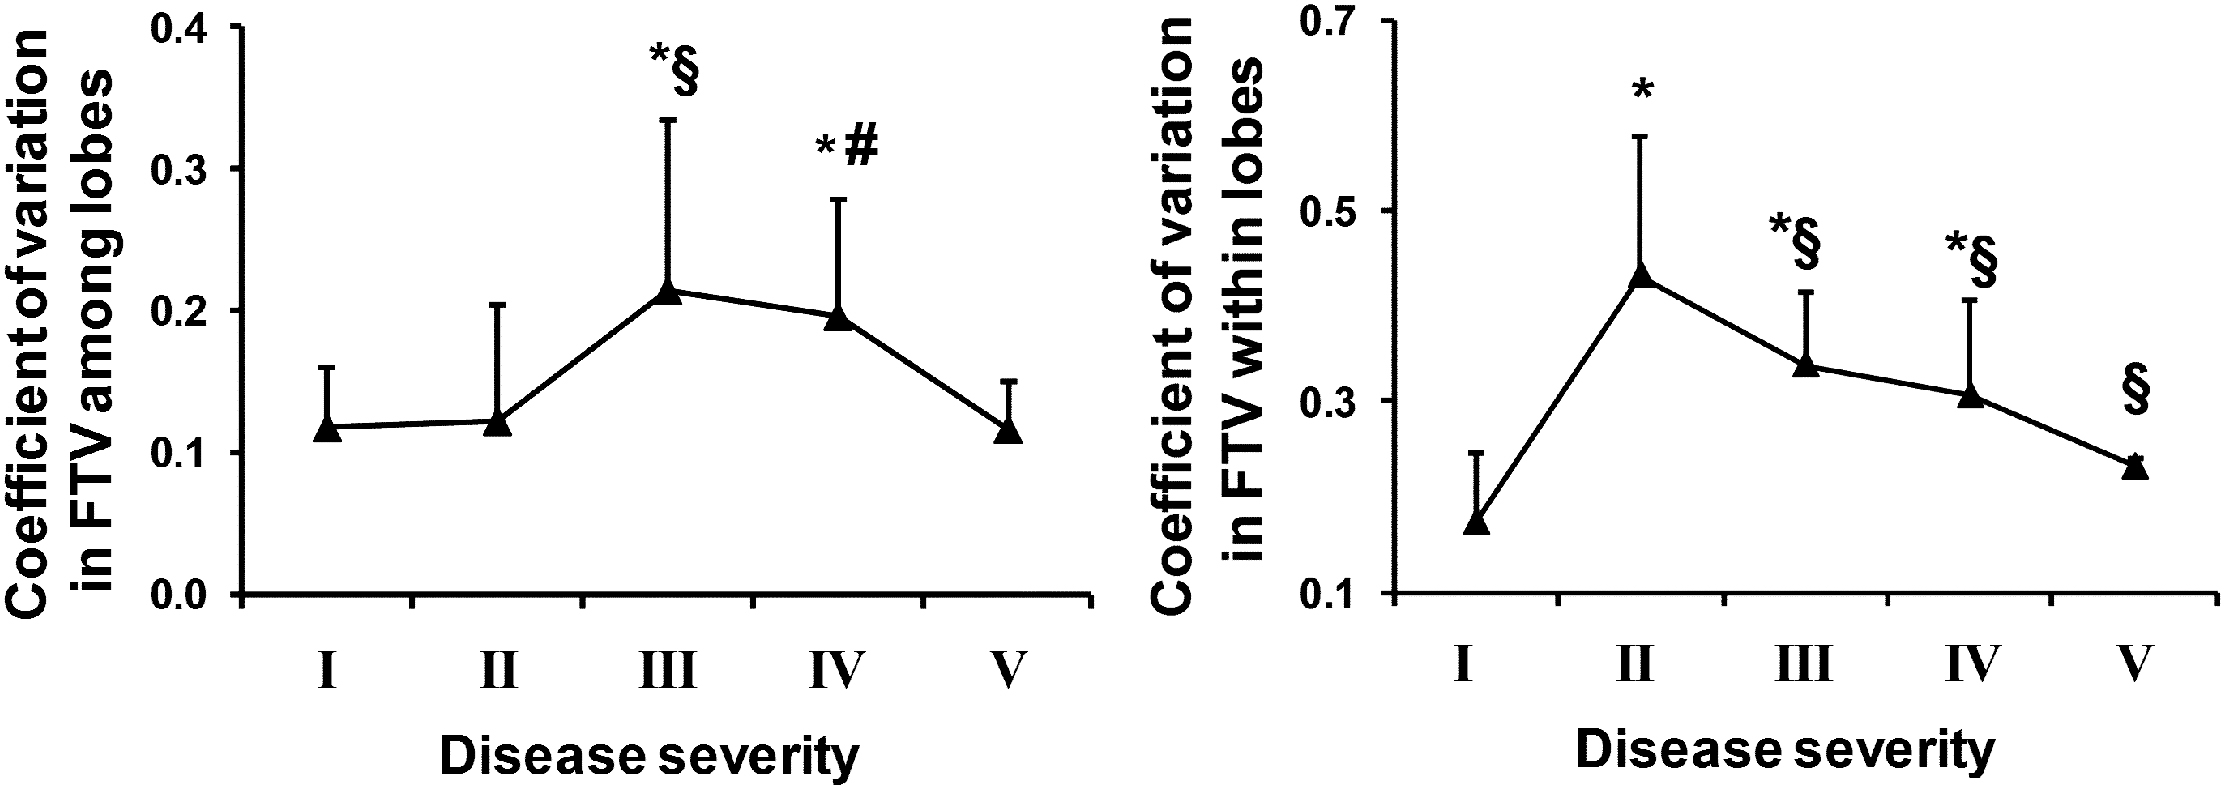
In normal subjects from end-inspiration to end-expiration, total Vair declined ∼43%, FTV increased ∼80%, but Vtissue remained unchanged. With increasing ILD, Vair declined and Vtissue rose in all lobes; FTV increased with a peripheral-to-central progression inversely correlated to spirometry and lung diffusing capacity ( r 2 = 0.57–0.75, prone end-inspiration). Inter- and intralobar coefficients of variation of FTV increased 84–148% in mild-to-moderate ILD, indicating greater spatial heterogeneity, then normalized in severe ILD. Analysis of discontinuous images incurs <3% error compared to consecutive images.
Conclusions
These regional attenuation-based biomarkers could quantify heterogeneous parenchymal disease in distorted lobes, detect mild ILD involvement in all lobes and describe the pattern of disease progression. The next step would be to study a larger series, examine reproducibility and follow longitudinal changes in correlation with clinical and functional indices.
Pulmonologists increasingly rely on volumetric computed tomography (CT) to diagnose and manage interstitial lung disease (ILD). Findings on CT have been reported to alter clinical decisions in 24–29% of cases, reduce the use of invasive diagnostic procedures by 16%, and improve agreement among clinicians on diagnostic probabilities . With widespread CT use comes the responsibility to ensure maximization of the diagnostic yield and minimization of the uncertainties associated with this technique in order to justify the small but real risk of harm from cumulative radiation exposure , particularly in patients with chronic destructive lung disease who are routinely subjected to serial scans over many years. Until now, clinical evaluation of chest CT remains mostly qualitative or semiquantitative , resulting in unavoidable spatial, temporal, interobserver and interscanner variability, especially in multicenter clinical trials . The unique nonsolid, elastic features of the lung renders the anatomy of the organ highly sensitive to volume change and asymmetric distortion from nonuniform disease involvement; architectural distortion often makes it difficult to match the same anatomical regions on successive scans, especially if lung inflation changes. Furthermore, the large image dataset generated from each scan is routinely underused. There is need for a comprehensive, objective, and quantitative approach to fully exploit the information content and diagnostic potential of this powerful tool. Quantitative lobe-based approach has not been widely adopted partly because of the perceived effort required and partly because of a lack of examples showing how specific imaging biomarkers could be standardized in application to clinical pathology.
To address some of these issues, we developed a PC-based semiautomated algorithm to map and analyze lung attenuation within each lobe in a voxelwise fashion. By referencing the voxel attenuation with respect to internal calibrators for intrathoracic air and tissue in each subject, standardized air and tissue volumes and fractional tissue volume (FTV) were derived as regional anatomical markers that could be mapped with respect to reference coordinate axes of each lobe and compared within and among lobes. The novel approach has been shown in animals to accurately characterize nonuniform regional structural lung growth during postnatal maturation and postpneumonectomy compensation , but has not been applied to clinical disease. We employed this technique to analyze high-resolution chest CT obtained in patients with ILD to describe lobar disease severity and test the hypothesis that the magnitude, spatial distribution and heterogeneity of CT-derived indices objectively reflect abnormalities in spirometry and lung diffusing capacity (DL CO ).
Materials and methods
Subjects
Get Radiology Tree app to read full this article<
HRCT
Get Radiology Tree app to read full this article<
Image Analysis
Get Radiology Tree app to read full this article<
Attenuation-derived Indices
Get Radiology Tree app to read full this article<
Lobartissuevolume=LobarCTn−airCTnmuscleCTn−airCTn×totallobarvolume L
o
b
a
r
t
i
s
s
u
e
v
o
l
u
m
e
=
L
o
b
a
r
C
T
n
−
a
i
r
C
T
n
m
u
s
c
l
e
C
T
n
−
a
i
r
C
T
n
×
t
o
t
a
l
l
o
b
a
r
v
o
l
u
m
e
Lobarairvolume=totallobarvolume−lobartissuevolume L
o
b
a
r
a
i
r
v
o
l
u
m
e
=
t
o
t
a
l
l
o
b
a
r
v
o
l
u
m
e
−
l
o
b
a
r
t
i
s
s
u
e
v
o
l
u
m
e
Fractionaltissuevolume=lobartissuevolumetotallobarvolume F
r
a
c
t
i
o
n
a
l
t
i
s
s
u
e
v
o
l
u
m
e
=
l
o
b
a
r
t
i
s
s
u
e
v
o
l
u
m
e
t
o
t
a
l
l
o
b
a
r
v
o
l
u
m
e
Get Radiology Tree app to read full this article<
Get Radiology Tree app to read full this article<
Images With and Without Gaps
Get Radiology Tree app to read full this article<
Get Radiology Tree app to read full this article<
Statistical Analysis
Get Radiology Tree app to read full this article<
Results
Get Radiology Tree app to read full this article<
Table 1
Demographic Data and Lung Function
Group I II III IV V ILD severity Normal Mild Moderate Severe More severe Number of subjects 20 7 11 9 2 Male/female 11/9 3/4 7/4 6/3 0/2 Age, y 51 ± 12 64 ± 9 57 ± 15 55 ± 6 40 ± 19 Height, cm 171 ± 12 168 ± 9 170 ± 9 169 ± 10 167 ± 3 Weight, kg 79 ± 23 82 ± 12 87 ± 16 79 ± 17 65 ± 22 BMI, kg . m −2 28.8 ± 11.7 42.6 ± 3.6 43.4 ± 4.1 41.7 ± 4.1 37.5 ± 8.0 Hemoglobin, g . dL −1 13.7 ± 1.4 14.4 ± 1.4 14.7 ± 1.2 13.2 ± 1.8 13.0 FEV 1 , L 3.33 ± 0.90 2.64 ± 0.50 2.15 ± 0.49 1.44 ± 0.40 1.00 ± 0.14 FEV 1 , % predicted 105 ± 14 96 ± 7 71 ± 14 45 ± 8 31 ± 1 FVC, L 4.28 ± 1.10 3.46 ± 0.82 2.69 ± 0.67 1.77 ± 0.44 1.05 ± 0.07 FVC, % predicted 111 ± 15 90 ± 13 67 ± 10 42 ± 6 26 ± 1 FEV 1 /FVC, % predicted 95 ± 5 107 ± 13 106 ± 11 106 ± 12 119 ± 1 DL CO , mL . [min . mm Hg] −1 23.3 ± 5.9 15.4 ± 5.3 10.2 ± 4.7 7.5 ± 2.8 – DL CO , % predicted 88 ± 17 77 ± 32 45 ± 23 32 ± 8 –
BMI, body mass index; DL CO , lung diffusing capacity; FEV 1 , forced expiratory volume in 1 second; FVC, forced vital capacity.
Mean ± SD.
Table 2
Attenuation Values and Histogram of FTV
Normal ( n = 20) ILD ( n = 29) Attenuation (HU) Tracheal air −969 ± 9 −971 ± 14 Thoracic muscle 58 ± 3 45 ± 18 ∗ Liver 64 ± 9 59 ± 9 Histogram of FTV (using muscle attenuation) Prone end-inspiration Mean lung FTV 0.106 ± 0.029 0.210 ± 0.082 ∗ Kurtosis −0.558 0.041 Skewness 0.368 0.814 Supine end-inspiration Mean lung FTV 0.106 ± 0.030 0.220 ± 0.083 ∗ Kurtosis 0.341 −0.101 Skewness 0.711 0.682 Supine end-inspiration Mean lung FTV 0.191 ± 0.051 0.345 ± 0.108 ∗ Kurtosis −0.172 −0.450 Skewness 0.703 0.526 Critical values ( P < .05 2-sided) Kurtosis (range of normality) −1.27 to 2.56 −1.08 to 2.12 Skewness 1.03 0.847
FTV, fractional tissue volume; HU, Hounsfield units.
Mean ± SD.
Get Radiology Tree app to read full this article<
Get Radiology Tree app to read full this article<
Get Radiology Tree app to read full this article<
Get Radiology Tree app to read full this article<
Get Radiology Tree app to read full this article<
Get Radiology Tree app to read full this article<
Get Radiology Tree app to read full this article<
Get Radiology Tree app to read full this article<
Discussion
Summary of Results
Get Radiology Tree app to read full this article<
Quantitative Image Analysis
Get Radiology Tree app to read full this article<
Significance
Get Radiology Tree app to read full this article<
Limitations of the Study
Get Radiology Tree app to read full this article<
Conclusions
Get Radiology Tree app to read full this article<
Get Radiology Tree app to read full this article<
References
1. Aziz Z.A., Wells A.U., Bateman E.D., et. al.: Interstitial lung disease: effects of thin-section CT on clinical decision making. Radiology 2006; 238: pp. 725-733.
2. Smith-Bindman R.: Is computed tomography safe?. N Engl J Med 2010; 363: pp. 1-4.
3. Goldin J.G., Lynch D.A., Strollo D.C., et. al.: High-resolution CT scan findings in patients with symptomatic scleroderma-related interstitial lung disease. Chest 2008; 134: pp. 358-367.
4. Zompatori M., Bna C., Poletti V., et. al.: Diagnostic imaging of diffuse infiltrative disease of the lung. Respiration 2004; 71: pp. 4-19.
5. Li F., Kumazawa S., Shiraishi J., et. al.: Subjective similarity of patterns of diffuse interstitial lung disease on thin-section CT: an observer performance study. Acad Radiol 2009; 16: pp. 477-485.
6. Armato S.G., McNitt-Gray M.F., Reeves A.P., et. al.: The Lung Image Database Consortium (LIDC): an evaluation of radiologist variability in the identification of lung nodules on CT scans. Acad Radiol 2007; 14: pp. 1409-1421.
7. Van de Steene J., Linthout N., de Mey J., et. al.: Definition of gross tumor volume in lung cancer: inter-observer variability. Radiother Oncol 2002; 62: pp. 37-49.
8. Ravikumar P., Yilmaz C., Dane D.M., et. al.: Regional lung growth following pneumonectomy assessed by computed tomography. J Appl Physiol 2004; 97: pp. 1567-1574. discussion 1549
9. Ravikumar P., Yilmaz C., Dane D.M., et. al.: Developmental signals do not further accentuate nonuniform postpneumonectomy compensatory lung growth. J Appl Physiol 2007; 102: pp. 1170-1177.
10. Yilmaz C., Ravikumar P., Dane D.M., et. al.: Noninvasive quantification of heterogeneous lung growth following extensive lung resection by high-resolution computed tomography. J Appl Physiol 2009; 107: pp. 1569-1578.
11. Standardization of Spirometry, 1994 Update. American Thoracic Society. Am J Respir Crit Care Med 1995; 152: pp. 1107-1136.
12. American Thoracic Society. Single-breath carbon monoxide diffusing capacity (transfer factor). Recommendations for a standard technique—1995 update. Am J Respir Crit Care Med 1995; 152: pp. 2185-2198.
13. Camiciottoli G., Orlandi I., Bartolucci M., et. al.: Lung CT densitometry in systemic sclerosis: correlation with lung function, exercise testing, and quality of life. Chest 2007; 131: pp. 672-681.
14. Revel M.P., Faivre J.B., Remy-Jardin M., et. al.: Automated lobar quantification of emphysema in patients with severe COPD. Eur Radiol 2008; 18: pp. 2723-2730.
15. Zavaletta V.A., Bartholmai B.J., Robb R.A.: High resolution multidetector CT-aided tissue analysis and quantification of lung fibrosis. Acad Radiol 2007; 14: pp. 772-787.
16. Lynch D.A.: Quantitative CT of fibrotic interstitial lung disease. Chest 2007; 131: pp. 643-644.
17. Kalender W.A., Fichte H., Bautz W., et. al.: Semiautomatic evaluation procedures for quantitative CT of the lung. J Comput Assist Tomogr 1991; 15: pp. 248-255.
18. Hoffman E.A., Reinhardt J.M., Sonka M., et. al.: Characterization of the interstitial lung diseases via density-based and texture-based analysis of computed tomography images of lung structure and function. Acad Radiol 2003; 10: pp. 1104-1118.
19. Lamers R.J., Kemerink G.J., Drent M., et. al.: Reproducibility of spirometrically controlled CT lung densitometry in a clinical setting. Eur Respir J 1998; 11: pp. 942-945.
20. Hartley P.G., Galvin J.R., Hunninghake G.W., et. al.: High-resolution CT-derived measures of lung density are valid indexes of interstitial lung disease. J Appl Physiol 1994; 76: pp. 271-277.
21. Coxson H.O., Hogg J.C., Mayo J.R., et. al.: Quantification of idiopathic pulmonary fibrosis using computed tomography and histology. Am J Respir Crit Care Med 1997; 155: pp. 1649-1656.
22. Best A.C., Lynch A.M., Bozic C.M., et. al.: Quantitative CT indexes in idiopathic pulmonary fibrosis: relationship with physiologic impairment. Radiology 2003; 228: pp. 407-414.
23. Arzhaeva Y., Prokop M., Murphy K., et. al.: Automated estimation of progression of interstitial lung disease in CT images. Med Phys 2010; 37: pp. 63-73.
24. Covino S.W., Mitnick R.J., Shprintzen R.J., et. al.: The accuracy of measurements of three-dimensional computed tomography reconstructions. J Oral Maxillofac Surg 1996; 54: pp. 982-990. discussion 990–981
25. Bakker M.E., Stolk J., Putter H., et. al.: Variability in densitometric assessment of pulmonary emphysema with computed tomography. Invest Radiol 2005; 40: pp. 777-783.
26. Xu Y., Sonka M., McLennan G., et. al.: MDCT-based 3-D texture classification of emphysema and early smoking related lung pathologies. IEEE Trans Med Imaging 2006; 25: pp. 464-475.
27. Xu Y., van Beek E.J., Hwanjo Y., et. al.: Computer-aided classification of interstitial lung diseases via MDCT: 3D adaptive multiple feature method (3D AMFM). Acad Radiol 2006; 13: pp. 969-978.
28. Uppaluri R., Hoffman E.A., Sonka M., et. al.: Interstitial lung disease: A quantitative study using the adaptive multiple feature method. Am J Respir Crit Care Med 1999; 159: pp. 519-525.
29. Wang J., Li F., Li Q.: Automated segmentation of lungs with severe interstitial lung disease in CT. Med Phys 2009; 36: pp. 4592-4599.
30. Koyama H., Ohno Y., Yamazaki Y., et. al.: Quantitatively assessed CT imaging measures of pulmonary interstitial pneumonia: effects of reconstruction algorithms on histogram parameters. Eur J Radiol 2010; 74: pp. 142-146.
31. Kelley D.E., Storlien L.: Skeletal muscle and obesity.Bray G.A.Bouchard C.Handbook of obesity, Part II, Etiology.2004.Marcel DekkerNew York: