
Rationale and Objectives
To quantify spatial distribution of emphysema using high-resolution computed tomography (HRCT), we applied semiautomated analysis with internal attenuation calibration to measure regional air volume, tissue volume, and fractional tissue volume (FTV = tissue/[air + tissue] volume) in well-characterized patients studied by the Lung Tissue Research Consortium (LTRC).
Methods
HRCT was obtained at supine end-inspiration and end-expiration, and prone end-inspiration from 31 patients with mild, moderate, severe, or very severe emphysema (stages II–V, forced expiratory volume at 1 second >75%, 51%–75%, 21%–50% and ≤20% predicted, respectively). Control data were from 20 healthy non-smokers (stage I). Each lobe was analyzed separately. Heterogeneity of FTV was assessed from coefficients of variation (CV) within and among lobes, and the kurtosis and skewness of FTV histograms.
Results
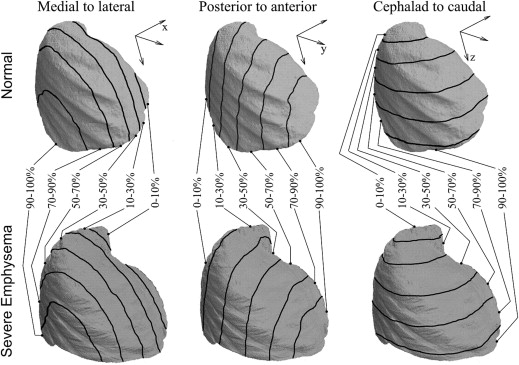
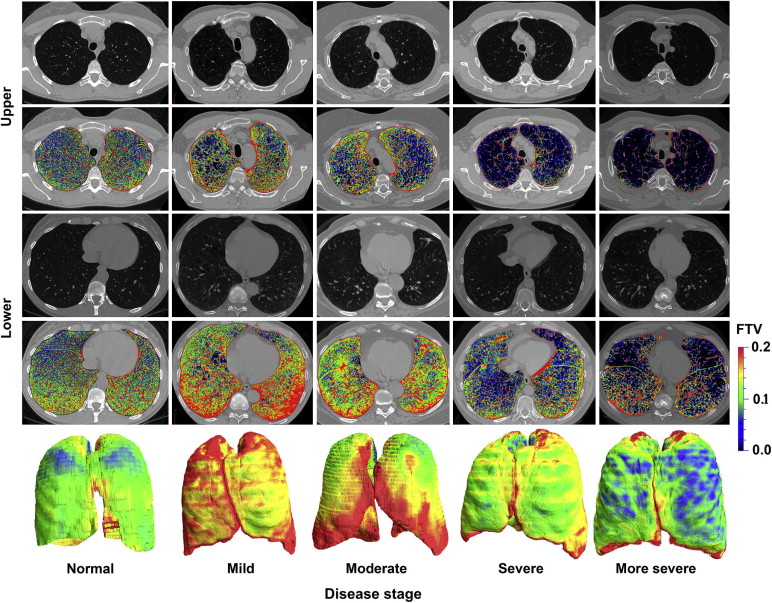
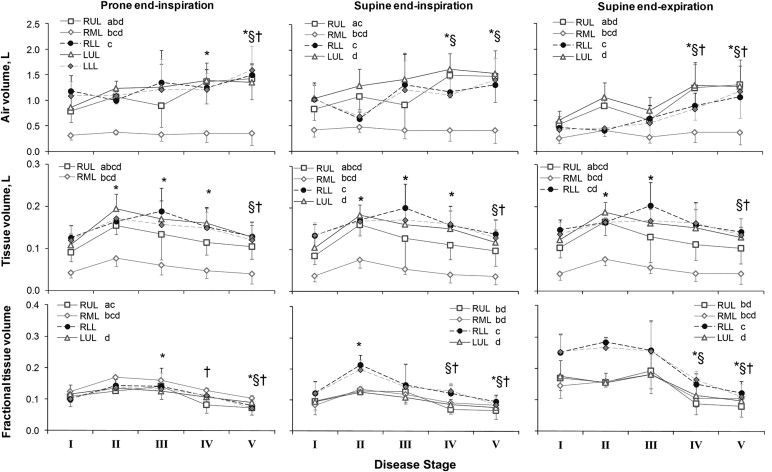
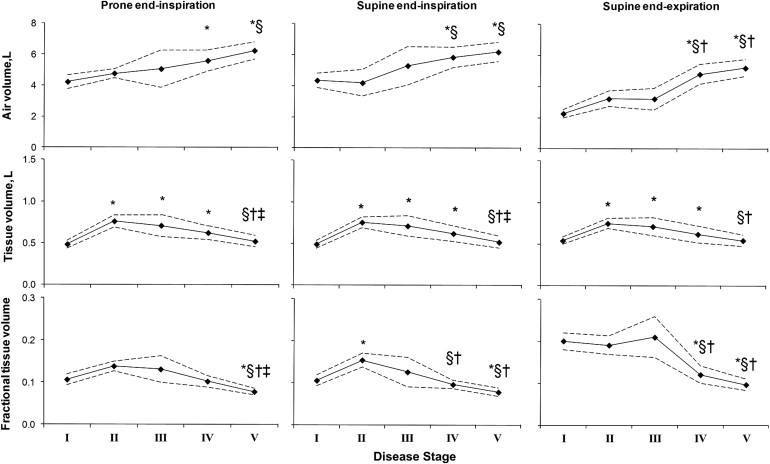
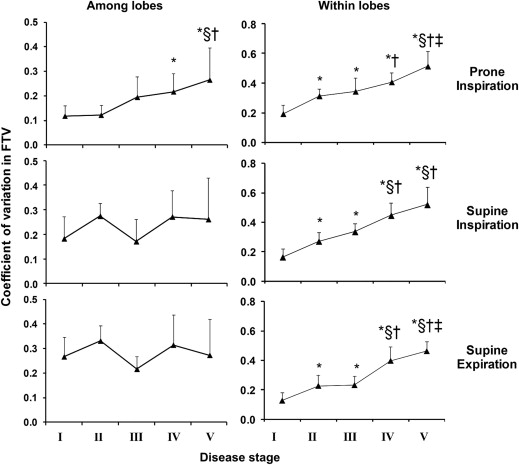
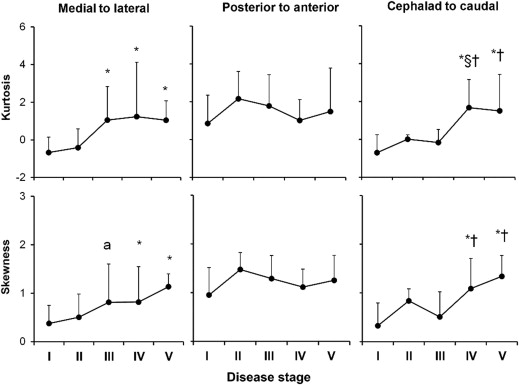
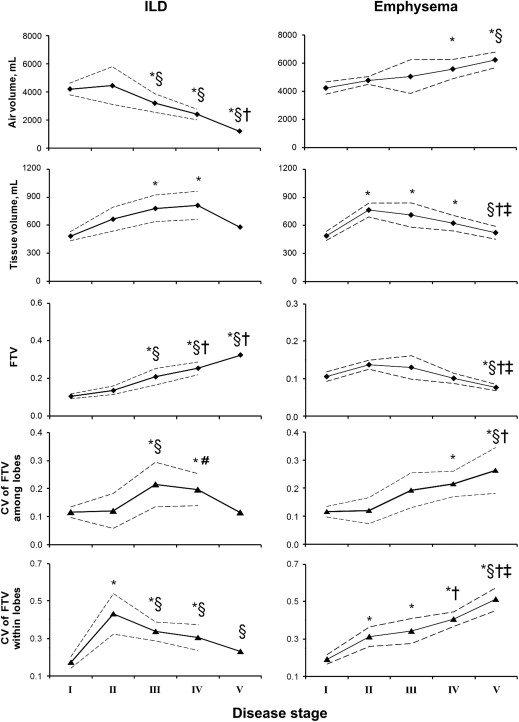
In emphysema, lobar air volume increased up to 177% above normal except in the right middle lobe. Lobar tissue volume increased up to 107% in mild-moderate stages then normalized in advanced stages. Normally, FTV was up to 82% higher in lower than upper lobes. In mild-moderate emphysema, lobar FTV increased by up to 74% above normal at supine inspiration. In severe emphysema, FTV declined below normal in all lobes and positions in correlation with pulmonary function ( P < .05). Markers of FTV heterogeneity increased steadily with disease stage in correlation with pulmonary function ( P < .05); the pattern is distinct from that seen in interstitial lung disease (ILD).
Conclusion
CT-derived biomarkers differentiate the spatial patterns of emphysema distribution and heterogeneity from that in ILD. Early emphysema is associated with elevated tissue volume and FTV, consistent with hyperemia, inflammation or atelectasis.
Introduction
Chest computed tomography (CT) is extensively used in the diagnosis and management of chronic lung disease. Clinical evaluation by CT is usually qualitative or semiquantitative, resulting in unavoidable spatial, temporal, interobserver and interscanner variability, particularly in the presence of volume change or local architectural distortion, making it difficult to match the same anatomical regions on successive scans. Currently, the large digital dataset generated by each CT study is routinely underused. Given the widespread use of CT, its expense and the small but real risk of harm due to cumulative radiation exposure , there is a corresponding need for standardized imaging biomarkers to objectively characterize anatomical disease severity and distribution, monitor pathological progression and assess response to therapy. By maximally exploiting the information content of CT datasets, quantitative image analysis has the potential to improve the precision and accuracy of patient stratification, cross-sectional comparisons and longitudinal follow-up.
Both attenuation-based and texture-based image analysis algorithms have been used to quantify pulmonary emphysema. Attenuation-based methods commonly employ an arbitrary threshold value (eg, −910 Hounsfield units [HU]) , to separate normal from emphysematous parenchyma ; these methods are relatively easy to use but highly sensitive to lung inflation. A range of threshold values has been reported , and most studies do not take into account intra- or interlobar heterogeneity, a key feature in emphysema evolution. Texture-based methods rely on analysis of detailed morphologic patterns on high-resolution CT (HRCT) (eg, shape, skewness, kurtosis, gradient, contrast, correlation, circularity, aspect ratio, area, number of clusters). Although offering more information, texture-based analysis involves greater computational complexity and higher cost.
Get Radiology Tree app to read full this article<
Materials and methods
Subjects
Get Radiology Tree app to read full this article<
HRCT
Get Radiology Tree app to read full this article<
Image Analysis
Get Radiology Tree app to read full this article<
Lobar Reconstruction
Get Radiology Tree app to read full this article<
HRCT-derived Indices
Get Radiology Tree app to read full this article<
Lobartissuevolume=LobarCTn−airCTnLiverCTn−airCTn×Totallobarvolume L
o
b
a
r
t
i
s
s
u
e
v
o
l
u
m
e
=
L
o
b
a
r
C
T
n
-
a
i
r
C
T
n
L
i
v
e
r
C
T
n
-
a
i
r
C
T
n
×
T
o
t
a
l
l
o
b
a
r
v
o
l
u
m
e
Lobarairvolume=Totallobarvolume−Lobartissuevolume L
o
b
a
r
a
i
r
v
o
l
u
m
e
=
T
o
t
a
l
l
o
b
a
r
v
o
l
u
m
e
−
L
o
b
a
r
t
i
s
s
u
e
v
o
l
u
m
e
Fractionaltissuevolume=LobartissuevolumeTotallobarvolume F
r
a
c
t
i
o
n
a
l
t
i
s
s
u
e
v
o
l
u
m
e
=
L
o
b
a
r
t
i
s
s
u
e
v
o
l
u
m
e
T
o
t
a
l
l
o
b
a
r
v
o
l
u
m
e
Get Radiology Tree app to read full this article<
Get Radiology Tree app to read full this article<
Get Radiology Tree app to read full this article<
Analyzing Images with and without Gaps
Get Radiology Tree app to read full this article<
Statistical Analysis
Get Radiology Tree app to read full this article<
Results
Get Radiology Tree app to read full this article<
Table 1
Demographic Data and Lung Function
Stage I II III IV V Emphysema severity Normal Mild Moderate Severe More Severe Number of subjects 20 3 7 10 10 Male/female 11/9 3/0 5/2 6/4 6/4 Age, y 51 ± 12 67 ± 8 ∗ 62 ± 9 ∗ 61 ± 12 ∗ 59 ± 6 ∗ Height, cm 171 ± 12 173 ± 11 171 ± 13 170 ± 13 168 ± 7 Weight, kg 79 ± 23 92 ± 30 78 ± 19 76 ± 21 75 ± 12 BMI, kg·m −2 28.8 ± 11.7 30.5 ± 7.3 25.7 ± 4.0 25.8 ± 4.5 26.3 ± 2.5 Hemoglobin, g·dL −1 13.7 ± 1.4 13.3 ± 1.2 14.1 ± 2.6 13.6 ± 0.8 13.3 ± 1.1 FEV 1 , L 3.33 ± 0.90 2.57 ± 0.06 2.21 ± 0.47 ∗ 1.11 ± 0.46 ∗,§,† 0.61 ± 0.25 ∗,§,†,‡ FEV 1 , % predicted 105 ± 14 85 ± 9 ∗ 65 ± 8 ∗,§ 31 ± 4 ∗,§,† 17 ± 5 ∗,§,†,‡ FVC, L 4.28 ± 1.10 4.47 ± 0.35 3.77 ± 0.62 2.91 ± 0.74 ∗,§ 2.02 ± 0.76 ∗,§,†,‡ FVC, % predicted 111 ± 15 108 ± 15 86 ± 7 ∗ 67 ± 11 ∗,§,† 54 ± 18 ∗,§,† FEV 1 /FVC 0.78 ± 0.04 0.58 ± 0.05 ∗ 0.59 ± 0.05 ∗ 0.37 ± 0.10 ∗,§,† 0.31 ± 0.09 ∗,§,†,‡ FEV 1 /FVC, % predicted 95 ± 5 79 ± 7 ∗ 76 ± 10 ∗ 47 ± 10 ∗,§,† 34 ± 8 ∗,§,†,‡ DL CO , mL·(min·mmHg) −1 23.3 ± 5.9 14.0 ± 6.1 ∗ 14.5 ± 7.5 ∗ 10.5 ± 7.7 ∗ 6.5 ± 1.3 ∗ DL CO , % predicted 88 ± 17 53 ± 11 ∗ 62 ± 22 ∗ 44 ± 22 ∗,† 30 ± 8 ∗,† TLC, L 5.77 ± 1.28 6.70 ± 0.26 6.42 ± 1.08 7.19 ± 1.35 ∗ 7.20 ± 1.28 ∗ RV, L 1.48 ± 0.52 2.07 ± 0.40 2.57 ± 0.33 ∗ 3.86 ± 0.72 ∗,§,† 4.40 ± 0.88 ∗,§,† RV/TLC 0.26 ± 0.08 0.31 ± 0.05 0.41 ± 0.06 ∗ 0.54 ± 0.07 ∗,§,† 0.61 ± 0.09 ∗,§,†,‡
BMI, body mass index; DL CO , lung diffusing capacity for carbon monoxide; FEV 1 , forced expiratory volume at 1 second; FVC, forced vital capacity; RV, residual volume; TLC, total lung capacity.
Mean ± SD.
P < .05
Get Radiology Tree app to read full this article<
Table 2
Whole Lung Attenuation Values and Histogram of FTV
Stage Emphysema severity I
Normal II
Mild III
Moderate IV
Severe V
More severe II-V
All Emphysema Attenuation (HU) Tracheal air −969 ± 9 −974 ± 19 −975 ± 13 −985 ± 8 ∗ −989 ± 2 ∗,§,† −983 ± 13 ∗ Liver 64 ± 9 60 ± 3 57 ± 10 57 ± 11 59 ± 6 58 ± 9 ∗ Histogram of FTV Prone end-inspiration Mean lung FTV 0.106 ± 0.029 0.138 ± 0.011 0.130 ± 0.042 0.101 ± 0.022 0.077 ± 0.013 ∗,§,†,‡ 0.104 ± 0.033 Kurtosis −0.558 1.513 −1.112 0.756 −0.025 0.620 Skewness 0.368 1.303 0.247 0.666 −0.376 0.727 Supine end-inspiration Mean lung FTV 0.106 ± 0.030 0.154 ± 0.015 ∗ 0.126 ± 0.047 0.096 ± 0.017 §,† 0.078 ± 0.017 ∗,§,† 0.102 ± 0.035 Kurtosis 0.304 −0.708 2.526 −0.765 −0.692 2.590 # Skewness 0.671 0.817 1.528 0.431 −0.342 1.283 # Supine end-expiration Mean lung FTV 0.201 ± 0.046 0.191 ± 0.020 0.210 ± 0.066 0.120 ± 0.033 ∗,§,† 0.096 ± 0.021 ∗,§,† 0.140 ± 0.060 ∗ Kurtosis −0.604 −1.603 0.156 −0.897 −0.488 1.601 Skewness 0.467 0.462 0.849 0.207 −0.078 1.071 # Critical values ( P < .05, two-sided) Kurtosis (range of normality) −1.27 to 2.56 −3.64 to 4.36 −2.79 to 4.10 −1.81 to 3.58 −1.71 to 3.44 −1.12 to 2.22 Skewness 1.03 1.83 1.68 1.44 1.37 0.894
FTV, fractional tissue volume calculated using tissue attenuation of the liver; HU, Hounsfield units.
Mean±SD.
P < .05
Get Radiology Tree app to read full this article<
Get Radiology Tree app to read full this article<
Get Radiology Tree app to read full this article<
Get Radiology Tree app to read full this article<
Get Radiology Tree app to read full this article<
Get Radiology Tree app to read full this article<
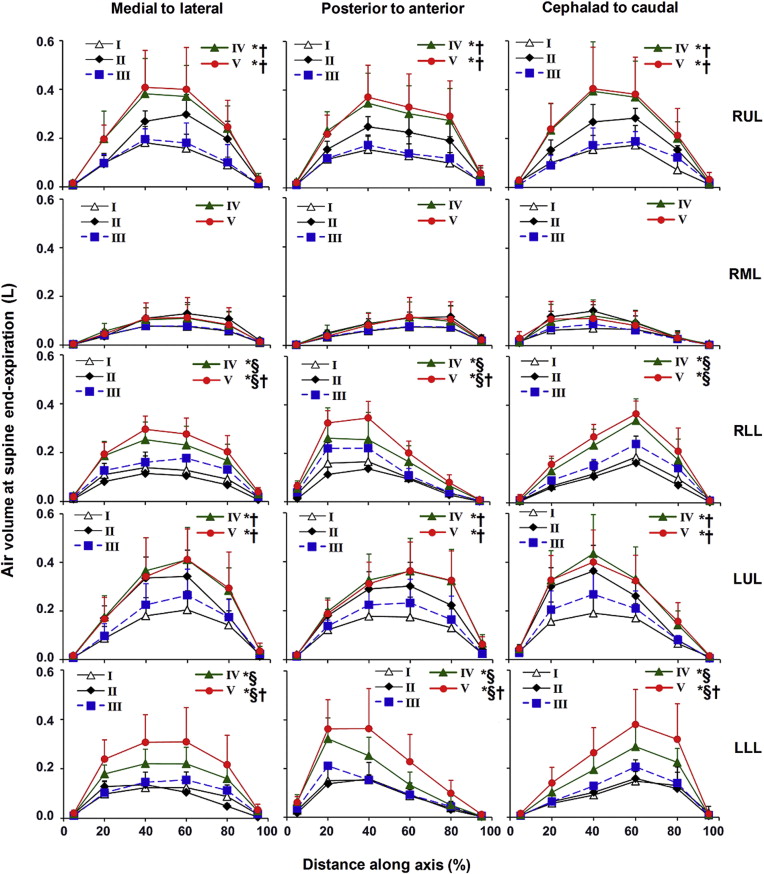
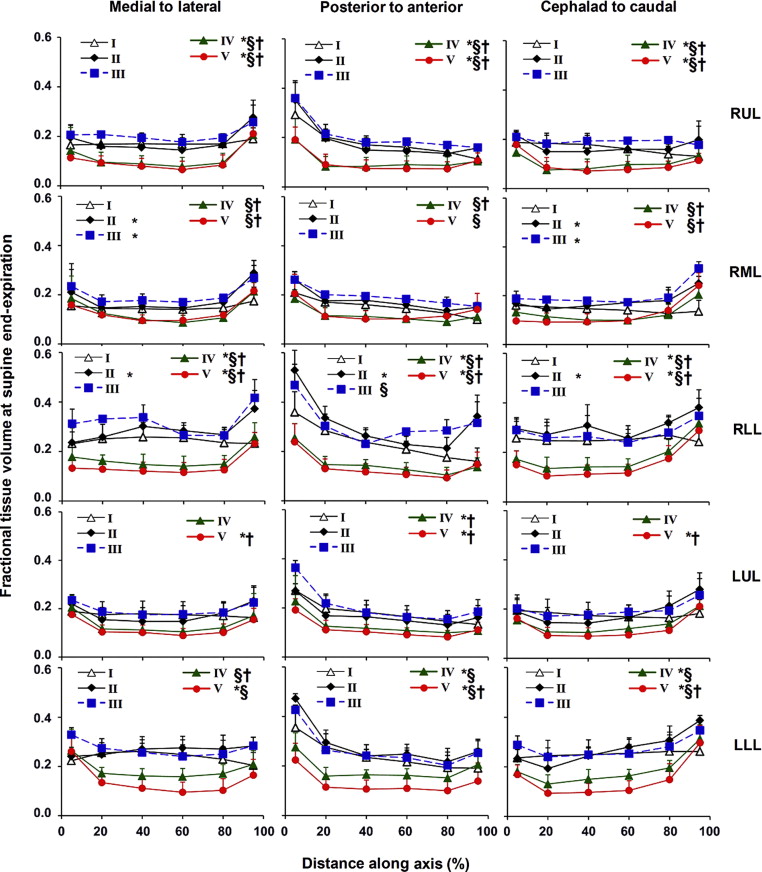
Table 3
Pearson Correlation Coefficients and 95% Confidence Interval (CI) for the Correlations of Whole Lung FTV, the Coefficients of Variation (CV) of FTV within and among Lobes, and the Kurtosis and Skewness of FTV, with Respect to Pulmonary Function
FTV
Supine End-expiration CV of FTV within Lobes
Supine End-inspiration CV of FTV among Lobes
Prone End-inspiration Kurtosis †
Supine End-expiration Skewness †
Supine End-expiration_r_ 95% CI_r_ 95% CI_r_ 95% CI_r_ 95% CI_r_ 95% CI FEV 1 , % pred 0.67 ∗ 0.47 to 0.80 −0.88 ∗ −0.93 to −0.79 −0.59 ∗ −0.75 to −0.37 −0.66 ∗ −0.79 to −0.46 −0.63 ∗ −0.77 to −0.41 FVC, % pred 0.55 ∗ 0.31 to 0.72 −0.75 ∗ −0.85 to −0.59 −0.56 ∗ −0.72 to −0.33 −0.58 ∗ −0.75 to −0.36 −0.55 ∗ −0.72 to −0.31 DL CO , % pred 0.52 ∗ 0.28 to 0.70 −0.79 ∗ −0.88 to −0.65 −0.46 ∗ −0.66 to −0.20 −0.59 ∗ −0.75 to −0.37 −0.63 ∗ −0.77 to −0.41 FEV 1 /FVC, % pred 0.73 ∗ 0.57 to 0.84 −0.88 ∗ −0.93 to −0.79 −0.59 ∗ −0.75 to −0.37 −0.65 ∗ −0.79 to −0.44 −0.64 ∗ −0.78 to −0.44 RV, L −0.75 ∗ −0.85 to −0.59 0.79 ∗ 0.64 to 0.88 0.64 ∗ 0.43 to 0.58 0.52 ∗ 0.27 to 0.71 0.45 ∗ 0.18 to 0.66 TLC, L −0.42 ∗ −0.63 to −0.15 0.37 ∗ 0.09 to 0.60 0.46 ∗ 0.20 to 0.66 0.25 −0.05 to 0.51 0.04 −0.26 to 0.33 RV/TLC −0.74 ∗ −0.85 to −0.57 0.81 ∗ 0.68 to 0.89 0.55 ∗ 0.31 to 0.73 0.54 ∗ 0.29 to 0.72 0.54 ∗ 0.29 to 0.72
DL CO , lung diffusing capacity for carbon monoxide; FEV 1 , forced expiratory volume at 1 second; FVC, forced vital capacity; RV, residual volume. TLC, total lung capacity.
Get Radiology Tree app to read full this article<
Get Radiology Tree app to read full this article<
Get Radiology Tree app to read full this article<
Get Radiology Tree app to read full this article<
Get Radiology Tree app to read full this article<
Get Radiology Tree app to read full this article<
Get Radiology Tree app to read full this article<
Discussion
Summary of Results
Get Radiology Tree app to read full this article<
Significance of the Findings
Get Radiology Tree app to read full this article<
Critique of Methods
Get Radiology Tree app to read full this article<
HRCT in Emphysema
Get Radiology Tree app to read full this article<
Comparison to ILD
Get Radiology Tree app to read full this article<
Get Radiology Tree app to read full this article<
Physiological Correlates
Get Radiology Tree app to read full this article<
Get Radiology Tree app to read full this article<
Get Radiology Tree app to read full this article<
Research and Clinical Applications
Get Radiology Tree app to read full this article<
Get Radiology Tree app to read full this article<
References
1. Smith-Bindman R.: Is computed tomography safe?. N Engl J Med 2010; 363: pp. 1-4.
2. Adams H., Bernard M.S., McConnochie K.: An appraisal of CT pulmonary density mapping in normal subjects. Clin Radiol 1991; 43: pp. 238-242.
3. Bakker M.E., Putter H., Stolk J., et. al.: Assessment of regional progression of pulmonary emphysema with CT densitometry. Chest 2008; 134: pp. 931-937.
4. Gevenois P.A., De Vuyst P., de Maertelaer V., et. al.: Comparison of computed density and microscopic morphometry in pulmonary emphysema. Am J Respir Crit Care Med 1996; 154: pp. 187-192.
5. Gould G.A., MacNee W., McLean A., et. al.: CT measurements of lung density in life can quantitate distal airspace enlargement—an essential defining feature of human emphysema. Am Rev Respir Dis 1988; 137: pp. 380-392.
6. Lovasi G.S., Diez Roux A.V., Hoffman E.A., et. al.: Socioeconomic status is positively associated with percent emphysema on CT scan: the MESA lung study. Acad Radiol 2011; 18: pp. 199-204.
7. Marsh S., Aldington S., Williams M.V., et. al.: Utility of lung density measurements in the diagnosis of emphysema. Respir Med 2007; 101: pp. 1512-1520.
8. Muller N.L., Coxson H.: Chronic obstructive pulmonary disease. 4: Imaging the lungs in patients with chronic obstructive pulmonary disease. Thorax 2002; 57: pp. 982-985.
9. Muller N.L., Staples C.A., Miller R.R., et. al.: “Density mask”. An objective method to quantitate emphysema using computed tomography. Chest 1988; 94: pp. 782-787.
10. Washko G.R., Criner G.J., Mohsenifar Z., et. al.: Computed tomographic-based quantification of emphysema and correlation to pulmonary function and mechanics. COPD 2008; 5: pp. 177-186.
11. Chabat F., Yang G.Z., Hansell D.M.: Obstructive lung diseases: texture classification for differentiation at CT. Radiology 2003; 228: pp. 871-877.
12. Song G., Mortani Barbosa E., Tustison N., et. al.: A comparative study of HRCT image metrics and PFT values for characterization of ILD and COPD. Acad Radiol 2012; 19: pp. 857-864.
13. Park Y.S., Seo J.B., Kim N., et. al.: Texture-based quantification of pulmonary emphysema on high-resolution computed tomography: comparison with density-based quantification and correlation with pulmonary function test. Invest Radiol 2008; 43: pp. 395-402.
14. Uppaluri R., Hoffman E.A., Sonka M., et. al.: Interstitial lung disease: a quantitative study using the adaptive multiple feature method. Am J Respir Crit Care Med 1999; 159: pp. 519-525.
15. Xu Y., Sonka M., McLennan G., et. al.: MDCT-based 3-D texture classification of emphysema and early smoking related lung pathologies. IEEE Trans Med Imaging 2006; 25: pp. 464-475.
16. Xu Y., van Beek E.J., Hwanjo Y., et. al.: Computer-aided classification of interstitial lung diseases via MDCT: 3D adaptive multiple feature method (3D AMFM). Acad Radiol 2006; 13: pp. 969-978.
17. Revel M.P., Faivre J.B., Remy-Jardin M., et. al.: Automated lobar quantification of emphysema in patients with severe COPD. Eur Radiol 2008; 18: pp. 2723-2730.
18. Clough A.V., Haworth S.T., Roerig D.L., et. al.: Influence of gravity on radiographic contrast material-based measurements of regional blood flow distribution. Acad Radiol 2003; 10: pp. 128-138.
19. Yilmaz C., Watharkar S.S., Diaz de Leon A., et. al.: Quantification of Regional Interstitial Lung Disease from CT-derived Fractional Tissue Volume: A Lung Tissue Research Consortium Study. Acad Radiol 2011; 18: pp. 1014-1023.
20. Diaz de Leon A., Cronkhite J.T., Yilmaz C., et. al.: Subclinical lung disease, macrocytosis, and premature graying in kindreds with telomerase (TERT) mutations. Chest 2011; 140: pp. 753-763.
21. Miller M.R., Hankinson J., Brusasco V., et. al.: Standardisation of spirometry. Eur Respir J 2005; 26: pp. 319-338.
22. Macintyre N., Crapo R.O., Viegi G., et. al.: Standardisation of the single-breath determination of carbon monoxide uptake in the lung. Eur Respir J 2005; 26: pp. 720-735.
23. Ravikumar P., Yilmaz C., Dane D.M., et. al.: Regional lung growth following pneumonectomy assessed by computed tomography. J Appl Physiol 2004; 97: pp. 1567-1574.
24. Ravikumar P., Yilmaz C., Dane D.M., et. al.: Developmental signals do not further accentuate nonuniform postpneumonectomy compensatory lung growth. J Appl Physiol 2007; 102: pp. 1170-1177.
25. Yilmaz C., Ravikumar P., Dane D.M., et. al.: Noninvasive quantification of heterogeneous lung growth following extensive lung resection by high-resolution computed tomography. J Appl Physiol 2009; 107: pp. 1569-1578.
26. Kelley D.E., Storlien L.: Skeletal muscle and obesity.Bray G.A.Bouchard C.Handbook of obesity, part II, etiology.2004.Marcel DekkerNew York:
27. The definition of emphysema. Report of a National Heart, Lung, and Blood Institute, Division of Lung Diseases workshop. Am Rev Respir Dis 1985; 132: pp. 182-185.
28. Kuwano K., Matsuba K., Ikeda T., et. al.: The diagnosis of mild emphysema. Correlation of computed tomography and pathology scores. Am Rev Respir Dis 1990; 141: pp. 169-178.
29. Bankier A.A., De Maertelaer V., Keyzer C., et. al.: Pulmonary emphysema: subjective visual grading versus objective quantification with macroscopic morphometry and thin-section CT densitometry. Radiology 1999; 211: pp. 851-858.
30. Shaker S.B., Stavngaard T., Stolk J., et. al.: Alpha1-antitrypsin deficiency. 7: Computed tomographic imaging in alpha1-antitrypsin deficiency. Thorax 2004; 59: pp. 986-991.
31. Marsh S., Aldington S., Williams M.V., et. al.: Physiological associations of computerized tomography lung density: a factor analysis. Int J Chron Obstruct Pulmon Dis 2006; 1: pp. 181-187.
32. Washko G.R., Hunninghake G.M., Fernandez I.E., et. al.: Lung volumes and emphysema in smokers with interstitial lung abnormalities. N Engl J Med 2011; 364: pp. 897-906.
33. Yamashiro T., Matsuoka S., Estepar R.S., et. al.: Kurtosis and skewness of density histograms on inspiratory and expiratory CT scans in smokers. COPD 2011; 8: pp. 13-20.