
Rationale and Objectives
This study investigated what factors radiologists take into account when estimating emphysema severity and assessed quantitative computed tomography (CT) measurements of low attenuation areas.
Materials and Methods
CT scans and spirometry were obtained on 1519 chronic obstructive pulmonary disease (COPD) subjects, 269 smoker controls, and 184 nonsmoker controls from the Evaluation of COPD Longitudinally to Indentify Surrogate Endpoints (ECLIPSE) study. CT scans were analyzed using the threshold technique (%<−950HU) and a low attenuation cluster analysis. Two radiologists scored emphysema severity (0 to 5 scale), described the predominant type and distribution of emphysema, and the presence of suspected small airways disease.
Results
The percent low attenuation area (%LAA) and visual scores of emphysema severity correlated well ( r = 0.77, P < .001). %LAA, low attenuation cluster analysis, and absence of radiologist described gas trapping, distribution, and predominant type of emphysema were predictors of visual scores of emphysema severity (all P < .001). CT scans scored as showing regions of gas trapping had smaller lesions for a similar %LAA than those without ( P < .001).
Conclusions
Visual estimates of emphysema are not only determined by the extent of LAA, but also by lesion size, predominant type, and distribution of emphysema and presence/absence of areas of small airways disease. A computer analysis of low attenuation cluster size helps quantitative algorithms discriminate low attenuation areas from gas trapping, image noise, and emphysema.
The introduction of computed tomography (CT) has changed the way that clinicians diagnose and quantify the extent of emphysema in living individuals. It was recognized early on that the frequency distribution of x-ray attenuation values in a CT image of the lung (CT densitometry) could produce an estimate of the extent of emphysema . Even though there has been a great deal of attention given to densitometric assessment of emphysema , the daily clinical routine is still to visually grade disease extent and severity.
Both densitometry and visual grading of emphysema extent have been shown to correlate well with the extent of emphysema on histology specimens. However, the estimations produced by densitometry have been reported to be similar to the extent of emphysema in histology specimens, whereas visual estimations tend to overestimate the extent of emphysema . Visual scores, on the other hand, have been reported to show stronger associations with spirometry data , the core diagnostic test to detect and stage chronic obstructive pulmonary disease (COPD) .
Get Radiology Tree app to read full this article<
Get Radiology Tree app to read full this article<
Material and methods
Subjects
Get Radiology Tree app to read full this article<
Pulmonary Function Testing
Get Radiology Tree app to read full this article<
CT and Quantitative Analysis (Densitometry)
Get Radiology Tree app to read full this article<
Qualitative Analysis (Visual Scoring)
Get Radiology Tree app to read full this article<
Statistics
Get Radiology Tree app to read full this article<
Ethics Approval
Get Radiology Tree app to read full this article<
Results
Demographics
Get Radiology Tree app to read full this article<
Table 1
Demographic Data by Study Group (A) and GOLD Stage (B)
Table 1A_P_ Values COPD Subjects Smoker Controls Non-smoker Controls Overall COPD vs Smoker Controls COPD vs. Nonsmoker Controls Smoker Controls vs. Nonsmoker Controls_n_ 1519 269 184 Age (y) 63.2 (6.9) 54.8 (8.9) 54.1 (9.1) <.001 <.001 <.001 .329 Sex (M/F) 960/559 151/118 65/119 <.001 .028 <.001 <.001 Height 169.5 (8.9) 172.1 (9.1) 167.9 (8.8) <.001 <.001 .027 <.001 Weight 74.7 (17.3) 78.8 (14.9) 76.9 (16.1) <.001 <.001 .093 .238 Body mass index 25.9 (5.2) 26.5 (4.2) 27.2 (4.9) .001 .055 .001 .175 Pack-years 48.0 (26.3) 31.5 (22.6) 0.0 (0.1) <.001 <.001 <.001 <.001 Current smoker (%) 38% 63% 0 <.001 <.001 <.001 <.001 Never smoked (%) 0 0 96% FEV1% predicted 48.8 (15.8) 109.0 (11.5) 115.6 (13.6) <.001 <.001 <.001 <.001 FEV1/FVC 44.4 (11.5) 79.1 (5.1) 81.4 (5.2) <.001 <.001 <.001 .022 % LAA 18.1 (12.5) 2.3 (3.0) 4.2 (4.2) <.001 <.001 <.001 .076
Table 1B_P_ Values GOLD II GOLD III GOLD IV Overall GOLD II vs GOLD III GOLD II vs GOLD IV GOLD III vs GOLD IV_n_ 692 635 190 Age (y) 63.2 (7.1) 63.5 (6.8) 61.6 (6.9) .005 .486 .005 .001 Sex (M/F) 404/288 423/212 132/58 .001 .002 .006 .461 Height 169.0 (9.1) 169.7 (8.7) 170.2 (8.9) .202 .184 .119 .509 Weight 76.7 (17.3) 73.7 (16.6) 70.9 (18.5) <.001 .002 <.001 .044 Body mass index 26.7 (5.1) 25.5 (5.1) 24.3 (5.3) <.001 <.001 <.001 .004 Pack-years 47.0 (28.1) 49.1 (24.3) 48.5 (25.9) .335 .146 .467 .807 Current smoker (%) 39% 38% 29% .047 .825 .016 .025 FEV1% predicted 63.2 (8.4) 40.2 (5.8) 24.5 (3.7) <.001 <.001 <.001 <.001 FEV1/FVC 52.3 (8.8) 39.6 (8.5) 31.5 (7.5) <.001 <.001 <.001 <.001 % LAA 12.3 (9.7) 21.0 (11.8) 29.5 (12.6) <.001 <.001 <.001 <.001
Results are given as mean ± standard deviation.
FEV 1 , forced expiratory volume in 1 second; FVC, forced vital capacity; %LAA, percent low attenuation area.
Table 2
Radiologist Graded Emphysema Extent Scores by Study Group (A) and GOLD Stage (B)
Table 2A EmphysemaExtent Emphysema Grade COPD Subjects n (%) Smoker Controls n (%) Nonsmoker Controls n (%) No emphysema 0 72 (4.7) 19 (7.1) 68 (37.0) 0.5 3 (0.2) 0 2 (1.1) <5%, trivial 1 283 (18.6) 227 (84.4) 110 (59.8) 1.5 105 (6.9) 9 (3.3) 3 (1.6) 5–25%, mild 2 216 (14.2) 9 (3.3) 0 2.5 100 (6.6) 1 (0.4) 1 (0.5) 26–50%, moderate 3 195 (12.8) 4 (1.5) 0 3.5 109 (7.2) 0 0 51–75%, severe 4 184 (12.1) 0 0 4.5 105 (6.9) 0 0 >75%, very severe 5 147 (9.7) 0 0
Table 2B Emphysema Extent Emphysema Grade GOLD II n (%) GOLD III n (%) GOLD IV n (%) No emphysema 0 52 (7.5) 18 (2.8) 2 (1.1) 0.5 2 (0.3) 1 (0.2) 0 <5%, trivial 1 197 (28.5) 76 (12.0) 10 (5.3) 1.5 59 (8.5) 41 (6.5) 4 (2.1) 5–25%, mild 2 126 (18.2) 74 (11.7) 15 (7.9) 2.5 45 (6.5) 42 (6.6) 13 (6.8) 26–50%, moderate 3 88 (12.7) 86 (13.5) 21 (11.1) 3.5 37 (5.3) 58 (9.1) 14 (7.4) 51–75%, severe 4 43 (6.2) 108 (17.0) 33 (17.4) 4.5 20 (2.9) 55 (8.7) 30 (15.8) >75%, very severe 5 23 (3.3) 76 (12.0) 48 (25.3)
Computed tomography scans were graded using a 6-point grading scale: 0 = no emphysema, 1 = <5% (trivial), 2 = 5–25% (mild), 3 = 26–50% (moderate), 4 = 51–75% (severe), and 5 = >75% involvement of both lungs (very severe). In case of disagreement, the mean score of the two readers was used as the final score (0.5, 1.5, 2.5, 3.5, or 4.5). Values are shown as the number of subjects in each grade and as the percent of total number of subjects in the group.
COPD, chronic obstructive pulmonary disease.
Get Radiology Tree app to read full this article<
Quantitative versus Qualitative Analysis and Impact of Lesion Size
Get Radiology Tree app to read full this article<
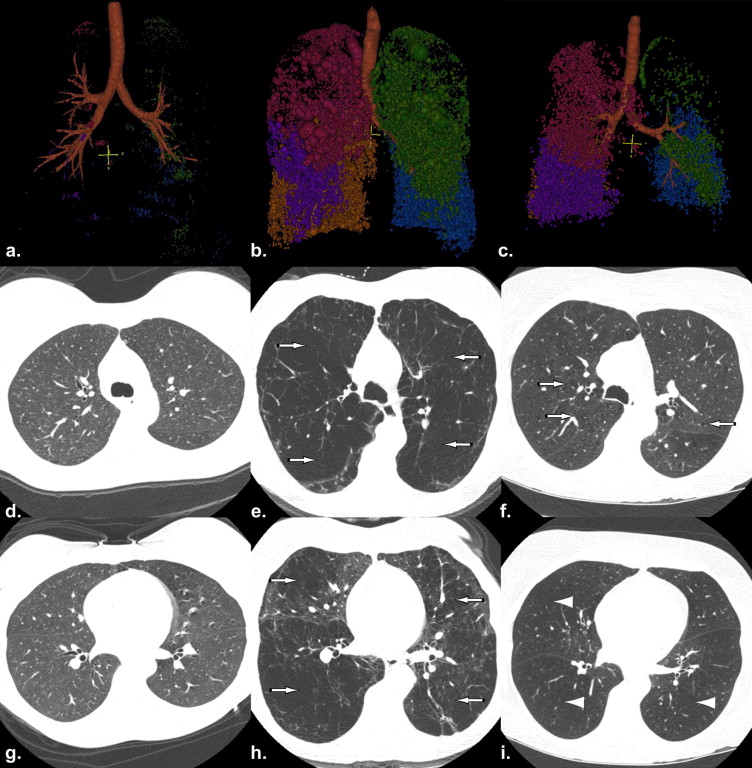
Table 3
Extent of Low-attenuation Areas for Each Emphysema Score
Emphysema Extent Emphysema Grade %LAA (−950 HU) 5‒95% Confidence Intervals Decreased Attenuation n (%) No emphysema 0 6.3 (6.5) 0.4–20.9 92 (57.9) 0.5 7.0 (3.7) 1.4–10.1 4 (80.0) <5%, trivial 1 5.4 (5.9) 0.2–18.2 231 (37.3) 1.5 9.7 (8.1) 0.5–25.8 61 (52.1) 5–25%, mild 2 10.8 (7.6) 1.5–25.8 99 (44.0) 2.5 14.5 (7.4) 2.5–27.3 38 (37.3) 26–50%, moderate 3 17.4 (7.7) 5.0–30.6 47 (23.6) 3.5 21.9 (9.7) 7.9–39.3 22 (20.2) 51–75%, severe 4 27.1 (10.4) 12.6–45.9 15 (8.2) 4.5 31.9 (9.4) 15.3–46.8 11 (10.5) >75%, very severe 5 35.8 (9.4) 20.3–50.7 1 (0.7)
The last column represents the frequency of computed tomography scans scored as showing areas of decreased attenuation consistent with “gas-trapping” from small airways disease for each emphysema score. Results are shown as means and standard deviation (SD) except the decreased attenuation column which is the number of subjects and the percent of the group. The same grading system is used as described in Table 2 .
HU, Hounsfield units; %LAA, percent low attenuation area.
Get Radiology Tree app to read full this article<
Get Radiology Tree app to read full this article<
Get Radiology Tree app to read full this article<
Table 4
Frequencies of Types of Emphysema by Study Group (A) and GOLD Stage (B)
Table 4A Emphysema Type COPD Subjects n (%) Smoker Controls n (%) Nonsmoker Controls n (%) Centrilobular 1252 (82.4) 177 (65.8) 100 (54.3) Paraseptal 151 (9.9) 73 (27.1) 16 (8.7) Panacinar 44 (2.9) 0 0 Not applicable 72 (4.7) 19 (7.1) 68 (37.0)
Table 4B Emphysema Type GOLD II n (%) GOLD III n (%) GOLD IV n (%) Centrilobular 530 (76.6) 549 (86.5) 171 (90.0) Paraseptal 103 (14.9) 43 (6.8) 5 (2.6) Panacinar 7 (1.0) 25 (3.9) 12 (6.3) Not applicable 52 (7.5) 18 (2.8) 2 (1.1)
Results are shown as the number of subjects and the percent (%) of the total number of subjects in each group. For those who did not show emphysema, type is “not applicable.” If emphysema was present, but the radiologists were not sure about the type of emphysema, type was scored as “unknown.”
Table 5
Distribution of Emphysema as Scored by the Radiologists by Study Group (A) and GOLD Stage (B)
Table 5A Emphysema Distribution COPD Subjects n (%) Smoker Controls n (%) Nonsmoker Controls n (%) Upper lobe 1083 (71.3) 232 (86.2) 110 (59.8) Lower lobe 83 (5.5) 5 (1.9) 4 (2.2) Diffuse 281 (18.5) 13 (4.8) 2 (1.1) Not applicable 72 (4.7) 19 (7.1) 68 (37.0)
Table 5B Emphysema Distribution GOLD II n (%) GOLD III n (%) GOLD IV n (%) Upper lobe 521 (75.3) 432 (68.0) 128 (67.4) Lower lobe 25 (3.6) 46 (7.2) 12 (6.3) Diffuse 94 (13.6) 139 (21.9) 48 (25.3) Not applicable 52 (7.5) 18 (2.8) 2 (1.1)
Results are shown as the number of subjects and the percent of the total number of subjects in each group. For those who did not show emphysema, distribution is “not applicable.” If emphysema was present, but the radiologists were not sure about the distribution of emphysema, distribution was scored as “unknown.”
Get Radiology Tree app to read full this article<
Factors Predicting Radiologists’ Results
Get Radiology Tree app to read full this article<
Table 6
Odds Ratios (95% CI) for Each Cumulative Logit in Partial Proportional Odds Model (A) and Odds Ratios (95% CI) for Proportional Odds Model (B)
Table 6A Score = 5 Score ≥4 Score ≥3 Score ≥2 %LAA 1.11 (1.09‒1.12) 1.11 (1.09‒1.12) 1.11 (1.09‒1.12) 1.11 (1.09‒1.12) Trapping: no vs. yes 5.02 (3.95‒6.38) 5.02 (3.95‒6.38) 5.02 (3.95‒6.38) 5.02 (3.95‒6.38) Diffuse vs. upper 1.81 (1.24‒2.64) 2.26 (1.59‒3.21) 3.58 (2.37‒5.42) 4.38 (2.42‒7.96) Lower vs. upper 2.35 (1.01‒5.51) 6.25 (3.22‒12.15) 4.45 (2.32‒8.56) 3.46 (1.33‒9.00) Low attenuation cluster analysis 4.38 (1.86‒10.33) 14.96 (7.54‒29.69) 17.43 (9.95‒30.52) 24.88 (13.55‒45.67) Centrilobular: no vs. yes 0.24 (0.16‒0.34) 0.24 (0.16‒0.34) 0.24 (0.16‒0.34) 0.24 (0.16‒0.34)
Table 6B Proportional Odds Model %LAA 1.10 (1.08‒1.11) Trapping: no vs. yes 4.73 (3.74‒5.99) Diffuse vs. upper 2.68 (2.06‒3.48) Lower vs. upper 4.15 (2.58‒6.67) Low attenuation cluster analysis 18.91 (12.13‒29.48) Centrilobular: No vs. yes 0.24 (0.17‒0.34)
%LAA, percent low attenuation area.
Get Radiology Tree app to read full this article<
Discussion
Get Radiology Tree app to read full this article<
Get Radiology Tree app to read full this article<
Get Radiology Tree app to read full this article<
Get Radiology Tree app to read full this article<
Get Radiology Tree app to read full this article<
Get Radiology Tree app to read full this article<
Get Radiology Tree app to read full this article<
Get Radiology Tree app to read full this article<
Acknowledgments
Get Radiology Tree app to read full this article<
Get Radiology Tree app to read full this article<
Get Radiology Tree app to read full this article<
Get Radiology Tree app to read full this article<
Appendix 1
Principal investigators and centers participating in eclipse (NCT00292552, SCO104960)
Get Radiology Tree app to read full this article<
Get Radiology Tree app to read full this article<
Get Radiology Tree app to read full this article<
Get Radiology Tree app to read full this article<
Get Radiology Tree app to read full this article<
Get Radiology Tree app to read full this article<
Get Radiology Tree app to read full this article<
Get Radiology Tree app to read full this article<
Get Radiology Tree app to read full this article<
Get Radiology Tree app to read full this article<
Get Radiology Tree app to read full this article<
Get Radiology Tree app to read full this article<
Get Radiology Tree app to read full this article<
References
1. Gould G.A., MacNee W., McLean A., et. al.: CT measurements of lung density in life can quantitate distal airspace enlargement—an essential defining feature of human emphysema. Am Rev Respir Dis 1988; 137: pp. 380-392.
2. Hayhurst M.D., Flenley D.C., McLean A., et. al.: Diagnosis of pulmonary emphysema by computerized tomography. Lancet 1984; 2: pp. 320-322.
3. Müller N.L., Staples C.A., Miller R.R., et. al.: “Density mask”. An objective method to quantitate emphysema using computed tomography. Chest 1988; 94: pp. 782-787.
4. Coxson H.O., Rogers R.M., Whittall K.P., et. al.: A quantification of the lung surface area in emphysema using computed tomography. Am J Respir Crit Care Med 1999; 159: pp. 851-856.
5. Gevenois P.A., de Maertelaer V., De Vuyst P., et. al.: Comparison of computed density and macroscopic morphometry in pulmonary emphysema. Am J Respir Crit Care Med 1995; 152: pp. 653-657.
6. Gevenois P.A., De Vuyst P., de Maertelaer V., et. al.: Comparison of computed density and microscopic morphometry in pulmonary emphysema. Am J Respir Crit Care Med 1996; 154: pp. 187-192.
7. Madani A., De Maertelaer V., Zanen J., et. al.: Pulmonary emphysema: radiation dose and section thickness at multidetector CT quantification—comparison with macroscopic and microscopic morphometry. Radiology 2007; 243: pp. 250-257.
8. Shaker S.B., Dirksen A., Laursen L.C., et. al.: Short-term reproducibility of computed tomography-based lung density measurements in alpha-1 antitrypsin deficiency and smokers with emphysema. Acta Radiol 2004; 45: pp. 424-430.
9. Bergin C., Muller N., Nichols D.M., et. al.: The diagnosis of emphysema. A computed tomographic-pathologic correlation. Am Rev Respir Dis 1986; 133: pp. 541-546.
10. Hruban R.H., Meziane M.A., Zerhouni E.A., et. al.: High resolution computed tomography of inflation-fixed lungs: pathologic-radiologic correlation of centrilobular emphysema. Am Rev Respir Dis 1987; 136: pp. 935-940.
11. Kuwano K., Matsuba K., Ikeda T., et. al.: The diagnosis of mild emphysema. Correlation of computed tomography and pathology scores. Am Rev Respir Dis 1997; 141: pp. 169-178.
12. Bankier A.A., De Maertelaer V., Keyzer C., et. al.: Pulmonary emphysema: subjective visual grading versus objective quantification with macroscopic morphometry and thin-section CT densitometry. Radiology 1999; 211: pp. 851-858.
13. Gurney J.W., Jones K.K., Robbins R.A., et. al.: Regional distribution of emphysema: correlation of high- resolution CT with pulmonary function tests in unselected smokers. Radiology 1992; 183: pp. 457-463.
14. Park K.J., Bergin C.J., Clausen J.L.: Quantitation of emphysema with three-dimensional CT densitometry: comparison with two-dimensional analysis, visual emphysema scores, and pulmonary function test results. Radiology 1999; 211: pp. 541-547.
15. Rabe K.F., Hurd S., Anzueto A., et. al.: Global strategy for the diagnosis, management, and prevention of chronic obstructive pulmonary disease: GOLD executive summary. Am J Respir Crit Care Med 2007; 176: pp. 532-555.
16. Uppaluri R., Mitsa T., Sonka M., et. al.: Quantification of pulmonary emphysema from lung computed tomography images. Am J Respir Crit Care Med 1997; 156: pp. 248-254.
17. Coxson H.O., Whittall K.P., Nakano Y., et. al.: Selection of patients for lung volume reduction surgery using a power law analysis of the computed tomographic scan. Thorax 2003; 58: pp. 510-514.
18. Mishima M., Hirai T., Itoh H., et. al.: Complexity of terminal airspace geometry assessed by lung computed tomography in normal subjects and patients with chronic obstructive pulmonary disease. Proc Natl Acad Science U S A 1999; 96: pp. 8829-8834.
19. Madani A., Van Muylem A., de Maertelaer V., et. al.: Pulmonary emphysema: size distribution of emphysematous spaces on multidetector CT images—comparison with macroscopic and microscopic morphometry. Radiology 2008; 248: pp. 1036-1041.
20. Martinez F.J., Foster G., Curtis J.L., et. al.: Predictors of mortality in patients with emphysema and severe airflow obstruction. Am J Respir Crit Care Med 2006; 173: pp. 1326-1334.
21. Agusti A., Calverley P.M., Celli B., et. al.: Characterisation of COPD heterogeneity in the ECLIPSE cohort. Respir Res 2010; 11: pp. 122.
22. Lomas D.A., Silverman E.K., Edwards L.D., et. al.: Serum surfactant protein D is steroid sensitive and associated with exacerbations of COPD. Eur Respir J 2009; 34: pp. 95-102.
23. Vestbo J., Anderson W., Coxson H.O., et. al.: Evaluation of COPD Longitudinally to Identify Predictive Surrogate End-points (ECLIPSE). Eur Respir J 2008; 31: pp. 869-873.
24. Lomas D.A., Silverman E.K., Edwards L.D., et. al.: Evaluation of serum CC-16 as a biomarker for COPD in the ECLIPSE cohort. Thorax 2008; 63: pp. 1058-1063.
25. Zhang L., Hoffman E.A., Reinhardt J.M.: Atlas-driven lung lobe segmentation in volumetric X-ray CT images. IEEE Trans Med Imaging 2006; 25: pp. 1-16.
26. Hansell D.M., Bankier A.A., MacMahon H., et. al.: Fleischner Society: glossary of terms for thoracic imaging. Radiology 2008; 246: pp. 697-722.
27. Landis J.R., Koch G.G.: The measurement of observer agreement for categorical data. Biometrics 1977; 33: pp. 159-174.
28. Stolks M.E., Davis C.S., Koch G.G.: Categorical data analysis using the SAS system.2000.SAS Institute IncCary, NC
29. Copley S.J., Wells A.U., Hawtin K.E., et. al.: Lung morphology in the elderly: comparative CT study of subjects over 75 years old versus those under 55 years old. Radiology 2009; 251: pp. 566-573.
30. Madani A., Zanen J., de Maertelaer V., et. al.: Pulmonary emphysema: objective quantification at multi-detector row CT - comparison with macroscopic and microscopic morphometry. Radiology 2006; 238: pp. 1036-1043.
31. Dransfield M.T., Washko G.R., Foreman M.G., et. al.: Gender differences in the severity of CT emphysema in COPD. Chest 2007; 132: pp. 464-470.
32. Patel B.D., Coxson H.O., Pillai S.G., et. al.: Airway wall thickening and emphysema show independent familial aggregation in COPD. Am J Respir Crit Care Med 2008; 178: pp. 500-505.