
Rationale and Objectives
To quantitatively assess coronary atherosclerotic plaque composition in patients with acute non–ST elevation myocardial infarction (NSTEMI) and patients with stable coronary artery disease (CAD) by coronary computed tomography angiography (cCTA) correlated with virtual histology intravascular ultrasound (VH-IVUS).
Materials and Methods
Sixty patients (35 with NSTEMI) were included. Corresponding plaques were assessed by dual-source cCTA and VH-IVUS regarding volumes and percentages of fatty, fibrous, and calcified component; overall plaque burden; and maximal percent area stenosis. Possible differences between patient groups were investigated. Concordance between cCTA and VH-IVUS measurements was validated by Bland–Altman analysis.
Results
Forty corresponding plaques (22 of patients with NSTEMI) were finally analyzed by cCTA and VH-IVUS. cCTA plaque analysis revealed no significant differences between plaques of patients with NSTEMI and stable CAD regarding absolute and relative amounts of any plaque component (fatty: 20 mm³/13% versus 17 mm³/14%; fibrous: 81 mm³/63% versus 80 mm³/53%; calcified: 16 mm³/14% versus 26 mm³/26%; all P > .05) or overall plaque burden (153 mm³ versus 165 mm³; P > .05), nor did VH-IVUS plaque analysis. VH-IVUS measured a higher area stenosis in patients with NSTEMI compared to patients with stable CAD (76% versus 68%, P = .01; in cCTA 69% versus 65%, P = .2). Volumes of fatty component were measured systematically lower in cCTA, whereas calcified and fibrous volumes were higher. No significant bias was observed comparing volumes of overall noncalcified component and overall plaque burden.
Conclusion
Plaques of patients with acute NSTEMI and of patients with stable CAD cannot be differentiated by quantification of plaque components. cCTA and VH-IVUS differ in plaque component analysis.
Coronary CT angiography (cCTA) has been proved to reliably exclude presence of coronary artery disease (CAD) and is increasingly used to assess CAD and further characterize atherosclerotic lesions as well . Histopathology studies have assessed characteristics of stable and instable plaques . The likeliness of a plaque to rupture—its vulnerability—and to subsequently cause vessel obstruction and myocardial infarction is known to be largely dependent on its composition, and strong efforts are made to reliably risk-stratify plaques and patients. The invasive reference standard for plaque composition imaging is intravascular ultrasound (IVUS) . The search for accurate noninvasive plaque imaging modalities is ongoing. With further improvement of temporal and spatial resolution, cCTA continues to emerge as a promising technique in the quest for a noninvasive plaque imaging reference standard .
Plaque analysis with cCTA was previously evaluated in mostly select plaque and patient samples concerning, for example, proximal lesion localization, nonobstructive CAD, absence of arrhythmias, or low Agatston score with the goal of achieving optimal CT image quality . The parameters most frequently studied were stenosis grading, overall plaque burden, and classification into calcified and noncalcified plaques and plaque components. Data about the performance of cCTA with regard to further differentiation and quantification of plaque components in correlation to virtual histology IVUS (VH-IVUS) are limited. To our knowledge, Brodoefel et al were the first to differentiate and quantitatively assess fatty, fibrous, and calcified components using dual-source CT in plaques of patients with stable CAD .
Get Radiology Tree app to read full this article<
Get Radiology Tree app to read full this article<
Materials and methods
Ethics Statement
Get Radiology Tree app to read full this article<
Study Population
Get Radiology Tree app to read full this article<
cCTA
Image acquisition
Get Radiology Tree app to read full this article<
Get Radiology Tree app to read full this article<
Get Radiology Tree app to read full this article<
Get Radiology Tree app to read full this article<
cCTA image reconstruction
Get Radiology Tree app to read full this article<
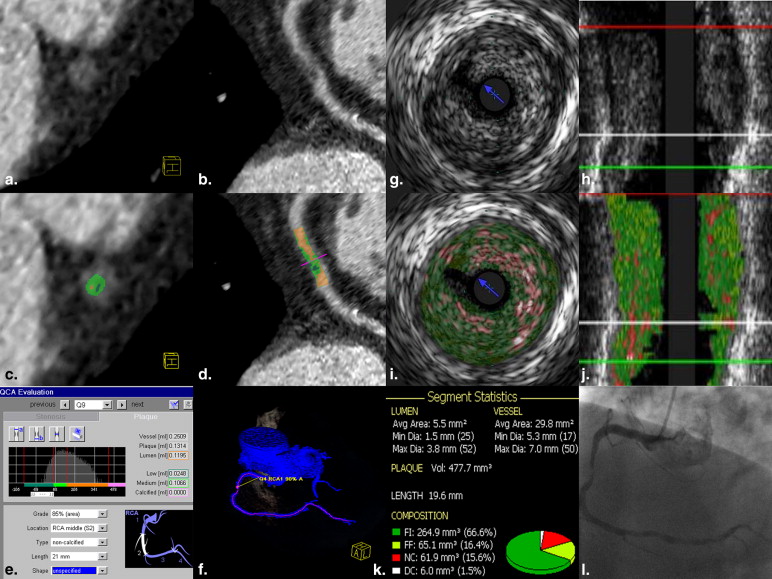
CT plaque analysis
Get Radiology Tree app to read full this article<
Get Radiology Tree app to read full this article<
Get Radiology Tree app to read full this article<
Get Radiology Tree app to read full this article<
ICA and IVUS
Image acquisition
Get Radiology Tree app to read full this article<
VH-IVUS image reconstruction and plaque analysis
Get Radiology Tree app to read full this article<
Get Radiology Tree app to read full this article<
Statistical Analysis
Get Radiology Tree app to read full this article<
Results
Get Radiology Tree app to read full this article<
Get Radiology Tree app to read full this article<
Table 1
Patient Characteristics
Patient Group_P_ Value NSTEMI Stable CAD Total No. 15 13 Men/women 13/2 10/3 .64 Age (yr) 72.6 ± 8.9 71.4 ± 8.3 .71 Cardiovascular risk factors Hypertension 13/15 (87%) 9/13 (69%) 1.00 Dyslipidemia 8/15 (53%) 11/13 (85%) .38 Diabetes mellitus 3/15 (20%) 1/13 (8%) .63 Smoking history 7/15 (47%) 3/13 (23%) .68 BMI (kg/m²) 26.3 ± 3.8 30.0 ± 4.1 .04 ∗ Laboratory findings Triglycerides (mg/dL) 118.0 ± 40.2 116.0 ± 52.7 .91 Total cholesterol (mg/dL) 176.1 ± 37.9 156.6 ± 26.2 .13 LDL (mg/dL) 111.1 ± 37.0 98.6 ± 22.1 .30 HDL (mg/dL) 47.7 ± 17.4 42.1 ± 11.2 .32 CRP (mg/L) 4.4 (2.9–14.6) 2.9 (2.9–5.7) .20 Agatston score 252 (78–878.4) 507.3 (237.4–918.0) .70
BMI, body mass index; CRP, C-reactive protein; HDL, high-density lipoprotein; LDL, low-density lipoprotein; NSTEMI, non–ST elevation myocardial infarction; CAD, coronary artery disease. Values are expressed as counts (percentages), median (25th to 75th percentile), or mean ± standard deviation. Statistical independence of the groups is expressed by P value on the basis of Fisher exact test statistics for categorical variables, Wilcoxon rank sum test for non-normally distributed data, or Student t test for normally distributed data.
Get Radiology Tree app to read full this article<
Table 2
Plaque Localization
Localization in Coronary Tree AHA Segments Patients with NSTEMI Patients with Stable CAD Counts Percentage (%) Distal 3, 4, 8, 10, 14, 15 7 2 9 22.5 Mid 2, 7, 9, 12, 13 (16) ∗ 10 8 18 45.0 Proximal 1, 5, 6, 11 5 8 13 32.5 Sum 22 18 40 100.0
AHA, American Heart Association; CAD, coronary artery disease; NSTEMI, non–ST elevation myocardial infarction. Segmentation of coronary tree is based on the 1976 AHA 15-segment model by .
Get Radiology Tree app to read full this article<
Get Radiology Tree app to read full this article<
Get Radiology Tree app to read full this article<
Table 3
Comparison of Plaques of the Two Patient Groups with cCTA and VH-IVUS
cCTA VH-IVUS NSTEMI Stable CAD_P_ Value NSTEMI Stable CAD_P_ Value Area stenosis (%) 68.9 ± 10.6 64.6 ± 10.1 .20 76.2 ± 8.7 68.3 ± 8.2 ∗ Overall plaque burden (mm³) 141.5 (89.6–210.8) 150.8 (98.3–253.6) .65 121.3 (90.3–239.1) 89.9 (61.7–154) .08 Noncalcified plaque component (%) 85.9 (68.5–94.9) 73.8 (48.7–87.8) .21 87.7 (83.9–95.5) 86.4 (80.0–89.6) .28 Fatty plaque component (%) 12.9 (7.5–28.3) 13.6 (6.8–30.2) .89 35.7 (33.6–39.0) 35.4 (33.2–38.5) .68 Fibrous plaque component (%) 67.1 (41.3–77.2) 55.9 (34.1–72.0) .14 51.2 (44.6–60.9) 49.3 (41.8–58.7) .42 Calcified plaque component (%) 14.1 (5.1–31.5) 26.2 (12.2–51.3) .21 12.3 (4.5–16.1) 13.6 (10.4–20.0) .28 Noncalcified plaque component (mm³) 110.9 (61.9–157.9) 96.5 (46.0–142.3) .87 70.6 (51.6–149.3) 52.7 (28.0–82.1) .08 Fatty plaque component (mm³) 19.4 (11.1–29.2) 16.5 (5.0–33.2) .86 25.9 (20.8–57.7) 21.8 (10.1–35.9) .10 Fibrous plaque component (mm³) 81.0 (51.1–116.2) 80.2 (36.5–119.9) .67 45.1 (27.3–91.4) 31.3 (16.6–43.8) .07 Calcified plaque component (mm³) 16.3 (9.2–40.9) 26.3 (5.3–97.4) .44 9.6 (4.9–13.8) 8.5 (3.3–15.0) .76
CAD, coronary artery disease; cCTA, coronary computed tomography angiography; NSTEMI, non–ST elevation myocardial infarction; VH-IVUS, virtual histology intravascular ultrasound.
For intermodality correlation of fatty component, VH-IVUS necrotic core and VH-IVUS fatty-fibrous tissue are summed. Noncalcified plaque component = fatty component plus fibrous component. Values are expressed as median (25th to 75th percentile) or mean ± standard deviation. Differences between the patient groups are expressed by P value on the basis of Wilcoxon rank sum test for non-normally distributed data or Student t test for normally distributed data.
Get Radiology Tree app to read full this article<
Get Radiology Tree app to read full this article<
Get Radiology Tree app to read full this article<
Table 4
Intermodality Correlation of Quantitative Plaque Analysis Assessed with cCTA and VH-IVUS
cCTA VH-IVUS Correlation Bias Overall plaque burden (mm³) 141.5 (91.9–220.5) 113.7 (73.2–192.4) 0.11; P = .49 13.8; −26.2 to 53.8; P = .31 Area stenosis (%) 67.0 ± 10.5 72.7 ± 9.2 0.63; P < .0001 ∗ −5.7; −8.4 to −3.0; P = .0001 ∗ Fibrous plaque component (mm³) 80.2 (48.0–117.5) 36.0 (21.2–65.2) 0.20; P = .21 33.9; 8.9 to 58.9; P = .004 ∗ Fatty plaque component (mm³) 17.5 (7.5–30.6) 25.1 (19.4–46.5) 0.12; P = .45 −14.6; −24.5 to −4.8; P = .008 ∗ Noncalcified plaque component (mm³) 98.0 (59.2–148.3) 66.1 (39.7–103.9) 0.23; P = .16 19.2; −13.0 to 51.5; P = .08 Calcified plaque component (mm³) 17.7 (8.5–59.0) 9.4 (4.5–14.5) 0.18; P = .27 29.5; 13.6 to 45.4; P < .0001 ∗ Fibrous plaque component (%) 62.5 (39.2–73.8) 43.8 (49.7–60.3) 0.38; P = .02 ∗ 7.0; 13.0 to 1.1; P = .06 Fatty plaque component (%) 13.4 (7.6–29.1) 35.6 (33.6–38.5) −0.35; P = .03 ∗ −18.8; −23.0 to −14.5; P < .0001 ∗ Noncalcified plaque component (%) 79.1 (61.9–93.6) 87.4 (83.5–94.2) 0.39; P = .01 ∗ −11.7; −18.1 to −5.3; P = .0008 ∗ Calcified plaque component (%) 20.9 (6.4–38.1) 12.6 (5.8–16.5) 0.39; P = .01 ∗ 11.7; 5.3 to 18.1; P = .0008 ∗
CAD, coronary artery disease; VH-IVUS, virtual histology intravascular ultrasound.
For intermodality correlation of fatty component, VH-IVUS necrotic core and VH-IVUS fatty-fibrous tissue are summed. Noncalcified plaque component = fatty component plus fibrous component. Values are expressed as median (25th to 75th percentile) or mean ± standard deviation. Correlation between cCTA and VH-IVUS measurements is expressed by Spearman’s rho or by Pearson correlation coefficient r according to the normal or non-normal distribution of the data and P value. Bland–Altman bias analysis to determine possible systematic differences between VH-IVUS and cCTA measurements is expressed by mean difference, confidence interval values, and P value.
Get Radiology Tree app to read full this article<
Get Radiology Tree app to read full this article<
Get Radiology Tree app to read full this article<
Get Radiology Tree app to read full this article<
Discussion
Get Radiology Tree app to read full this article<
Get Radiology Tree app to read full this article<
Get Radiology Tree app to read full this article<
Get Radiology Tree app to read full this article<
Get Radiology Tree app to read full this article<
Get Radiology Tree app to read full this article<
Get Radiology Tree app to read full this article<
Get Radiology Tree app to read full this article<
Get Radiology Tree app to read full this article<
Get Radiology Tree app to read full this article<
Get Radiology Tree app to read full this article<
Get Radiology Tree app to read full this article<
Get Radiology Tree app to read full this article<
Conclusion
Get Radiology Tree app to read full this article<
Appendix
Supplementary material
Get Radiology Tree app to read full this article<
Supplementary Information
Get Radiology Tree app to read full this article<
Get Radiology Tree app to read full this article<
References
1. Taylor A.J., Cerqueira M., Hodgson J.M., et. al.: ACCF/SCCT/ACR/AHA/ASE/ASNC/NASCI/SCAI/SCMR 2010 Appropriate Use Criteria for Cardiac Computed Tomography. A report of the American College of Cardiology Foundation Appropriate Use Criteria Task Force, the Society of Cardiovascular Computed Tomography, the American College of Radiology, the American Heart Association, the American Society of Echocardiography, the American Society of Nuclear Cardiology, the North American Society for Cardiovascular Imaging, the Society for Cardiovascular Angiography and Interventions, and the Society for Cardiovascular Magnetic Resonance. Circulation 2010; 122: pp. e525-e555.
2. Kolodgie F.D., Virmani R., Burke A.P., et. al.: Pathologic assessment of the vulnerable human coronary plaque. Heart 2004; 90: pp. 1385-1391.
3. Konig A., Klauss V.: Virtual histology. Heart 2007; 93: pp. 977-982.
4. Nasu K., Tsuchikane E., Katoh O., et. al.: Accuracy of in vivo coronary plaque morphology assessment: a validation study of in vivo virtual histology compared with in vitro histopathology. J Am Coll Cardiol 2006; 47: pp. 2405-2412.
5. Voros S., Rinehart S., Qian Z., et. al.: Coronary atherosclerosis imaging by coronary CT angiography: current status, correlation with intravascular interrogation and meta-analysis. JACC Cardiovasc Imaging 2011; 4: pp. 537-548.
6. Leber A.W., Becker A., Knez A., et. al.: Accuracy of 64-slice computed tomography to classify and quantify plaque volumes in the proximal coronary system: a comparative study using intravascular ultrasound. J Am Coll Cardiol 2006; 47: pp. 672-677.
7. Schepis T., Marwan M., Pflederer T., et. al.: Quantification of noncalcified coronary atherosclerotic plaques with dual-source computed tomography: comparison with intravascular ultrasound. Heart 2010; 96: pp. 610-615.
8. Ugolini P., Pressacco J., Lesperance J., et. al.: Evaluation of coronary atheroma by 64-slice multidetector computed tomography: comparison with intravascular ultrasound and angiography. Can J Cardiol 2009; 25: pp. 641-647.
9. Brodoefel H., Burgstahler C., Heuschmid M., et. al.: Accuracy of dual-source CT in the characterisation of noncalcified plaque: use of a colour-coded analysis compared with virtual histology intravascular ultrasound. Br J Radiol 2009; 82: pp. 805-812.
10. Schuijf J.D., Beck T., Burgstahler C., et. al.: Differences in plaque composition and distribution in stable coronary artery disease versus acute coronary syndromes; noninvasive evaluation with multi-slice computed tomography. Acute Card Care 2007; 9: pp. 48-53.
11. Pundziute G., Schuijf J.D., Jukema J.W., et. al.: Evaluation of plaque characteristics in acute coronary syndromes: noninvasive assessment with multi-slice computed tomography and invasive evaluation with intravascular ultrasound radiofrequency data analysis. Eur Heart J 2008; 29: pp. 2373-2381.
12. Li X.M., Huang C.X., Wang T.S., et. al.: Comparison of coronary plaque composition among patients with acute coronary syndrome and stable coronary artery disease. Chin Med J (Engl) 2008; 121: pp. 534-539.
13. Pflederer T., Marwan M., Schepis T., et. al.: Characterization of culprit lesions in acute coronary syndromes using coronary dual-source CT angiography. Atherosclerosis 2010; 211: pp. 437-444.
14. Wright R.S., Anderson J.L., Adams C.D., et. al.: 2011 ACCF/AHA focused update of the Guidelines for the Management of Patients with Unstable Angina/Non-ST-Elevation Myocardial Infarction (updating the 2007 guideline): a report of the American College of Cardiology Foundation/American Heart Association Task Force on Practice Guidelines developed in collaboration with the American College of Emergency Physicians, Society for Cardiovascular Angiography and Interventions, and Society of Thoracic Surgeons. J Am Coll Cardiol 2011; 57: pp. 1920-1959.
15. Brodoefel H., Reimann A., Heuschmid M., et. al.: Characterization of coronary atherosclerosis by dual-source computed tomography and HU-based color mapping: a pilot study. Eur Radiol 2008; 18: pp. 2466-2474.
16. Von Birgelen C., De Feyter P.J., De Vrey E.A., et. al.: Simpson’s rule for the volumetric ultrasound assessment of atherosclerotic coronary arteries: a study with ECG-gated three-dimensional intravascular ultrasound. Coron Artery Dis 1997; 8: pp. 363-369.
17. Stone G.W., Maehara A., Lansky A.J., et. al.: A prospective natural-history study of coronary atherosclerosis. N Engl J Med 2011; 3: pp. 226-235.
18. Pflederer T., Marwan M., Schepis T., et. al.: Characterization of culprit lesions in acute coronary syndromes using coronary dual-source ct angiography. Atherosclerosis 2010; 2: pp. 437-444.
19. Hoffmann U., Moselewski F., Nieman K., et. al.: Noninvasive assessment of plaque morphology and composition in culprit and stable lesions in acute coronary syndrome and stable lesions in stable angina by multidetector computed tomography. J Am Coll Cardiol 2006; 47: pp. 1655-1662.
20. Kunimasa T., Sato Y., Sugi K., et. al.: Evaluation by multislice computed tomography of atherosclerotic coronary artery plaques in nonculprit, remote coronary arteries of patients with acute coronary syndrome. Circ J 2005; 69: pp. 1346-1351.
21. Yla-Herttuala S., Bentzon J.F., Daemen M., et. al.: Stabilisation of atherosclerotic plaques. Position paper of the European Society of Cardiology (ESC) Working Group on atherosclerosis and vascular biology. Thromb Haemost 2011; 106: pp. 1-19.
22. Nasu K., Tsuchikane E., Katoh O., et. al.: Impact of intramural thrombus in coronary arteries on the accuracy of tissue characterization by in vivo intravascular ultrasound radiofrequency data analysis. Am J Cardiol 2008; 101: pp. 1079-1083.
23. Papadopoulou S.L., Neefjes L.A., Schaap M., et. al.: Detection and quantification of coronary atherosclerotic plaque by 64-slice multidetector CT: a systematic head-to-head comparison with intravascular ultrasound. Atherosclerosis 2011; 219: pp. 163-170.
24. Feuchtner G., Loureiro R., Bezerra H., et. al.: Quantification of coronary stenosis by dual source computed tomography in patients: A comparative study with intravascular ultrasound and invasive angiography. Eur J Radiol 2012; 81: pp. 83-88.
25. Choi B.J., Kang D.K., Tahk S.J., et. al.: Comparison of 64-slice multidetector computed tomography with spectral analysis of intravascular ultrasound backscatter signals for characterizations of noncalcified coronary arterial plaques. Am J Cardiol 2008; 102: pp. 988-993.
26. Achenbach S., Boehmer K., Pflederer T., et. al.: Influence of slice thickness and reconstruction kernel on the computed tomographic attenuation of coronary atherosclerotic plaque. J Cardiovasc Comput Tomogr 2010; 4: pp. 110-115.
27. Marwan M., Pflederer T., Schepis T., et. al.: Coronary vessel and luminal area measurement using dual-source computed tomography in comparison with intravascular ultrasound: effect of window settings on measurement accuracy. J Comput Assist Tomogr 2011; 35: pp. 113-118.
28. Renker M., Nance J.W., Schoepf U.J., et. al.: Evaluation of heavily calcified vessels with coronary CT angiography: comparison of iterative and filtered back projection image reconstruction. Radiology 2011; 260: pp. 390-399.
29. Van Velzen J.E., Schuijf J.D., De Graaf F.R., et. al.: Plaque type and composition as evaluated noninvasively by MSCT angiography and invasively by VH IVUS in relation to the degree of stenosis. Heart 2009; 95: pp. 1990-1996.
30. Voros S., Rinehart S., Qian Z., et. al.: Prospective validation of standardized, 3-dimensional, quantitative coronary computed tomographic plaque measurements using radiofrequency backscatter intravascular ultrasound as reference standard in intermediate coronary arterial lesions: results from the ATLANTA (assessment of tissue characteristics, lesion morphology, and hemodynamics by angiography with fractional flow reserve, intravascular ultrasound and virtual histology, and noninvasive computed tomography in atherosclerotic plaques) I study. JACC Cardiovasc Interv 2011; 4: pp. 198-208.
31. Lee M.S., Chun E.J., Kim K.J., et. al.: Reproducibility in the assessment of noncalcified coronary plaque with 256-slice multi-detector CT and automated plaque analysis software. Int J Cardiovasc Imaging 2010; 26: pp. 237-244.
32. Blackmon K.N., Streck J., Thilo C., et. al.: Reproducibility of automated noncalcified coronary artery plaque burden assessment at coronary CT angiography. J Thorac Imaging 2009; 24: pp. 96-102.
33. Austen W.G., Edwards J.E., Frye R.L., et. al.: A reporting system on patients evaluated for coronary artery disease. Report of the ad hoc committee for grading of coronary artery disease, council on cardiovascular surgery, american heart association. Circulation 1975; 4: pp. 5-40.