
Rationale and Objectives
In this article, we propose an alternative approach to voxel-by-voxel analysis, which overcomes problems associated with heuristic methods currently used for dynamic contrast-enhanced MRI (DCE-MRI) data assessment. We aim to allow fully automated extraction of various heuristic parameters via robust preprocessing methods and a new technique for classification of temporal patterns of contrast agent uptake, making full use of all available dynamic frames of the datasets. We also demonstrate that application of efficient preprocessing methods permits more accurate analysis of the dynamic data.
Material and Methods
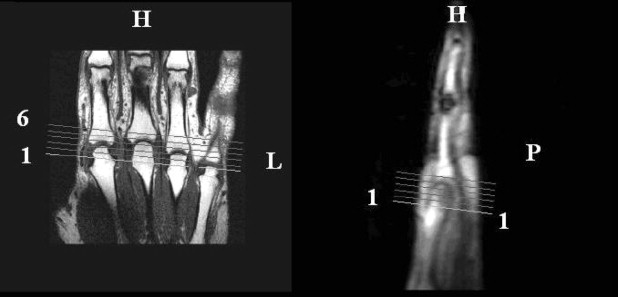
Ten DCE-MRI datasets enhanced by gadolinium diethylene triamine pentacetic acid were acquired from patients with rheumatoid arthritis using a 1.5-T MRI scanner. Fully automated voxel-by-voxel analysis of DCE-MRI signal intensity curves from 60 temporal slices was performed using a new method. Qualitative evaluation of the degree of inflammation was done via constructing parametric maps and quantitative by computing various heuristics such as maximum rate of enhancement, initial rate of enhancement, and time of onset of enhancement.
Results
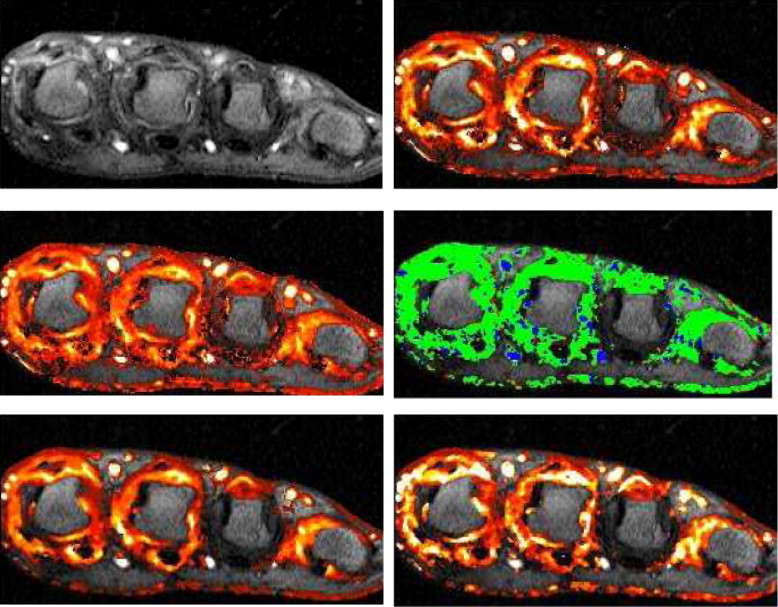
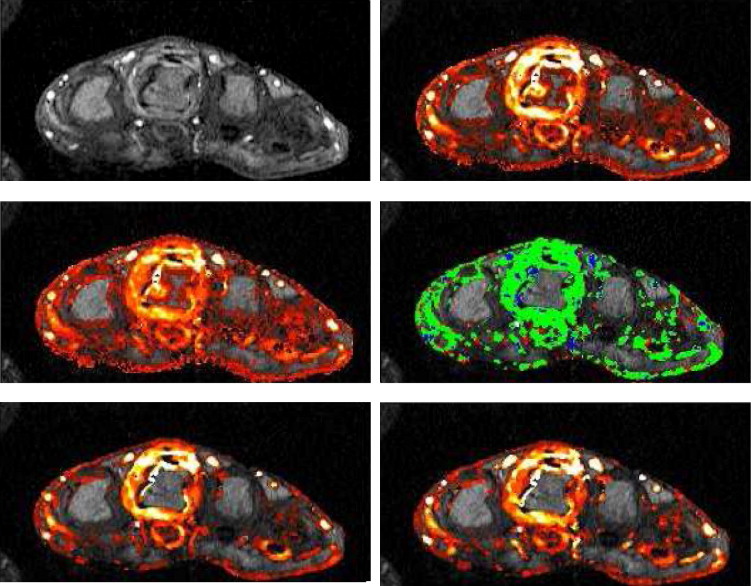
Quantitative and qualitative evaluation obtained for 10 DCE-MRI datasets is presented. We demonstrate that preprocessing techniques compensate for patient movement, contribute to data fidelity and therefore permit more robust estimation of various heuristics such as maximum rate of enhancement, initial rate of enhancement, and time of onset of enhancement. Automatically generated parametric maps of these heuristics show favorable characteristics, permitting easier differentiation of structures of interest. These results are free from the subjective input and therefore easily reproducible. Furthermore, the proposed classification scheme provides information on the pattern of contrast uptake previously unavailable.
Conclusion
Our preliminary results demonstrate the potential of the proposed method for providing objective quantitative and qualitative assessment of DCE-MRI in the metacarpophalangeal joints. Further evaluation within a clinical setting is needed to examine the method’s diagnostic utility.
Dynamic contrast-enhanced MR imaging (DCE-MRI) has evolved as an important method for evaluating various diseases of the musculoskeletal system ( ). Temporal changes of signal intensity during and immediately after bolus injection of contrast agent reflect underlying changes in local concentration of the agent. Therefore this technique provides information about tissue vascularity, perfusion, and capillary permeability ( ).
Advances in MRI acquisition have led to increasing use of parametric images designed to display physiological features of tissues in addition to anatomical structure. DCE-MRI is used extensively in a wide range of applications involving different organs and pathologies ( ).
Get Radiology Tree app to read full this article<
Get Radiology Tree app to read full this article<
Get Radiology Tree app to read full this article<
Get Radiology Tree app to read full this article<
Get Radiology Tree app to read full this article<
Get Radiology Tree app to read full this article<
Get Radiology Tree app to read full this article<
Materials and methods
Data Acquisition
Get Radiology Tree app to read full this article<
Get Radiology Tree app to read full this article<
Get Radiology Tree app to read full this article<
Get Radiology Tree app to read full this article<
Get Radiology Tree app to read full this article<
Get Radiology Tree app to read full this article<
Get Radiology Tree app to read full this article<
Moving-Window–Based Method
Get Radiology Tree app to read full this article<
b=Σt=13I(t)3,Iˆ(t)=I(t)b,t=1…20 b
=
Σ
t
=
1
3
I
(
t
)
3
,
I
(
t
)
=
I
(
t
)
b
,
t
=
1
…
20
Get Radiology Tree app to read full this article<
Get Radiology Tree app to read full this article<
Get Radiology Tree app to read full this article<
Get Radiology Tree app to read full this article<
Get Radiology Tree app to read full this article<
New Method for DCE-MRI Data Analysis
Get Radiology Tree app to read full this article<
Registration
Get Radiology Tree app to read full this article<
Get Radiology Tree app to read full this article<
Get Radiology Tree app to read full this article<
Get Radiology Tree app to read full this article<
Get Radiology Tree app to read full this article<
Get Radiology Tree app to read full this article<
Segmentation
Get Radiology Tree app to read full this article<
Get Radiology Tree app to read full this article<
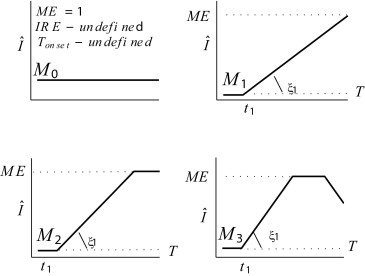
Classification of Tissue Behavior
Get Radiology Tree app to read full this article<
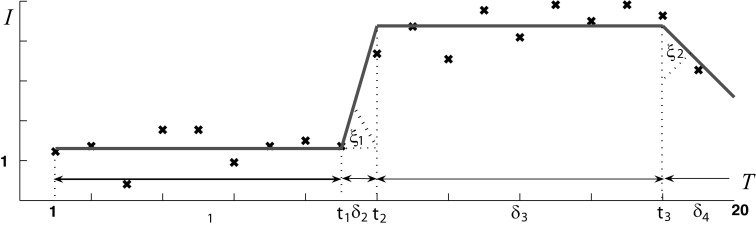
δ1>0,δ2>0,δ3≥0,δ4≥0,ξ1∈(0,π/2),ξ2∈(−π/2,π/2) δ
1
0
,
δ
2
0
,
δ
3
≥
0
,
δ
4
≥
0
,
ξ
1
∈
(
0
,
π
/
2
)
,
ξ
2
∈
(
−
π
/
2
,
π
/
2
)
Get Radiology Tree app to read full this article<
Get Radiology Tree app to read full this article<
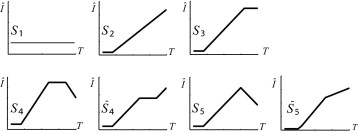
S̄ 4 is not normally observed: here, while a change in the rate of increase is plausible, a significant plateau during increase is not. Experiments reveal that any observation of this model has a very short plateau (≤3 time instants) equally well attributed to noise. We henceforward assume that all SI curves can be modeled by one of the shapes proposed in Figure 4 excluding this case.
Get Radiology Tree app to read full this article<
Get Radiology Tree app to read full this article<
Noise Model Estimation
Get Radiology Tree app to read full this article<
Get Radiology Tree app to read full this article<
Determining Best Model Fit
Get Radiology Tree app to read full this article<
Get Radiology Tree app to read full this article<
Get Radiology Tree app to read full this article<
Get Radiology Tree app to read full this article<
Median Filtering
Get Radiology Tree app to read full this article<
Get Radiology Tree app to read full this article<
Get Radiology Tree app to read full this article<
Get Radiology Tree app to read full this article<
Get Radiology Tree app to read full this article<
Computing BB Parameters
Get Radiology Tree app to read full this article<
Get Radiology Tree app to read full this article<
Discussion
The Noise Model
Get Radiology Tree app to read full this article<
Table 1
Relative Label Populations Using Different Noise Models
Model N 1 Noise N 2 Noise N 1 ∪ N 2 M 0 1194 (12%) 1152 (12%) 1166 (13%)M 1 51 (2%) 42 (1%) 48 (1%)M 2 5588 (60%) 5584 (60%) 5583 (59%)M 3 2459 (26%) 2514 (27%) 2495 (27%)
Images given in Kubassova et al. ( ).
Get Radiology Tree app to read full this article<
Get Radiology Tree app to read full this article<
T onset
Get Radiology Tree app to read full this article<
Get Radiology Tree app to read full this article<
N total
Get Radiology Tree app to read full this article<
Get Radiology Tree app to read full this article<
Table 2
Proportion of Enhancing Voxels: Moving Window (MW) and New Approaches
Study New MW 1 0.58 (22%) 0.68 2 0.59 (6%) 0.63 3 0.42 (10%) 0.51 4 0.39 (13%) 0.57 5 0.39 (2%) 0.57 6 0.54 (7%) 0.68 7 0.64 (7%) 0.65 8 0.34 (7%) 0.44 8 0.46 (7%) 0.58 9 0.59 (7%) 0.67 10 0.39 (7%) 0.48
Second column includes the percentage of voxels corresponding to locations where we observe incomplete Gd-DTPA absorption (model M 1 ).
Get Radiology Tree app to read full this article<
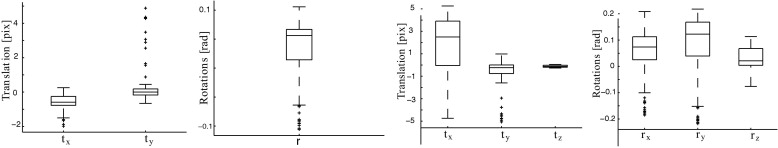
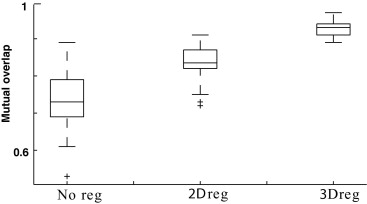
Two- Versus Three-dimensional Registration
Get Radiology Tree app to read full this article<
Get Radiology Tree app to read full this article<
Get Radiology Tree app to read full this article<
Get Radiology Tree app to read full this article<
Get Radiology Tree app to read full this article<
Get Radiology Tree app to read full this article<
Get Radiology Tree app to read full this article<
Results
Parametric Maps
Get Radiology Tree app to read full this article<
Get Radiology Tree app to read full this article<
Get Radiology Tree app to read full this article<
Get Radiology Tree app to read full this article<
Get Radiology Tree app to read full this article<
Get Radiology Tree app to read full this article<
Codings of Gd-DTPA Take-up
Get Radiology Tree app to read full this article<
Conclusion
Get Radiology Tree app to read full this article<
Get Radiology Tree app to read full this article<
Get Radiology Tree app to read full this article<
Get Radiology Tree app to read full this article<
Get Radiology Tree app to read full this article<
Get Radiology Tree app to read full this article<
Get Radiology Tree app to read full this article<
Get Radiology Tree app to read full this article<
Get Radiology Tree app to read full this article<
Get Radiology Tree app to read full this article<
Get Radiology Tree app to read full this article<
Get Radiology Tree app to read full this article<
Acknowledgments
Get Radiology Tree app to read full this article<
Get Radiology Tree app to read full this article<
References
1. Brown J., Buckley D., Coulthard A., et. al.: Magnetic resonance imaging screening in women at genetic risk of breast cancer: Imaging and analysis protocol for the UK multicentre study. Magn Reson Imaging 2000; 7: pp. 765-776.
2. Warner E., Plewes D.B., Hill K.A., et. al.: Surveillance of BRCA1 and BRCA2 mutation carriers with magnetic resonance imaging, ultrasound, mammography, and clinical breast examination. JAMA 2004; 292: pp. 1317-1325.
3. Verstraete K.L., Deene Y.D., Roels H., Dierick A., Uyttendaele D., Kunnen M.: Benign and malignant musculoskeletal lesions: Dynamic contrast-enhanced MR imaging-parametric ‘first-pass’ images depict tissue vascularization and perfusion. Radiology 1994; 192: pp. 835-843.
4. Jackson A.: Analysis of dynamic contrast enhanced MRI. Radiology 2004; 77: pp. 154-166.
5. Padhani A.R.: Dynamic contrast-enhanced MRI in clinical oncology: Current status and future directions. Magn Reson Imaging 2002; 16: pp. 407-422.
6. Reddick W.E., Taylor J.S., Fletcher B.D.: Dynamic MR imaging (DEMRI) of microcirculation in bone sarcoma. Magn Reson Imaging 1999; 10: pp. 277-285.
7. Reece R.J., Kraan M.C., Radjenovic A., et. al.: Dynamic gadolinium enhanced MR monitoring of inflammatory changes in rheumatoid arthritis with the new DMARD leflunomide versus methotrexate. Presented at the 63rd Annual Scientific Meeting of the ACR (Arthritis and Rheumatism) 1999; 42: pp. 364-365.
8. van Laarhoven H.W.M., Rijpkema M., Punt C.J.A., et. al.: Method for quantitation of dynamic MRI contrast agent uptake in colorectal liver metastases. Magn Reson Imaging 2006; 18: pp. 315-320.
9. Tofts P.S., Kermode A.G.: Measurement of the blood-brain barrier permeability and leakage space using DEMRI. Magn Reson Med 1991; 17: pp. 357-367.
10. Brix G., Semmler W., Port R., Schad L.R., Layer G., Lorenz W.J.: Pharmacokinetic parameters in CNS Gd-DTPA enhanced MR imaging. Comput Assist Tomogr 1991; 15: pp. 621-628.
11. Larsson H.B., Stubgaard M., Frederiksen J.L., Jensen M., Henriksen O., Paulson O.B.: Quantitation of blood-brain barrier defect by magnetic resonance imaging and gadolinium-DTPA in patients with multiple sclerosis and brain tumors. Magn Reson Med 1990; 16: pp. 117-131.
12. d’Arcy J.A., Collins D.J., Rowland I.J., Padhani A.R., Leach M.O.: Applications of sliding window reconstruction with Cartesian sampling for dynamic contrast enhanced MRI. NMR Biomed 2002; 15: pp. 174-183.
13. Heywang S.H., Wolf A., Pruss E., Hilbertz T., Eiermann W., Permanetter W.: Imaging of the breast with Gd-DTPA: Use and limitations. Radiology 1989; 171: pp. 95-103.
14. Kaiser W.A., Zeitler E.: Imaging of the breast: Fast imaging sequences with and without Gd-DTPA. Radiology 1989; 170: pp. 681-686.
15. Kuhl C.K., Mielcareck P., Klaschik S., et. al.: Dynamic breast MR imaging: Are signal intensity time course data useful for differential diagnosis of enhancing lesions?. Radiology 1999; 211: pp. 101-110.
16. Radjenovic A.: Measurement of physiological variables by dynamic Gd-DTPA enhanced MRI.2003.School of MedicineUniversity of Leeds
17. Tofts P.S., Brix G., Buckley D.L., Evelhoch J.L., Henderson E., Knopp M.V., Larsson H.B., Lee T.Y., Mayr N.A., Parker G.J., Port R.E., Taylor J., Weisskoff R.M.: Estimating kinetic parameters from dynamic contrast-enhanced T-weighted MRI of a diffusable tracer: Standardized quantities and symbols. Magn Reson Imaging 1999; 10: pp. 223-232.
18. Radjenovic A., Ridgway J.P., Smith M.A.: A method for pharmacokinetic modelling of dynamic contrast enhanced MRI studies of rapidly enhancing lesions acquired in a clinical setting. Phys Med Biol 2006; 51: pp. 187-197.
19. Cimmino M.A., Innocenti S., Livrone F., Magnaguagno F., Silvesti E., Garlaschi G.: Dynamic gadolinium-enhanced MRI of the wrist in patients with rheumatoid arthritis. Arthritis Rheum 2003; 48: pp. 674-680.
20. McQueen F.: Comments on the article by Cimmino et al: Dynamic gadolinium-enhanced MRI of the wrist in patients with rheumatoid arthritis. Arthritis Rheum 2004; 50: pp. 674-680.
21. Robb A., Hanson D.P., Karwoski R.A., Larson A.G., Workman E.L., Stacy M.C.: Analyze: A comprehensive, operator-interactive software package for multidimensional medical image display and analysis. Comput Med Imaging Graphics 1989; 6: pp. 433-454.
22. Buonaccorsi G., Roberts C., Cheung S.W., et. al.: Comparison of the performance of tracer kinetic model-driven registration for dynamic contrast enhanced MRI (DCE-MRI) using different models of contrast enhancement. Acad Radiol 2006; 13: pp. 1112-1123.
23. Zou C., Jiang A., Buff B.L., Mahon T.G., Wong T.Z.: Automatic motion correction for breasts MR imaging. Radiology 1996; 3: pp. 903-906.
24. Kumar R., Hanna K., Asmuth J.C., et. al.: In DJ Gerson, editor. SPIE 24th AIPR Workshop on Tools and Techniques for Modeling and Simulation 1996; pp. 181-190.
25. Crum W.R., Tanner C., Hawkes D.J.: Anisotropic multi-scale fluid registration: evaluation in magnetic resonance breast imaging. Phys Med Biol 2005; 50: pp. 5153-5174.
26. Froh M.S., Barber D.C., Brock K.K., Plewes D.B., Martel A.L.: Piecewise-quadrilateral registration by optical flow: Applications in contrast-enhanced MR imaging of the breast. Proc. of International Conference on Medical Image Computing and Computer Assisted Intervention 2006; 1: pp. 686-693.
27. Rohlfing T., Maurer C.R.: Shape-based averaging for combination of multiple segmentations. Proc. of International Conference on Medical Image Computing and Computer Assisted Intervention 2005; 2: pp. 838-848.
28. Friston K. Statistical parametric mapping. Available at http://www.fil.ion.ucl.ac.uk/spm/ . Accessed March 5, 2007.
29. Periaswamy S., Farid H.: Medical image registration with partial data. Med Image Analysis 2006; 10: pp. 452-464.
30. Negahdaripour S., Yu C.H.: A generalized brightness change model for computing optical flow. Int Conf Comput Vision 1993; 2: pp. 2-11.
31. Poggio T., Torre V., Koch C.: Computational vision and regularization theory. Nature 1985; 317: pp. 314-319.
32. Bertero M., Poggio T.A., Torre V.: Ill-posed problems in early vision. Proc IEEE 1988; 8: pp. 869-889.
33. Nestares O., Heeger D.J.: Robust multiresolution alignment of MRI brain volumes. Magn Reson Med 2000; 43: pp. 705-715.
34. Periaswamy S.: General-purpose medical image registration.2003.Department of Computer Science, Dartmouth CollegeHanover, NH, USA
35. Kubassova O., Boyle R.D., Pyatnizkiy M.: Bone segmentation in metacarpophalangeal MR data. Third International Conference on Advances in Pattern Recognition, Bath, UK 2005; 2: pp. 726-735.
36. Kubassova O., Boyle R.D.: Segmentation of 4D natural MR images based upon morphological image analysis and image geometry. EPSRC Conference on Postgraduate Research in Electronics, Photonics, Communications and Software (PREP’05), Lancaster, UK 2005; 1: pp. 186-188.
37. Massey F.J.: The Kolmogorov-Smirnov test for goodness of fit. Am Stat Assoc 1956; 46: pp. 68-77.
38. Kubassova O, Boyle RD, Radjenovic A. Statistical analysis of DEMRI data of MCP joint. Technical Report 2006.3, University of Leeds, 2006.
39. Kubassova O., Boyle R.D., Radjenovic A.: Improved parameter extraction from dynamic contrast-enhanced MRI data in RA studies. In Joint Disease Workshop, Medical Image Computing and Computer-Assisted Intervention 2006; 1: pp. 64-71.
40. Østergaard M., Peterfy C., Conaghan P., et. al.: rheumatoid arthritis magnetic resonance imaging studies. Rheumatology 2003; 30: pp. 1385-1386.