
Rationale and Objectives
The aim of this study was to evaluate the feasibility of quantitative analysis of dynamic contrast-enhanced magnetic resonance imaging (DCE-MRI) data in the detection of bowel inflammation in patients with Crohn’s disease.
Materials and Methods
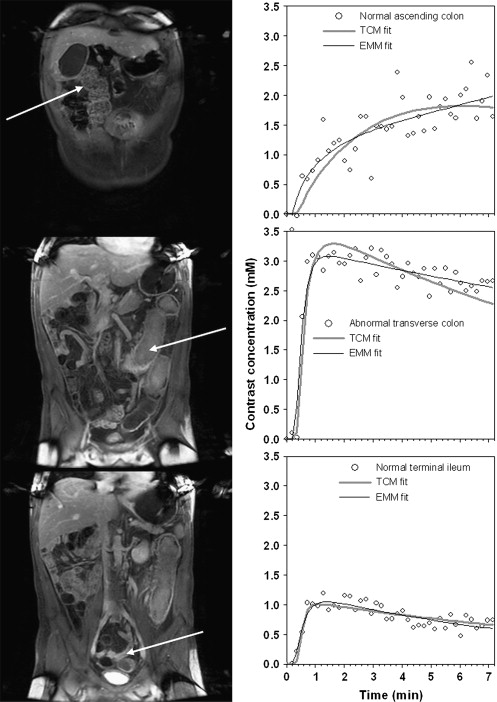
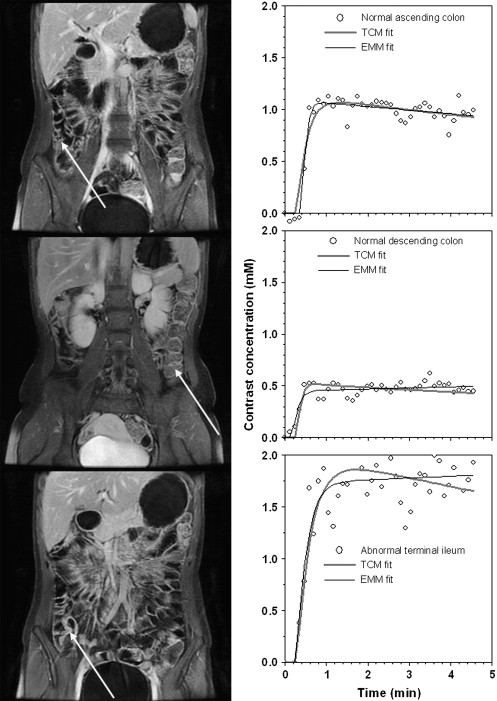
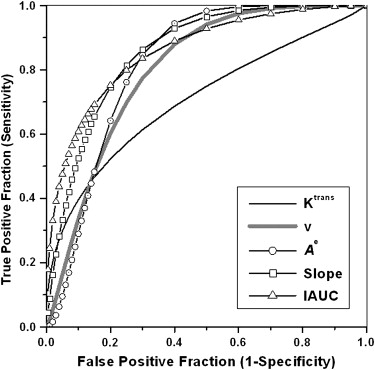
Eleven patients who underwent magnetic resonance enterography for known or suspected Crohn’s disease and had colonoscopy or surgery within 4 weeks of imaging were included in this study. DCE-MRI data were acquired using a 1.5-T scanner with temporal resolution of 5 to 12 seconds for approximately 5 to 7 minutes. A two-compartment pharmacokinetic model was used to analyze the data to obtain the volume transfer constant ( K trans ) and the extravascular extracellular space ( v e ). Additionally, semiquantitative parameters were derived using an empirical mathematical model to fit the contrast concentration curves. Endoscopic, surgical, and pathologic results were compared to the MRI data. Receiver-operating characteristic analysis was performed to compare the diagnostic accuracy of the parameters in the task of distinguishing normal tissue from inflammation.
Results
A total of 51 bowel segments (19 with inflammation, 32 normal) were included in the analyses. Inflamed bowel segments had faster K trans values, larger v e values, increased contrast uptake, larger initial areas under the contrast concentration curve, and steeper initial enhancement slopes than normal bowel segments ( P < .05). The areas under the receiver-operating characteristic curve for these parameters ranged from 0.70 to 0.86.
Conclusion
These preliminary results demonstrate that the quantitative analysis of DCE-MRI data is possible for the assessment of bowel inflammation in patients with Crohn’s disease. Future studies need be performed on larger numbers of patients to correlate the severity and type of inflammation with kinetic parameters.
Crohn’s disease is a chronic inflammatory disease of unknown origin affecting the entire gastrointestinal tract, with a remitting and relapsing course. Cross-sectional imaging techniques are commonly used during the course of the disease for the determination of its extent and severity, detection of complications, and planning of therapy . Traditionally, computed tomography has been the predominant cross-sectional imaging technique in patients with Crohn’s disease because of its proven efficacy in the evaluation of intestinal diseases and extraintestinal complications . Recently, magnetic resonance (MR) imaging (MRI) has emerged as a valuable tool in the detection of bowel abnormalities and evaluation of disease activity in Crohn’s disease .
MRI has several advantages compared to computed tomography, including a lack of ionizing radiation, superior contrast resolution of soft tissue, and the ability to perform real-time and functional imaging. In addition to fast T2-weighted sequences, dynamic contrast-enhanced (DCE) T1-weighted gradient-echo sequences are also routinely performed to evaluate bowel inflammation . MRI strongly correlates with conventional enteroclysis in the detection of individual lesions of small intestinal Crohn’s disease and provides additional information from the mesenteries . Gadolinium enhancement of inflamed bowel wall segments in Crohn’s disease has been described as a sensitive measurement for the detection of inflammation . Several studies have also suggested a correlation between clinical disease activity and the enhancement level of the bowel wall . In these studies, the enhancement pattern of the bowel has been assessed either qualitatively or semiquantitatively . To our knowledge, a pharmacokinetic model to quantitatively analyze DCE-MRI data has not previously been applied to bowel inflammation. In other organs, the quantitative analysis of DCE-MRI data is a widely accepted reliable technique for monitoring the effects of antiangiogenic cancer drugs and allows for a more robust and reproducible analysis of tissue enhancement . This noninvasive method can be potentially applied to the gastrointestinal tract to provide quantification of bowel wall perfusion and permeability, which can be used to localize inflamed bowel segments, monitor disease activity, and evaluate the response to treatment without exposing patients to ionizing radiation. A variety of research and clinical scoring tools have been used to address these issues, such as the Crohn’s disease activity index, biologic indices, and endoscopic and imaging studies. However, there remains no established reference standard that accurately provides all this information.
Get Radiology Tree app to read full this article<
Materials and methods
Patients
Get Radiology Tree app to read full this article<
Get Radiology Tree app to read full this article<
MRI Protocol
Get Radiology Tree app to read full this article<
Quantitative Pharmacokinetic Model Analysis of DCE-MRI Data
Get Radiology Tree app to read full this article<
dC(t)dt=Ktrans×[Cp(t)−C(t)/ve], d
C
(
t
)
d
t
=
K
trans
×
[
C
p
(
t
)
−
C
(
t
)
/
v
e
]
,
where K trans (min −1 ) is the volume transfer constant between intravascular extracellular space and EES, v e is the volume of EES per unit volume of tissue, and C p ( t ) is the arterial input function. The contrast concentration curves as function of time were converted from the signal intensity curves for each region of interest (ROI) using an approximation formula published previously, with muscle as a reference tissue and longitudinal relaxivity of r 1 = 4.5 mmol/L −1 · s −1 for gadolinium diethylenetriamine penta-acetic acid at 1.5 T . Subsequently, the arterial input function was obtained from the ROI of aortic contrast concentration, C a ( t ), for each patient using C p ( t ) = C a ( t )/(1 − hematocrit), with hematocrit = 0.45, to correct for hematocrit.
Get Radiology Tree app to read full this article<
Model Free Empirical Mathematical Analysis
Get Radiology Tree app to read full this article<
C(t)=A×(1−e−αt)q×e−βt, C
(
t
)
=
A
×
(
1
−
e
−
α
t
)
q
×
e
−
β
t
,
where A is the upper limit of the tracer concentration, α is the rate of contrast uptake (min −1 ), β is the rate of contrast washout (min −1 ) (with β > 0 indicating that the curve exhibits washout rather than plateau or persistent contrast uptake), and q is related to the slope of early uptake. Prior studies have shown that the EMM provides an accurate fit to DCE-MRI kinetic data acquired from breast lesions .
Get Radiology Tree app to read full this article<
Semiquantitative Analysis Parameters
Get Radiology Tree app to read full this article<
IAUC
Get Radiology Tree app to read full this article<
IAUC=∫0τA×(1−e−αt)q×e−βtdt. IAUC
=
∫
0
τ
A
×
(
1
−
e
−
α
t
)
q
×
e
−
β
t
d
t
.
A value of τ = 1 minute was selected for this study.
Slopeini S
l
o
p
e
i
n
i
Get Radiology Tree app to read full this article<
Get Radiology Tree app to read full this article<
slopeini=A×(1−e−α)q×e−β. s
l
o
p
e
i
n
i
=
A
×
(
1
−
e
−
α
)
q
×
e
−
β
.
Tpeak T
p
e
a
k
Get Radiology Tree app to read full this article<
Get Radiology Tree app to read full this article<
Tpeak=1αlog(1+qαβ). T
peak
=
1
α
log
(
1
+
q
α
β
)
.
Get Radiology Tree app to read full this article<
Data Analysis and Statistical Evaluation
Get Radiology Tree app to read full this article<
Get Radiology Tree app to read full this article<
Results
Get Radiology Tree app to read full this article<
Get Radiology Tree app to read full this article<
Get Radiology Tree app to read full this article<
Get Radiology Tree app to read full this article<
Table 1
Summary of Kinetic Parameters Calculated from the TCM, the EMM, and Semiquantitative Parameters for Normal ( n = 32) and Abnormal ( n = 19) Bowel Segments
Parameter Normal Abnormal_P_ TCM_K_ trans 0.49 ± 0.36 0.81 ± 0.60 .05 ∗ v e 0.25 ± 0.12 0.36 ± 0.12 .001 ∗ R 2 0.76 ± 0.13 0.80 ± 0.18 .46 EMM_A_ 1.69 ± 1.18 3.21 ± 1.45 .004 ∗ q 2.5 ± 2.1 1.59 ± 1.27 .07 α 3.51 ± 2.90 3.33 ± 2.49 .81 β 0.034 ± 0.080 0.026 ± 0.120 .77R 2 0.80 ± 0.12 0.89 ± 0.12 .02 ∗ Semiquantitative analysis IAUC 0.85 ± 0.59 1.70 ± 0.74 .0002 ∗ T peak 3.0 ± 1.7 3.9 ± 2.8 .18 slope ini 1.32 ± 0.87 2.56 ± 1.27 .001 ∗
A , contrast uptake; α, rate of contrast uptake; β, rate of contrast washout; EMM, empirical mathematical model; IAUC, initial area under the curve; K trans , volume transfer constant; q , related to the slope of early uptake; slope ini , initial slope of enhancement; TCM, two-compartment model; T peak , time to peak enhancement; v e , extravascular extracellular space volume.
Data are expressed as mean ± standard deviation for all cases.
Get Radiology Tree app to read full this article<
Get Radiology Tree app to read full this article<
Get Radiology Tree app to read full this article<
Get Radiology Tree app to read full this article<
Get Radiology Tree app to read full this article<
Discussion
Get Radiology Tree app to read full this article<
Get Radiology Tree app to read full this article<
Get Radiology Tree app to read full this article<
Get Radiology Tree app to read full this article<
Get Radiology Tree app to read full this article<
Get Radiology Tree app to read full this article<
Get Radiology Tree app to read full this article<
References
1. Wills J.S., Lobis I.F., Denstman F.J.: Crohn disease: state of the art. Radiology 1997; 202: pp. 597-610.
2. Gore R.M., Balthazar E.J., Ghahremani G.G., Miller F.H.: CT features of ulcerative colitis and Crohn’s disease. AJR Am J Roentgenol 1996; 167: pp. 3-15.
3. Shoenut J.P., Semelka R.C., Magro C.M., et. al.: Comparison of magnetic resonance imaging and endoscopy in distinguishing the type and severity of inflammatory bowel disease. J Clin Gastroenterol 1994; 19: pp. 31-35.
4. Maccioni F., Viscido A., Broglia L., et. al.: Evaluation of Crohn disease activity with magnetic resonance imaging. Abdom Imaging 2000; 25: pp. 219-228.
5. Low R.N., Sebrechts C.P., Politoske D.A., et. al.: Crohn disease with endoscopic correlation: single-shot fast spin-echo and gadolinium-enhanced fat-suppressed spoiled gradient-echo MR imaging. Radiology 2002; 222: pp. 652-660.
6. Koh D.M., Miao Y., Chinn R.J., et. al.: MR imaging evaluation of the activity of Crohn’s disease. AJR Am J Roentgenol 2001; 177: pp. 1325-1332.
7. Maccioni F., Bruni A., Viscido A., et. al.: MR imaging in patients with Crohn disease: value of T2- versus T1-weighted gadolinium-enhanced MR sequences with use of an oral superparamagnetic contrast agent. Radiology 2006; 238: pp. 517-530.
8. Fidler J.: MR imaging of the small bowel. Radiol Clin North Am 2007; 45: pp. 317-331.
9. Gourtsoyiannis N.C., Grammatikakis J., Papamastorakis G., et. al.: Imaging of small intestinal Crohn’s disease: comparison between MR enteroclysis and conventional enteroclysis. Eur Radiol 2006; 16: pp. 1915-1925.
10. Kettritz U., Isaacs K., Warshauer D.M., Semelka R.C.: Crohn’s disease. Pilot study comparing MRI of the abdomen with clinical evaluation. J Clin Gastroenterol 1995; 21: pp. 249-253.
11. Semelka R.C., Shoenut J.P., Silverman R., et. al.: Bowel disease: prospective comparison of CT and 1.5-T pre- and postcontrast MR imaging with T1-weighted fat-suppressed and breath-hold FLASH sequences. J Magn Reson Imaging 1991; 1: pp. 625-632.
12. Sempere G.A., Martinez Sanjuan V., Medina Chulia E., et. al.: MRI evaluation of inflammatory activity in Crohn’s disease. AJR Am J Roentgenol 2005; 184: pp. 1829-1835.
13. Schunk K., Kern A., Oberholzer K., et. al.: Hydro-MRI in Crohn’s disease: appraisal of disease activity. Invest Radiol 2000; 35: pp. 431-437.
14. Pauls S., Gabelmann A., Schmidt S.A., et. al.: Evaluating bowel wall vascularity in Crohn’s disease: a comparison of dynamic MRI and wideband harmonic imaging contrast-enhanced low MI ultrasound. Eur Radiol 2006; 16: pp. 2410-2417.
15. Florie J., Wasser M.N., Arts-Cieslik K., et. al.: Dynamic contrast-enhanced MRI of the bowel wall for assessment of disease activity in Crohn’s disease. AJR Am J Roentgenol 2006; 186: pp. 1384-1392.
16. Del Vescovo R., Sansoni I., Caviglia R., et. al.: Dynamic contrast enhanced magnetic resonance imaging of the terminal ileum: differentiation of activity of Crohn’s disease. Abdom Imaging 2008; 33: pp. 417-424.
17. Pupillo V.A., Di Cesare E., Frieri G., et. al.: Assessment of inflammatory activity in Crohn’s disease by means of dynamic contrast-enhanced MRI. Radiol Med 2007; 112: pp. 798-809.
18. Padhani A.R., Hayes C., Landau S., Leach M.O.: Reproducibility of quantitative dynamic MRI of normal human tissues. NMR Biomed 2002; 15: pp. 143-153.
19. Tofts P.S., Brix G., Buckley D.L., et. al.: Estimating kinetic parameters from dynamic contrast-enhanced T(1)-weighted MRI of a diffusable tracer: standardized quantities and symbols. J Magn Reson Imaging 1999; 10: pp. 223-232.
20. Medved M., Karczmar G., Yang C., et. al.: Semiquantitative analysis of dynamic contrast enhanced MRI in cancer patients: variability and changes in tumor tissue over time. J Magn Reson Imaging 2004; 20: pp. 122-128.
21. Stanisz G.J., Henkelman R.M.: Gd-DTPA relaxivity depends on macromolecular content. Magn Reson Med 2000; 44: pp. 665-667.
22. Fan X., Medved M., River J.N., et. al.: New model for analysis of dynamic contrast-enhanced MRI data distinguishes metastatic from nonmetastatic transplanted rodent prostate tumors. Magn Reson Med 2004; 51: pp. 487-494.
23. Fan X., Medved M., Karczmar G.S., et. al.: Diagnosis of suspicious breast lesions using an empirical mathematical model for dynamic contrast-enhanced MRI. Magn Reson Imaging 2007; 25: pp. 593-603.
24. Danese S., Sans M., de la Motte C., et. al.: Angiogenesis as a novel component of inflammatory bowel disease pathogenesis. Gastroenterology 2006; 130: pp. 2060-2073.
25. Brahme F., Lindstrom C.: A comparative radiographic and pathological study of intestinal vaso-architecture in Crohn’s disease and in ulcerative colitis. Gut 1970; 11: pp. 928-940.
26. Barrett T., Brechbiel M., Bernardo M., Choyke P.L.: MRI of tumor angiogenesis. J Magn Reson Imaging 2007; 26: pp. 235-249.
27. Ajaj W.M., Lauenstein T.C., Pelster G., et. al.: Magnetic resonance colonography for the detection of inflammatory diseases of the large bowel: quantifying the inflammatory activity. Gut 2005; 54: pp. 257-263.