
Rationale and Objectives
To investigate the feasibility using quantitative morphology/texture features of breast lesions for diagnostic prediction, and to explore the association of computerized features with lesion phenotype appearance on magnetic resonance imaging.
Materials and Methods
Forty-three malignant/28 benign lesions were used in this study. A systematic approach from automated lesion segmentation, quantitative feature extraction, diagnostic feature selection using an artificial neural network (ANN), and lesion classification was carried out. Eight morphologic parameters and 10 gray level co-occurrence matrix texture features were obtained from each lesion. The diagnostic performance of selected features to differentiate between malignant and benign lesions was analyzed using receiver-operating characteristic analysis.
Results
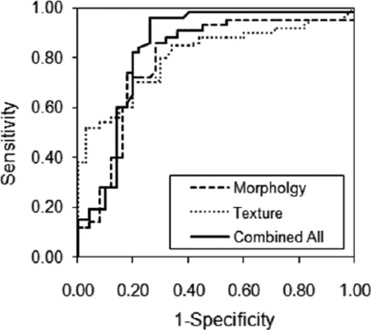
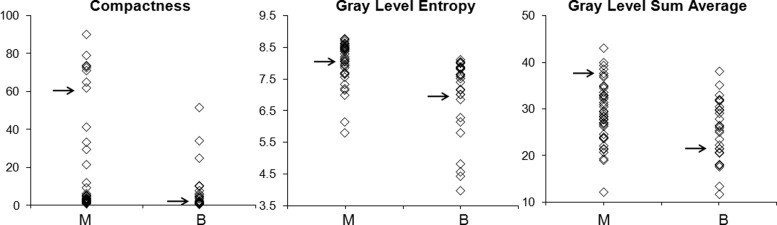
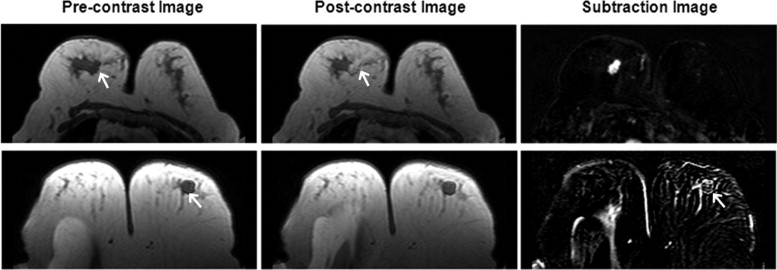
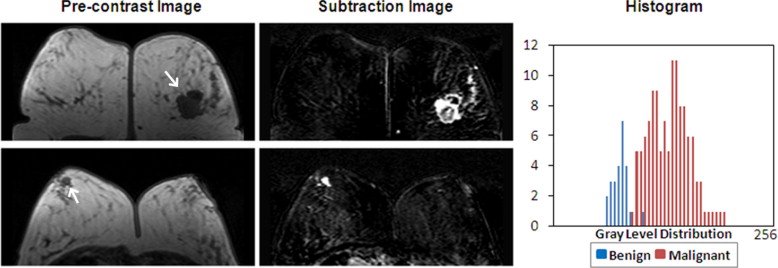
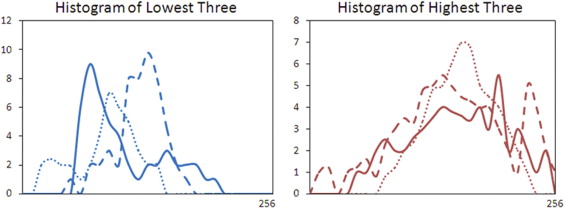
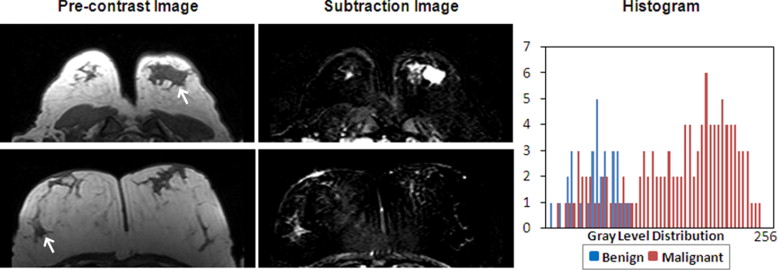
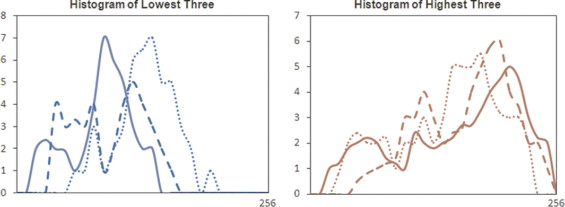
Six features were selected by an ANN using leave-one-out cross validation, including compactness, normalized radial length entropy, volume, gray level entropy, gray level sum average, and homogeneity. The area under the receiver-operating characteristic curve was 0.86. When dividing the database into half training and half validation set, a classifier of five features selected in the half training set achieved an area under the curve of 0.82 in the other half validation set. The selected morphology feature “compactness” was associated with shape and margin in the Breast Imaging Reporting and Data System lexicon, round shape and smooth margin for the benign lesions, and more irregular shape for the malignant lesions. The selected texture features were associated with homogeneous/heterogeneous patterns and the enhancement intensity. The malignant lesions had higher intensity and broader distribution on the enhancement histogram (more heterogeneous) compared to the benign lesions.
Conclusion
Quantitative analysis of morphology/texture features of breast lesions was feasible, and these features could be selected by an ANN to form a classifier for differential diagnosis. Establishing the link between computer-based features and visual descriptors defined in the BI-RADS lexicon will provide the foundation for the acceptance of quantitative diagnostic features in the development of computer-aided diagnosis.
Dynamic contrast-enhanced magnetic resonance imaging (DCE-MRI) has evolved into an established clinical imaging modality for detection and diagnosis of breast lesions. The American Cancer Society has issued a guideline recommending annual breast MRI screening for women with lifetime breast cancer risk greater than 20%–25%. Breast MRI has demonstrated a high sensitivity, however, with varied specificity (37%–97% reported in the literature) ( ). The high false-positive finding may lead to unnecessary biopsies or overtreatment. As the use of breast MRI increases, the accuracy and efficiency in interpretation becomes a challenging issue. Development of a computer-aided diagnosis (CAD) system for breast MRI may provide practical help, particularly to mammographers who have limited experience on breast MRI.
CAD for mammography is by far the most mature among all medical imaging analysis systems. It detects abnormalities or suspicious regions, and marks them with different labels indicating different features with varying degrees of malignancy ( ). A great deal of research has also been spent on developing CAD for breast ultrasound ( ). Given the many more images acquired in MRI compared to mammography and ultrasound, development of breast MRI CAD is far more challenging, but on the other hand will be very helpful. The currently existing commercial CAD systems for breast MRI, such as CADstream (Confirma Inc. Kirkland, WA) and fTP (CADsciences, White Plains, NY) provide display platforms to show various presentations of the enhanced lesions to assist radiologists’ interpretation. The display is mainly based on the enhancement kinetic features, such as the washout patterns of voxels with the percent enhancement above a preset threshold. The morphologic features as defined in the Breast Imaging Reporting and Data System (BI-RADS) lexicon ( ), as well as the final diagnostic impression, will have to be evaluated by radiologists.
Get Radiology Tree app to read full this article<
Get Radiology Tree app to read full this article<
Get Radiology Tree app to read full this article<
Materials and methods
Subjects and MRI Protocol
Get Radiology Tree app to read full this article<
Table 1
Histopathology of Benign and Malignant Breast Lesions
Subtype of Tumors_n_ Percentage Benign lesions 28 Fibrocystic changes 8 29% Fibroadenoma 15 53% Others 5 18% Malignant lesions 43 Invasive ductal carcinoma 27 63% Ductal carcinoma in-situ 4 9% Invasive lobular carcinoma 8 19% Others 4 9%
Get Radiology Tree app to read full this article<
Get Radiology Tree app to read full this article<
Overall Analysis Scheme
Get Radiology Tree app to read full this article<
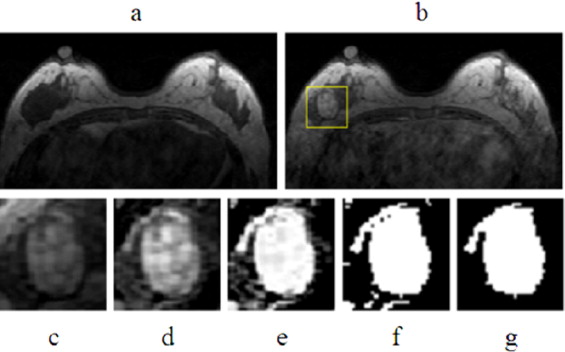
Lesion Segmentation
Get Radiology Tree app to read full this article<
Get Radiology Tree app to read full this article<
Get Radiology Tree app to read full this article<
Feature Extraction
Get Radiology Tree app to read full this article<
Get Radiology Tree app to read full this article<
Diagnostic Feature Selection
Get Radiology Tree app to read full this article<
Get Radiology Tree app to read full this article<
Get Radiology Tree app to read full this article<
Results
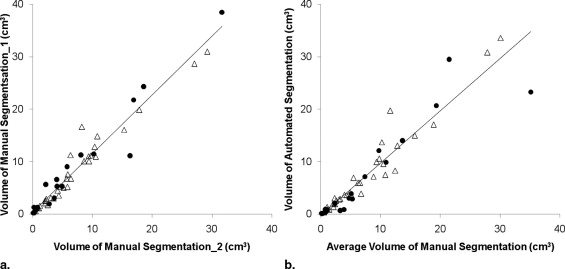
Evaluation of Computerized vs. Manual Lesion Segmentation
Get Radiology Tree app to read full this article<
Get Radiology Tree app to read full this article<
Diagnostic Performance of Individual and Combined Features
Get Radiology Tree app to read full this article<
Get Radiology Tree app to read full this article<
Get Radiology Tree app to read full this article<
Get Radiology Tree app to read full this article<
Table 2
Group Mean, P Value, and Diagnostic Accuracy of Selected Parameters
Parameters Mean ± SD_P_ Value Diagnostic Accuracy (AUC ± SD) Benign Malignant Compactness 6.79 ± 3.56 26.1 ± 11.3 .001 0.76 ± 0.06 NRL entropy 0.59 ± 0.33 0.31 ± 0.29 .01 0.65 ± 0.07 Volume 8357 ± 4688 6335 ± 4975 .27 0.57 ± 0.08 Gray level entropy 7.11 ± 1.30 8.02 ± 0.88 .002 0.74 ± 0.06 Gray level sum average 25.2 ± 6.58 29.2 ± 6.11 .01 0.67 ± 0.06 Homogeneity 0.21 ± 0.12 0.22 ± 0.06 .70 0.51 ± 0.07
AUC, area under the curve; NRL, normalized radial length; SD, standard deviation.
Get Radiology Tree app to read full this article<
Morphology Feature—Compactness
Get Radiology Tree app to read full this article<
Get Radiology Tree app to read full this article<
Texture Feature—GLCM Gray Level Entropy
Get Radiology Tree app to read full this article<
Get Radiology Tree app to read full this article<
Texture Feature—GLCM Gray Level Sum Average
Get Radiology Tree app to read full this article<
Get Radiology Tree app to read full this article<
Discussion
Get Radiology Tree app to read full this article<
Table 3
Previous Publications on Semi/Automated Lesion Classification in Breast MRI
Ref # Author (y) Case # Lesion Segmentation Feature Statistical Analysis Gihuijs (1998) 15 M, 13 B Manual 3D shape-based LDA Gibbs (2003) 20 M, 23 B Manual GLCM Texture, DCE LDA Chen (2004) 77 M, 44 B Region growing DCE_t_ -test Chen (2005) 77 M, 44 B FCM N/A N/A Chen (2006) 77 M, 44 B FCM Hot Spot DCE_t_ -test Liney (2006) 32 M, 15 B Threshold Shape-based, DCE_t_ -test Meinel (2007) 40 M, 23 B Region growing Shape-based, DCE BNN Chen (2007) 77 M, 44 B FCM 3D texture_t_ -test
3D, three-dimensional; B, benign lesions; BNN, backpropagation neural network; DCE, dynamic contrast-enhanced parameters; FCM, fuzzy c-means; GLCM, gray level co-occurrence matrixes; LDA, linear discriminative analysis; M, malignant lesions.
Get Radiology Tree app to read full this article<
Get Radiology Tree app to read full this article<
Get Radiology Tree app to read full this article<
Get Radiology Tree app to read full this article<
Get Radiology Tree app to read full this article<
Get Radiology Tree app to read full this article<
Get Radiology Tree app to read full this article<
Get Radiology Tree app to read full this article<
Get Radiology Tree app to read full this article<
Get Radiology Tree app to read full this article<
Appendix
Get Radiology Tree app to read full this article<
VolumeVol=∑∀x,∀y,∀zFROI(x,y,z)⋅p2⋅t V
o
l
=
∑
∀
x
,
∀
y
,
∀
z
F
R
O
I
(
x
,
y
,
z
)
⋅
p
2
⋅
t (1) SurfaceSurf=∑∀x,∀y,∀zSROI(x,y,z)⋅p⋅t S
u
r
f
=
∑
∀
x
,
∀
y
,
∀
z
S
R
O
I
(
x
,
y
,
z
)
⋅
p
⋅
t (2) CompactnessComp=Surf2Vol C
o
m
p
=
S
u
r
f
2
V
o
l (3) NRL meanμNRL=1N∑j=1…Nrj μ
N
R
L
=
1
N
∑
j
=
1
.
.
.
N
r
j (4) SphericitySpher=μNRLσNRL S
p
h
e
r
=
μ
N
R
L
σ
N
R
L (5) NRL entropyENRL=−∑j=1…Hprobjlog2(probj) E
N
R
L
=
−
∑
j
=
1
.
.
.
H
p
r
o
b
j
log
2
(
p
r
o
b
j
) (6) WhereProbj=rj∑rj Pr
o
b
j
=
r
j
∑
r
j NRL ratioRNRL=1N.μNRL∑j=1…N(rj−μNRL):rj>μNRL R
N
R
L
=
1
N
.
μ
N
R
L
∑
j
=
1
.
.
.
N
(
r
j
−
μ
N
R
L
)
:
r
j
μ
N
R
L (7) RoughnessRough=1N∑j=1…N(rj−μNRL)4√4−1N∑j=1…N(rj−μNRL)2√μNRL R
o
u
g
h
=
1
N
∑
j
=
1
.
.
.
N
(
r
j
−
μ
N
R
L
)
4
4
−
1
N
∑
j
=
1
.
.
.
N
(
r
j
−
μ
N
R
L
)
2
μ
N
R
L (8)
where F ROI is the pixel number in the ROI, S ROI is the pixel number along the boundary of the ROI, and σ NRL is the standard deviation of NRL.
Get Radiology Tree app to read full this article<
Get Radiology Tree app to read full this article<
Get Radiology Tree app to read full this article<
References
1. Fischer U., Kopka L., Grabbe E.: Breast carcinoma: effect of preoperative contrast-enhanced MR imaging on the therapeutic approach. Radiology 1999; 213: pp. 881-888.
2. Schelfout K., Van G.M., Kersschot E., et. al.: Contrast-enhanced MR imaging of breast lesions and effect on treatment. Eur J Surg Oncol 2004; 30: pp. 501-507.
3. Mumtaz H., Hall-Craggs M.A., Davidson T., et. al.: Staging of symptomatic primary breast cancer with MR imaging. Am J Roentgenol 1997; 169: pp. 417-424.
4. Esserman L., Hyton N., Yassa L., et. al.: Utility of magnetic resonance imaging in the management of breast cancer: evidence for improved preoperative staging. J Clin Oncol 1999; 17: pp. 110-119.
5. Zhang Y., Fukatsu H., Naganawa S., et. al.: The role of contrast-enhanced MR mammography for determining candidates for breast conservation surgery. Breast Cancer 2002; 9: pp. 231-239.
6. Rieber A., Schirrmeister H., Gabelmann A., et. al.: Pre-operative staging of invasive breast cancer with MR mammography and/or PET: boon or bunk?. Br J Radiol 2002; 75: pp. 789-798.
7. Li H., Wang Y., Liu K.J., et. al.: Computerized radiographic mass detection—part I. IEEE Trans Med Imaging 2001; 20: pp. 289-301.
8. Polakowski W.E., Cournoyer D.A., Rogers S.K.: Computer-aided breast cancer detection and diagnosis of masses using difference of Gaussians and derivative-based feature saliency. IEEE Trans Med Imaging 1997; 16: pp. 811-819.
9. Rangayyan R.M., EL-Faramawy N.M., Desautels J.E.: Measures of acutance and shape for classification of breast tumors. IEEE Trans Med Imaging 1997; 16: pp. 799-810.
10. Chan H.P., Sahiner B., Petrick N., et. al.: Computerized classification of malignant and benign microcalcifications on mammograms: texture analysis using an artificial neural network. Phys Med Biol 1997; 42: pp. 549-567.
11. Drukker K., Giger M.L., Vyborny C.J., et. al.: Computerized detection and classification of cancer on breast ultrasound. Acad Radiol 2004; 11: pp. 526-535.
12. Huang Y.L., Chen D.R.: Support vector machines in sonography: application to decision making in the diagnosis of breast cancer. Clin Imaging 2005; 29: pp. 179-184.
13. Kim K.G., Cho S.W., Min S.J.: Computerized scheme for assessing ultrasonographic features of breast masses. Acad Radiol 2005; 12: pp. 58-66.
14. 2003.American College of RadiologyReston, VA
15. Gilhuijs K.G., Giger M.L., Bick U.: Computerized analysis of breast lesions in three dimensions using dynamic magnetic-resonance imaging. Med Phys 1998; 9: pp. 1647-1654.
16. Gibbs P., Turnbull L.W.: Textural analysis of contrast-enhanced MR images of the breast. Magn Reson Med 2003; 50: pp. 92-98.
17. Liney G.P., Sreenvias M., Garcia-Alvarez R., et. al.: Breast lesion analysis of shape technique: semi-automated vs. manual morphological description. J Magn Reson Imaging 2006; 23: pp. 493-498.
18. Chen W., Giger M.L., Lan L., et. al.: Computerized interpretation of breast MRI: investigation of enhancement-variance dynamics. Med Phys 2004; 31: pp. 1076-1082.
19. Chen W., Giger M.L., Bick U.: A fuzzy c-means (FCM)-based approach for computerized segmentation of breast lesions in dynamic contrast-enhanced MR images. Acad Radiol 2006; 13: pp. 63-72.
20. Chen W., Giger M.L., Bick U., et. al.: Automatic identification and classification of characteristic kinetic curves of breast lesions on DCE-MRI. Med Phys 2006; 33: pp. 2878-2887.
21. Meinel L.A., Stolpen A.H., Berbaum K.S., et. al.: Breast MRI lesion classification: improved performance of human readers with a backpropagation neural network computer-aided diagnosis (CAD) system. J Magn Reson Imaging 2007; 25: pp. 89-95.
22. Behrens S., Laue H., Althaus M., et. al.: Computer assistance for MR based diagnosis of breast cancer: present and future challenges. Comput Med Imaging Graph 2007; 31: pp. 236-247.
23. Haralick R.M., Shanmugam K., Dinstein I.: Texture parameters for image classification, IEEE Trans Syst, Man, Cybernet 1973; 3: pp. 610-621.
24. Penn A.L., Thompson S.F., Schnall M.D., et. al.: Fractal discrimination of MRI breast masses using multiple segmentations. Proc SPIE Med Imaging 2000; 3979: pp. 959-966.
25. Szabo B.K., Aspelin P., Wiberg M.K.: Neural network approach to the segmentation and classification of dynamic magnetic resonance images of the breast: comparison with empiric and quantitative kinetic parameters. Acad Radiol 2004; 11: pp. 1344-1354.
26. Chou Y.H., Tiu C.M., Hung G.S., et. al.: Stepwise logistic regression analysis of tumor contour features for breast ultrasound diagnosis. Ultrasound Med Biol 2001; 27: pp. 1493-1498.
27. Sahiner B., Chan H.P., Petrick N., et. al.: Improvement of mammographic mass characterization using spiculation measures and morphological features. Med Phys 2001; 28: pp. 1455-1465.
28. Stavros A.T., Thickman D., Rapp C.L., et. al.: Solid breast nodules: use of sonography to distinguish between benign and malignant lesions. Radiology 1995; 196: pp. 123-134.
29. Chen W., Giger M.L., Li H.: Volumetric texture analysis of breast lesions on contrast-enhanced magnetic resonance images. Magn Reson Med 2007; 58: pp. 562-571.
30. Liu P.F., Detain J.F., Caduff R.F., et. al.: Improved diagnostic accuracy in dynamic contrast enhanced MRI of the breast by combined quantitative and qualitative analysis. Br J Radiol 1998; 71: pp. 501-509.