
Rationale and Objectives
To evaluate cerebral blood volume (CBV) and permeability (PS) in spontaneously occurring cerebral neoplastic and non-neoplastic lesions in dogs using dynamic contrast-enhanced computed tomography (DCE-CT).
Materials and Methods
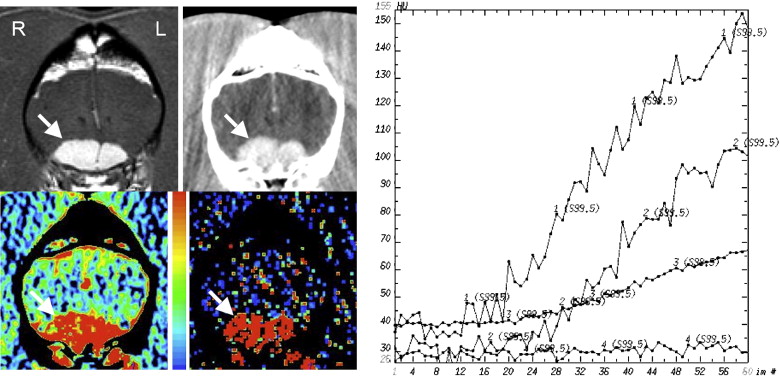
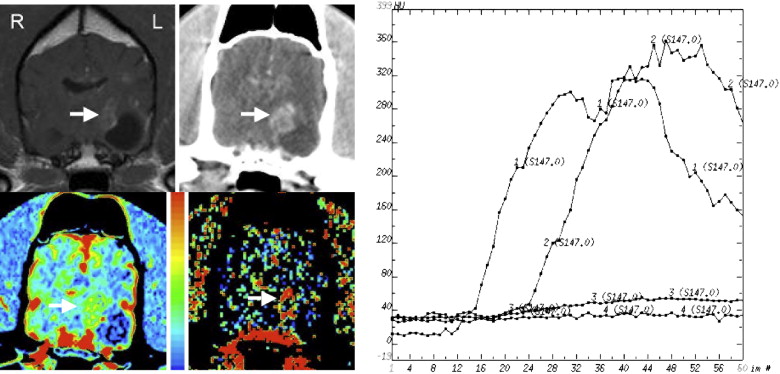
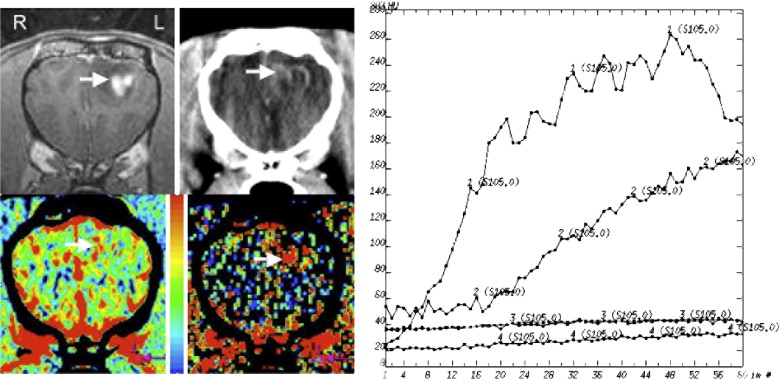
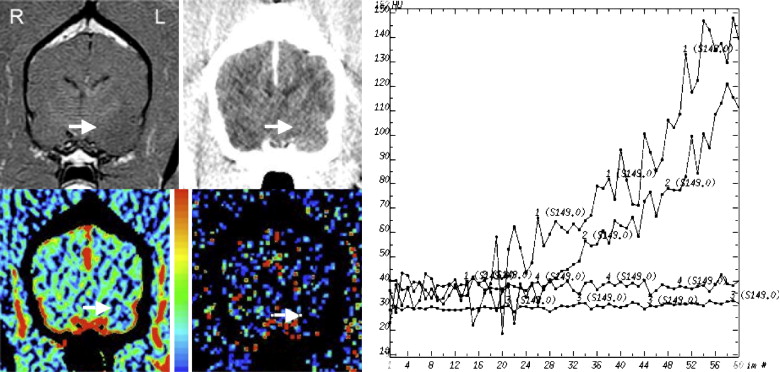
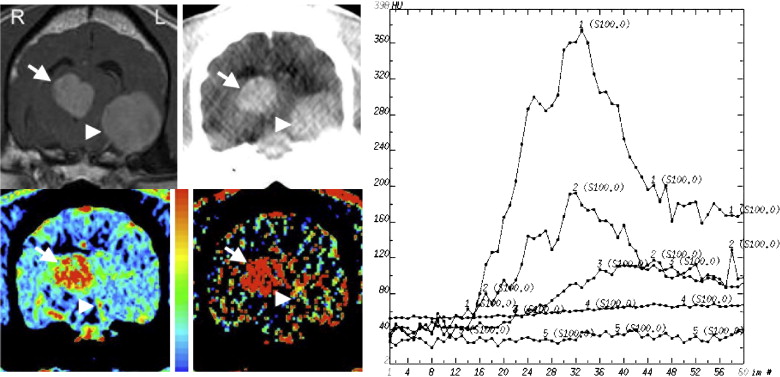
Dogs presenting with spontaneous intracranial lesions ( n = 16) underwent DCE-CT at the level of the lesion followed by a histologically confirmed diagnosis from a CT-guided stereotactic biopsy. Data post-processing was performed with commercially available CT software (GEMS Advantage Workstation 4.2). Symmetric regions of interest (ROIs) were drawn within the lesion and unaffected areas on the contralateral side. Values were compared between lesion types and ratios of lesion-to-normal brain were calculated.
Results
Dogs with extra-axial lesions ( n = 3 meningiomas) had marked elevation of CBV and PS compared to normal brain. All Grade III gliomas ( n = 5) had mildly elevated CBV and markedly elevated PS values. All lower Grade II gliomas ( n = 2) had minimal elevation in CBV and PS. Dogs with non-neoplastic intra-axial lesions (one each necrotizing, fungal, and lymphoplasmacytic encephalitis) had elevation of PS with normal to mildly elevated CBV. Lesion-to-normal brain ratios for PS separated extra- and intra-axial neoplasms and intra-axial inflammatory/degenerative lesions from each other.
Conclusions
Low-grade gliomas do not consistently demonstrate elevated vascular parameters, whereas Grade III gliomas and non-neoplastic intra-axial lesions have elevated PS. Ratios between such lesions and normal brain may prove useful for differentiating types of lesions. These findings resemble those previously reported in similar lesions in people indicating that the dog may act as a good model for intracranial masses for the study of lesion angiogenesis and response to therapy.
The role of angiogenesis in tumor growth has become increasingly clear . Angiogenesis is a complex process whereby increasing vascular density results in delivery of oxygen and nutrients to rapidly dividing tumor cells . Endothelial cells of tumor vessels are abnormal with large gaps allowing for extravasation of large particles. Elevated vascular density and increased permeability have been correlated with more aggressive tumor behavior in a variety of tumor types including gliomas . In recent years, anti-angiogenic drugs have been developed and are in various stages of clinical implementation in hopes of halting tumor growth through the inhibition of angiogenesis . The use of these agents has necessitated the development of noninvasive imaging techniques that can be serially repeated to assess angiogenic indicators such as vascular volume and permeability.
Recent developments in image processing have focused on deriving functional and molecular information from medical imaging. Dynamic contrast-enhanced (DCE) imaging techniques require serial acquisition of images in the same anatomic location during intravenous contrast administration, thereby allowing observation and quantification of the first pass of iodinated contrast media through the vasculature . This can be done using either computed tomography (CT) or magnetic resonance imaging (MRI). By measuring the rate of contrast enhancement in an input artery and an output vein and using deconvolution methods, the values of cerebral blood volume (CBV) and vascular permeability (PS) can be extrapolated . DCE-MRI has been used in experimental rodent models and in people to monitor brain tumor angiogenesis and response to anti-angiogenic agents, and changes in tumor permeability and vascular volume have been shown to correlate with response to therapy . CT provides several advantages over MRI including superior temporal resolution, more accessibility, less expense, and increased efficiency. Data processing is simplified with CT because, unlike MRI, there is a linear correlation between contrast agent concentration and signal intensity . DCE-CT has been used to quantify blood flow characteristics in experimental animal models and people with a variety of intracranial tumors . This method has compared favorably to gold standard techniques such as using microspheres to evaluate brain tumors in rodent models .
Get Radiology Tree app to read full this article<
Get Radiology Tree app to read full this article<
Materials and methods
Animals
Get Radiology Tree app to read full this article<
Imaging Procedure
Get Radiology Tree app to read full this article<
Biopsy Procedure
Get Radiology Tree app to read full this article<
Image Analysis
Get Radiology Tree app to read full this article<
Histopathologic Evaluation
Get Radiology Tree app to read full this article<
Data Analysis
Get Radiology Tree app to read full this article<
Statistical Analysis
Get Radiology Tree app to read full this article<
Results
Get Radiology Tree app to read full this article<
Table 1
The Histopathologic Diagnosis, CBV (mL/100g), PS (mL/min/100g), CBV Ratio, and PS Ratio are Shown for Each Dog
Dog No. Histologic Diagnosis CBV PS CBV Ratio PS Ratio 1 Necrotizing encephalitis 6.3 11.6 2.0 7.3 2 Granulomatous/fungal encephalitis 3.7 5.0 2.1 6.3 3 Histiocytic/plasmacytic encephalitis 2.5 0.56 0.7 4.3 4 Encephalomalacia 4.3 2.6 1.5 6.5 5 Astrocytoma (Grade III) 3.3 3.2 1.6 1.5 6 Oligodendroglioma (Grade III) 3.7 5.7 1.1 3.2 7 Oligodendroglioma (Grade III) 3.2 3.7 1.9 3.1 8 Oligodendroglioma (Grade III) 3.7 1.2 1.2 1.8 9 Oligodendroglioma (Grade III) 3.9 2.2 1.4 0.9 10 Oligodendroglioma (ungraded) 2.3 0.6 0.9 0.6 11 Astrocytoma (Grade II) 2.3 0.3 1.4 1.2 12 Astrocytoma (Grade II) 2.6 0.4 1.4 1.5 13 Meningioma 15.6 17.8 6.2 44.5 14 Meningioma 15.4 23.1 5.9 37.3 15 Meningioma 13.9 13.1 6.2 29.8 16 Choroid plexus tumor 7.3 25.4 5.8 47.9 16 Metastatic melanoma 2.2 6.7 1.7 12.6
CBV: cerebral blood volume; PS: permeability.
CBV and PS ratios were calculated by dividing the intralesional value by that in normal brain.
Get Radiology Tree app to read full this article<
Get Radiology Tree app to read full this article<
Get Radiology Tree app to read full this article<
Get Radiology Tree app to read full this article<
Get Radiology Tree app to read full this article<
Get Radiology Tree app to read full this article<
Get Radiology Tree app to read full this article<
Table 2
The Mean (± Standard Deviation) Values for CBV and PS are Shown for Dogs Grouped by Disease Process
CBV (mL/100 g) PS (mL/min/100 g) CBV Ratio PS Ratio Inflammatory ( n = 3) 4.2 (1.9) ∗ 5.7 (5.6) ∗ 1.6 (0.8) ∗ 5.9 (1.5) ∗ Gliomas ( n = 9) 3.0 (0.7) † 2.0 (1.9) † 1.3 (1.8) † 1.8 (0.9) ∗ † Meningiomas ( n = 3) 15.0 (0.9) ∗ † 18.0 (5.0) ∗ † 6.6 (3.2) ∗ † 37.1 (7.4) †
CBV: cerebral blood volume; PS: permeability.
CBV and PS ratios were calculated by dividing the intralesional value by that in normal brain.
Get Radiology Tree app to read full this article<
Get Radiology Tree app to read full this article<
Get Radiology Tree app to read full this article<
Get Radiology Tree app to read full this article<
Discussion
Get Radiology Tree app to read full this article<
Get Radiology Tree app to read full this article<
Get Radiology Tree app to read full this article<
Get Radiology Tree app to read full this article<
Get Radiology Tree app to read full this article<
Get Radiology Tree app to read full this article<
Get Radiology Tree app to read full this article<
Get Radiology Tree app to read full this article<
Get Radiology Tree app to read full this article<
References
1. Folkman J.: What is the evidence that tumors are angiogenesis dependent?. J Natl Cancer Inst 1990; 82: pp. 4-6.
2. Lebelt A., Dzieciol J., Guzinska-Ustymowicz K., et. al.: Angiogenesis in gliomas. Folia Histochem Cytobiol 2008; 46: pp. 69-72.
3. Rosen L.S.: Clinical experience with angiogenesis signaling inhibitors: focus on vascular endothelial growth factor (VEGF) blockers. Cancer Control 2002; 9: pp. 36-44.
4. Aronen H.J., Gazit I.E., Louis D.N., et. al.: Cerebral blood volume maps of gliomas: comparison with tumor grade and histologic findings. Radiology 1994; 191: pp. 41-51.
5. Guha A., Mukherjee J.: Advances in the biology of astrocytomas. Curr Opin Neurol 2004; 17: pp. 655-662.
6. Angelov L., Salhia B., Roncari L., et. al.: Inhibition of angiogenesis by blocking activation of the vascular endothelial growth factor receptor 2 leads to decreased growth of neurogenic sarcomas. Cancer Res 1999; 59: pp. 5536-5541.
7. Atiqur Rahman M., Toi M.: Anti-angiogenic therapy in breast cancer. Biomed Pharmacother 2003; 57: pp. 463-470.
8. Capdeville R., Buchdunger E., Zimmermann J., et. al.: Glivec (STI571, imatinib), a rationally developed, targeted anticancer drug. Nat Rev Drug Discov 2002; 1: pp. 493-502.
9. Katayama R., Huelsmeyer M.K., Marr A.K., et. al.: Imatinib mesylate inhibits platelet-derived growth factor activity and increases chemosensitivity in feline vaccine-associated sarcoma. Cancer Chemother Pharmacol 2004; 54: pp. 25-33.
10. Wong E.T., Brem S.: Antiangiogenesis treatment for glioblastoma multiforme: challenges and opportunities. J Natl Compr Canc Netw 2008; 6: pp. 515-522.
11. Blomley M.J., Coulden R., Bufkin C., et. al.: Contrast bolus dynamic computed tomography for the measurement of solid organ perfusion. Invest Radiol 1993; 28: pp. S72-S77. discussion S78
12. Cenic A., Nabavi D.G., Craen R.A., et. al.: Dynamic CT measurement of cerebral blood flow: a validation study. AJNR Am J Neuroradiol 1999; 20: pp. 63-73.
13. Brasch R.C., Gossmann A., Helbich T.H., et. al.: Can a small-molecular gadolinium contrast agent be applied successfully with dynamic MRI to quantitatively define brain tumor microvascular responses to angiogenesis inhibition?. Acad Radiol 2002; 2): pp. S326-S327.
14. Haroon H.A., Patankar T.F., Zhu X.P., et. al.: Comparison of cerebral blood volume maps generated from T2 ∗ and T1 weighted MRI data in intra-axial cerebral tumours. Br J Radiol 2007; 80: pp. 161-168.
15. Evelhoch J.L.: Key factors in the acquisition of contrast kinetic data for oncology. J Magn Reson Imaging 1999; 10: pp. 254-259.
16. Ding B., Ling H.W., Chen K.M., et. al.: Comparison of cerebral blood volume and permeability in preoperative grading of intracranial glioma using CT perfusion imaging. Neuroradiology 2006; 48: pp. 773-781.
17. Eastwood J.D., Lev M.H., Azhari T., et. al.: CT perfusion scanning with deconvolution analysis: pilot study in patients with acute middle cerebral artery stroke. Radiology 2002; 222: pp. 227-236.
18. Miles K.A.: Tumour angiogenesis and its relation to contrast enhancement on computed tomography: a review. Eur J Radiol 1999; 30: pp. 198-205.
19. Roberts H.C., Roberts T.P., Lee T.Y., et. al.: Dynamic contrast-enhanced computed tomography (CT) for quantitative estimation of microvascular permeability in human brain tumors. Acad Radiol 2002; 2): pp. S364-S367.
20. Cenic A., Nabavi D.G., Craen R.A., et. al.: A CT method to measure hemodynamics in brain tumors: validation and application of cerebral blood flow maps. AJNR Am J Neuroradiol 2000; 21: pp. 462-470.
21. Candolfi M., Curtin J.F., Nichols W.S., et. al.: Intracranial glioblastoma models in preclinical neuro-oncology: neuropathological characterization and tumor progression. J Neurooncol 2007; 85: pp. 133-148.
22. Lipsitz D., Higgins R.J., Kortz G.D., et. al.: Glioblastoma multiforme: clinical findings, magnetic resonance imaging, and pathology in five dogs. Vet Pathol 2003; 40: pp. 659-669.
23. Dickinson P.J., Sturges B.K., Higgins R.J., et. al.: Vascular endothelial growth factor mRNA expression and peritumoral edema in canine primary central nervous system tumors. Vet Pathol 2008; 45: pp. 131-139.
24. Rossmeisl J.H., Duncan R.B., Huckle W.R., et. al.: Expression of vascular endothelial growth factor in tumors and plasma from dogs with primary intracranial neoplasms. Am J Vet Res 2007; 68: pp. 1239-1245.
25. Peterson K.L., MacLeod A.G., Wisner E.R., et. al.: Quantitative assessment of blood volume, blood flow, and permeability of the brain of clinically normal dogs by use of dynamic contrast-enhanced computed tomography. Am J Vet Res 2008; 69: pp. 45-50.
26. Kishimoto M., Yamada K., Seok J.S., et. al.: Analysis of blood flow in a third ventricular ependymoma and an olfactory bulb meningioma by using perfusion computed tomography. J Vet Med Sci 2008; 70: pp. 981-983.
27. Koblik P.D., LeCouteur R.A., Higgins R.J., et. al.: CT-guided brain biopsy using a modified Pelorus Mark III stereotactic system: experience with 50 dogs. Vet Radiol Ultrasound 1999; 40: pp. 434-440.
28. Koblik P.D., LeCouteur R.A., Higgins R.J., et. al.: Modification and application of a Pelorus Mark III stereotactic system for CT-guided brain biopsy in 50 dogs. Vet Radiol Ultrasound 1999; 40: pp. 424-433.
29. Kleihues P., Louis D.N., Scheithauer B.W., et. al.: The WHO classification of tumors of the nervous system. J Neuropathol Exp Neurol 2002; 61: pp. 215-225. discussion 226–229
30. Louis D.N., Ohgaki H., Wiestler O.D., et. al.: The 2007 WHO classification of tumours of the central nervous system. Acta Neuropathol 2007; 114: pp. 97-109.
31. Barresi V., Cerasoli S., Vitarelli E., et. al.: Density of microvessels positive for CD105 (endoglin) is related to prognosis in meningiomas. Acta Neuropathol 2007; 114: pp. 147-156.
32. Dennis Cheong L.H., Tchoyoson Lim C.C., Koh T.S.: Dynamic contrast-enhanced CT of intracranial meningioma: comparison of distributed and compartmental tracer kinetic models—initial results. Radiology 2004; 232: pp. 921-930.
33. Haris M., Gupta R.K., Singh A., et. al.: Differentiation of infective from neoplastic brain lesions by dynamic contrast-enhanced MRI. Neuroradiology 2008; 50: pp. 531-540.
34. Maia A.C., Malheiros S.M., da Rocha A.J., et. al.: MR cerebral blood volume maps correlated with vascular endothelial growth factor expression and tumor grade in nonenhancing gliomas. AJNR Am J Neuroradiol 2005; 26: pp. 777-783.
35. Nabavi D.G., Cenic A., Henderson S., et. al.: Perfusion mapping using computed tomography allows accurate prediction of cerebral infarction in experimental brain ischemia. Stroke 2001; 32: pp. 175-183.
36. Hellier K.D., Hampton J.L., Guadagno J.V., et. al.: Perfusion CT helps decision making for thrombolysis when there is no clear time of onset. J Neurol Neurosurg Psychiatry 2006; 77: pp. 417-419.