
Rationale and Objectives
To study the effects of four different rigid alignment approaches on both time-concentration curves (TCCs) and perfusion maps in computed tomography perfusion (CTp) studies of liver and lung tumors.
Materials and Methods
Eleven data sets in patients who were subjected to axial CTp after contrast agent administration were assessed. Each data set consists of four different sequences, according to the different rigid alignment configurations considered to compute blood flow perfusion maps: no alignment, translational, craniocaudal, and three dimensional (3D). The color maps were built on TCCs according to the maximum slope method. The effects of motion correction procedures on the reliability of TCCs and perfusion maps were assessed both quantitatively and visually.
Results
TCCs built after 3D alignments show the best indices as well as producing the most reliable maps. We show examinations in which the translational alignment only yields more accurate TCCs, but less reliable perfusion maps, than those achieved with no alignment. Furthermore, we show color maps with two different perfusion patterns, both considered reliable by radiologists, achieved with different motion correction approaches.
Conclusions
The quantitative index we conceived allows relating quality of 3D alignment and reliability of perfusion maps. A better alignment does not necessarily yield more reliable perfusion values: color maps resulting from either alignment procedure must be critically assessed by radiologists. This achievement will hopefully represent a step forward for the clinical use of CTp studies for staging, prognosis, and monitoring values of therapeutic regimens.
Computed tomography perfusion (CTp) represents an important and promising imaging technique for the characterization and monitoring of various tumors at their different stages, since it can provide functional parameters at a high morphological resolution . This non-invasive and widely available technique is based on the estimation of the tissue’s contrast agent delivery and, accordingly, corresponding hemodynamic parameters, by analyzing time–concentration curves (TCCs), to detect changes in the vascular structure of the tissue, with potential correlation to anomalous blood supply patterns (eg, tumor angiogenesis). Accordingly, in the current clinical practice, this is arising as an important factor for prognostic evaluation of the effectiveness of the therapy for different kinds of tumors .
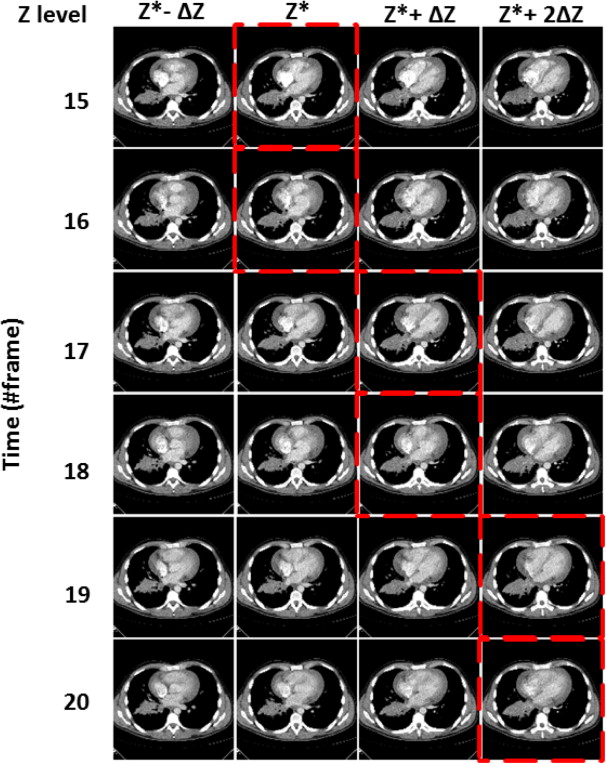
Currently, the reliability and the reproducibility of the functional results still represent an open issue, because of the high number of factors affecting the outcomes of CTp examinations, mainly due to examination protocols, acquisition artifacts, and methods of data processing and analysis . Importantly, the work by Miles et al. emphasizes how these factors actually hamper the development of common standard guidelines for CTp. Among these factors, the motion artifacts of the patient can break the spatial fidelity of the imaged structures, causing inconsistent intensity trends for the generic spatial location of interest. Respiratory movements and tumor spatial heterogeneity can lead to mis-registrations in both transverse ( x–y plane) and craniocaudal ( z -axis) directions. These artifacts are more pronounced in the lower part of the thorax and in the upper part of the abdomen, thus giving, especially for liver and lung CTp, misleading impressions of rapid or slow inflow/outflow patterns to radiologists, and affecting the reliability of the resulting perfusion parameters. Generally, breath-hold acquisitions, as well as abdominal straps and antiperistaltic agents are commonly adopted to limit the movement of these structures , although even breath-hold acquisitions show variability . Nevertheless, several image processing methods have been suggested in literature for motion compensation, mainly based on the post-processing of image data to perform registration to a reference data set. The impact of motion artifacts on CTp reproducibility for such methods is discussed for liver and lung tumors in , emphasizing how variability in the estimation of perfusion parameters can reach 70%–90% in the absence of any kind of compensation, while decreasing to relatively lower values (10%–20%) when data registration is applied. However, as reproducibility studies, the research by Ng et al. do not mention the reliability of perfusion patterns, which were not even submitted for evaluation by radiologists.
Get Radiology Tree app to read full this article<
Get Radiology Tree app to read full this article<
Get Radiology Tree app to read full this article<
Get Radiology Tree app to read full this article<
Materials and methods
Get Radiology Tree app to read full this article<
Table 1
Summary of the 11 Cases Requiring Multi-slice Alignment
Patient Tissue Notes Section (cm 2 ) ID1 Liver Metastases 2.74 ID2 Liver Metastases 1.95 ID3 Liver Metastases 4.04 ID4 Liver Metastases 2.39 ID5 Lung 1 Adenocarcinoma, IV stadium 22.11 ID6 Lung 1 Adenocarcinoma, IV stadium 15.82 ID7 Lung 1 Nodule, (n.a.) 20.58 ID8 Lung 1 Squamocellular carcinoma G2, IIIB stadium 7.29 ID9 Lung 1 Adenocarcinoma, (n.a.) 17.33 ID10 Lung 1 Adenocarcinoma, IV stadium 85.66 ID11 Lung 1 Squamocellular carcinoma, G3 43.27
n.a., not available.
Get Radiology Tree app to read full this article<
Perfusion CT Protocol
Get Radiology Tree app to read full this article<
Liver Perfusion Protocol
Get Radiology Tree app to read full this article<
Lung Perfusion Protocol
Get Radiology Tree app to read full this article<
Get Radiology Tree app to read full this article<
Image Alignment
Get Radiology Tree app to read full this article<
Get Radiology Tree app to read full this article<
Standard Fixed Mode (SF)
Get Radiology Tree app to read full this article<
Transverse Manual Registration (2D)
Get Radiology Tree app to read full this article<
Multislice Manual Registration (3D)
Get Radiology Tree app to read full this article<
Get Radiology Tree app to read full this article<
Transverse Manual Registration (1D)
Get Radiology Tree app to read full this article<
Get Radiology Tree app to read full this article<
Perfusion Maps
Get Radiology Tree app to read full this article<
Validation
Get Radiology Tree app to read full this article<
Quantitative Index
Get Radiology Tree app to read full this article<
Get Radiology Tree app to read full this article<
Qualitative Index
Get Radiology Tree app to read full this article<
Statistical Analysis
Get Radiology Tree app to read full this article<
Results
Get Radiology Tree app to read full this article<
Table 2
Summary of Both Quantitative and Qualitative Indexes Related to Perfusion Maps, for the Four Different Alignment configurations ( R stands for Rank ). SF, standard fixed mode
IDs Alignment Procedure SF 2D 1D 3D_E_ [μ ε ] σ(μ ε )R__E [μ ε ] σ(μ ε )R__E [μ ε ] σ(μ ε )R__E [μ ε ] σ(μ ε )R ID1 4.69 1.19 3 4.63 1.12 2 4.33 0.74 2 4.33 0.77 1 ID2 7.05 3.29 2 7.14 2.97 2 5.52 1.70 1 4.63 0.74 1 ID3 5.58 1.68 3 5.39 1.27 4 5.13 1.37 2 4.50 0.75 1 ID4 6.43 2.28 4 6.34 2.08 3 5.27 1.36 2 4.78 0.82 1 ID5 12.12 7.66 2 10.49 5.15 2 8.51 2.26 1 8.57 2.30 1 ID6 8.62 4.10 2 8.24 3.25 3 7.57 1.45 1 7.53 1.46 1 ID7 9.46 16.17 4 8.26 2.62 3 8.09 1.50 2 7.82 2.53 1 ID8 19.65 25.15 3 9.56 5.56 2 12.07 9.81 2 9.05 2.30 1 ID9 12.32 3.21 2 12.20 2.99 2 11.69 2.67 1 11.63 2.53 1 ID10 8.67 4.46 2 7.79 2.84 1 8.34 3.43 2 7.50 2.12 1 ID11 14.01 16.95 2 9.87 10.58 2 6.21 1.89 1 5.69 1.17 1
![Figure 2, Bar plot of E [μ ε ], with error bars equal to σ(μ ε ), for the 11 cases with the four alignment modes. SF, standard fixed mode.](https://storage.googleapis.com/dl.dentistrykey.com/clinical/QuantitativeAssessmentofEffectsofMotionCompensationforLiverandLungTumorsinCTPerfusion/1_1s20S1076633214002335.jpg)
Get Radiology Tree app to read full this article<
Get Radiology Tree app to read full this article<
Get Radiology Tree app to read full this article<
Get Radiology Tree app to read full this article<
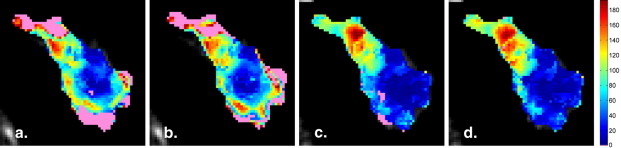
![Figure 3, Relationship between pre-correction μ ε of standard fixed mode (SF) maps (expressed in Hounsfield units [HU]) and the absolute differences in blood flow (BF), before and after 3D correction of SF maps, considering the values of all patients (a) ; μ ε of 2D maps and the absolute differences in BF, before and after 3D correction of 2D maps, gathering the values of all patients (b) , referred to ID5 (c) and to ID7 (d) . In each figure, the area of each circle is proportional to the number of values considered.](https://storage.googleapis.com/dl.dentistrykey.com/clinical/QuantitativeAssessmentofEffectsofMotionCompensationforLiverandLungTumorsinCTPerfusion/2_1s20S1076633214002335.jpg)
Get Radiology Tree app to read full this article<
Get Radiology Tree app to read full this article<
Get Radiology Tree app to read full this article<
Get Radiology Tree app to read full this article<
Get Radiology Tree app to read full this article<
Get Radiology Tree app to read full this article<
Get Radiology Tree app to read full this article<
Discussion
Get Radiology Tree app to read full this article<
Get Radiology Tree app to read full this article<
Get Radiology Tree app to read full this article<
Get Radiology Tree app to read full this article<
Acknowledgments
Get Radiology Tree app to read full this article<
Get Radiology Tree app to read full this article<
References
1. García-Figueiras R., Goh V.J., Padhani A.R., et. al.: CT perfusion in oncologic imaging: a useful tool?. Am J Roentgenol 2013; 200: pp. 8-19.
2. Petralia G., Preda L., D’Andrea G., et. al.: CT perfusion in solid-body tumours. Part I: technical issues. Radiol Med 2010; 115: pp. 843-857.
3. Goh V., Halligan S., Gharpuray A., et. al.: Quantitative assessment of colorectal cancer tumor vascular parameters by using perfusion CT: influence of tumor region of interest. Radiology 2008; 247: pp. 726-732.
4. Miles K.A., Lee T.-Y., Goh V., et. al.: Current status and guidelines for the assessment of tumour vascular support with dynamic contrast-enhanced computed tomography. Eur Radiol 2012; 22: pp. 1430-1441.
5. Petralia G., Bonello L., Viotti S., et. al.: CT perfusion in oncology: how to do it. Cancer Imaging 2010; 10: pp. 8-19.
6. Petralia G., Summers P., Viotti S., et. al.: Quantification of variability in breath-hold perfusion CT of hepatocellular carcinoma: a step toward clinical use. Radiology 2012; 265: pp. 448-456.
7. Ng C.S., Chandler A.G., Wei W., et. al.: Reproducibility of CT perfusion parameters in liver tumors and normal liver. Radiology 2011; 260: pp. 762-770.
8. Ng C.S., Chandler A.G., Wei W., et. al.: Reproducibility of perfusion parameters obtained from perfusion CT in lung tumors. Am J Roentgenol 2011; 197: pp. 113-121.
9. Lind J.S., Meijerink M.R., Dingemans A.-M.C., et. al.: Dynamic contrast-enhanced CT in patients treated with sorafenib and erlotinib for non small cell lung cancer: a new method of monitoring treatment?. Eur Radiol 2010; 20: pp. 2890-2898.
10. Meijerink M.R., van Waesberghe J.H.T.M., van der Weide L., et. al.: Total-liver-volume perfusion CT using 3-D image fusion to improve detection and characterization of liver metastases. Eur Radiol 2008; 18: pp. 2345-2354.
11. Ng Q.S., Goh V., Klotz E., et. al.: Quantitative assessment of lung cancer perfusion using MDCT: does measurement reproducibility improve with greater tumor volume coverage?. Am J Roentgenol 2006; 187: pp. 1079-1084.
12. Fraioli F., Anzidei M., Zaccagna F., et. al.: Whole-tumor perfusion CT in patients with advanced lung adenocarcinoma treated with conventional and antiangiogenetic chemotherapy: initial experience. Radiology 2011; 259: pp. 574-582.
13. Goh V., Dattani M., Farwell J., et. al.: Radiation dose from volumetric helical perfusion CT of the thorax, abdomen or pelvis. Eur Radiol 2011; 21: pp. 974-981.
14. Bader T.R., Grabenwöger F., Prokesch R.W., et. al.: Measurement of hepatic perfusion with dynamic computed tomography: assessment of normal values and comparison of two methods to compensate for motion artifacts. Invest Radiol 2000; 35: pp. 539-547.
15. Nakashige A., Horiguchi J., Tamura A., et. al.: Quantitative measurement of hepatic portal perfusion by multidetector row CT with compensation for respiratory misregistration. Br J Radiol 2004; 77: pp. 728-734.
16. Ng Q.-S., Goh V., Fichte H., et. al.: Lung cancer perfusion at multi-detector row CT: reproducibility of whole tumor quantitative measurements. Radiology 2006; 239: pp. 547-553.
17. San Koh T., Thng C.H., Hartono S., et. al.: Dynamic contrast-enhanced CT imaging of hepatocellular carcinoma in cirrhosis: feasibility of a prolonged dual-phase imaging protocol with tracer kinetics modeling. Eur Radiol 2009; 19: pp. 1184-1196.
18. Chandler A., Wei W., Herron D.H., et. al.: Semiautomated motion correction of tumors in lung CT-perfusion studies. Acad Radiol 2011; 18: pp. 286-293.
19. Chandler A., Wei W., Anderson E.F., et. al.: Validation of motion correction techniques for liver CT perfusion studies. Br J Radiol 2012; 85: pp. e514-e522.
20. Jensen N.K.G., Lock M., Fisher B., et. al.: Prediction and reduction of motion artifacts in free-breathing dynamic contrast enhanced CT perfusion imaging of primary and metastatic intrahepatic tumors. Acad Radiol 2013; 20: pp. 414-422.
21. Ippolito D., Capraro C., Casiraghi A., et. al.: Quantitative assessment of tumour associated neovascularisation in patients with liver cirrhosis and hepatocellular carcinoma: role of dynamic-CT perfusion imaging. Eur Radiol 2012; 22: pp. 803-811.
22. Kandel S., Meyer H., Hein P., et. al.: Comparison of free breathing versus breath-hold in perfusion imaging using dynamic volume CT. Insights Imaging 2012; 3: pp. 323-328.