
Rationale and Objectives
The use of hyperpolarized 3 He magnetic resonance imaging as a quantitative lung imaging tool has progressed rapidly in the past decade, mostly in the assessment of the airway diseases chronic obstructive pulmonary disease and asthma. This technique has shown potential to assess both structural and functional information in healthy and diseased lungs. In this study, the regional measurements of structure and function were applied to a bleomycin rat model of interstitial lung disease.
Materials and Methods
Male Sprague-Dawley rats (weight, 300–350 g) were administered intratracheal bleomycin. After 3 weeks, apparent diffusion coefficient and fractional ventilation were measured by 3 He magnetic resonance imaging and pulmonary function testing using a rodent-specific plethysmography chamber. Sensitized and healthy animals were then compared using threshold analysis to assess the potential sensitivity of these techniques to pulmonary abnormalities.
Results
No significant changes were observed in total lung volume and compliance between the two groups. Airway resistance elevated and forced expiratory volume significantly declined in the 3-week bleomycin rats, and fractional ventilation was significantly decreased compared to control animals ( P < .0004). The apparent diffusion coefficient of 3 He showed a smaller change but still a significant decrease in 3-week bleomycin animals ( P < .05).
Conclusions
Preliminary results suggest that quantitative 3 He magnetic resonance imaging can be a sensitive and noninvasive tool to assess changes in an animal interstitial lung disease model. This technique may be useful for longitudinal animal studies and also in the investigation of human interstitial lung diseases.
Of all the pulmonary diseases, idiopathic pulmonary fibrosis (IPF) is one of the most debilitating because is a progressive disorder for which the etiology and pathogenesis are unknown, and there is no effective therapy . IPF is a relatively rare disease, with a prevalence in men of approximately 20 in 100,000 and in woman of 13 in 100,000. In addition, the incidence of this disorder appears to have risen over the past decade. The obstacles and shortcomings to learning about effectively treating this disease must be overcome to care for the 5 million people worldwide with IPF. Because of the current lack of knowledge and understanding of this disorder, patients diagnosed with IPF face a median survival time after diagnosis of 3.2 years . To date, despite there being much interest in determining the causes of IPF and in finding effective treatments, no methods have yet come forward to solve either problem .
A major shortcoming that makes the discovery of new therapies a challenge to investigators is the inability to find a reliable early marker of progressive disease . The pathologic changes noted in IPF are not specific and are regionally heterogeneous . In addition, the changes can also be seen in other disorders, such as asbestosis. Fibrosis appears to be an active process, and it is characterized by the presence of fibrogenic foci. This is thought to cause remodeling of the lung, with the destruction of alveoli and thickening of the interstitium . These pathologic changes are also thought to result in the physiologic changes that are characterized by decrease in lung volume, an increase in lung stiffness or decreased compliance, and finally a decreased ability of the lung to transfer oxygen from the airspaces to the red blood cells. Unfortunately, the techniques used to measure changes in lung volume, compliance, and oxygen transfer are difficult, and some that are not routinely performed (compliance) have high variability (diffusion capacity) and can be affected by other processes (forced vital capacity and total lung capacity [TLC]). Several techniques to monitor progression have been used to record changes in forced vital capacity, diffusion capacity, and 6-minute walking distance and/or changes on chest computed tomography. Changes on chest computed tomography have not proven useful, and forced vital capacity, diffusion capacity, and 6-minute walking distance cannot measure regional changes but only global changes in function. To this end, we chose to explore IPF using a new technique, namely, hyperpolarized (HP) gas imaging technology.
Get Radiology Tree app to read full this article<
Get Radiology Tree app to read full this article<
Materials and methods
Study Animals
Get Radiology Tree app to read full this article<
Bleomycin Model Induction
Get Radiology Tree app to read full this article<
Preparation of Animals for Imaging
Get Radiology Tree app to read full this article<
Get Radiology Tree app to read full this article<
Hyperpolarization of Helium
Get Radiology Tree app to read full this article<
Imaging Equipment and Parameters
Get Radiology Tree app to read full this article<
Regional Measurement of Gas Replacement: Fractional Ventilation
Get Radiology Tree app to read full this article<
S(j)=r×S0+(1−r)×S(j−1)×exp(DRF+DO2),S(0)=0. S
(
j
)
=
r
×
S
0
+
(
1
−
r
)
×
S
(
j
−
1
)
×
exp
(
D
RF
+
DO
2
)
,
S
(
0
)
=
0
.
This model was used to yield fractional ventilation maps by solving for the r value on a pixel-by-pixel basis. S 0 is the signal proportional to the source magnetization of the HP 3 He in the ventilator reservoir, and S ( j ) represents the signal intensity for the j th breath. The oxygen-induced depolarization of 3 He during each breath is governed by D o 2 = −τ/ T 1, o 2 , where T 1, o 2 = ξ/P o 2 is the oxygen-induced depolarization time constant of HP 3 He as a function of the partial pressure of oxygen (P o 2 ) present in the airways, with ξ ≈ 2.6 bar · s at normal body temperature . The RF depolarization effect D RF = N PE × ln(cos α) represents the accumulative effect of repeated RF excitations on HP 3 He, where α represents the RF pulse flip angle, and N PE is the number of pulses triggered per image (ie, the number of phase encode lines). From a practical standpoint, the oxygen decay effect has a negligible effect on signal buildup , and therefore a nominal value of P o 2 = 140 mbar was assumed to hold throughout the lung. On the other hand, the RF pulse effect has a substantial effect on signal dynamics and is separately calculated on regional basis by acquiring a series of five back-to-back ventilation images during a 2-second breath hold at the end of the fractional ventilation maneuver.
Get Radiology Tree app to read full this article<
Regional Measurement of Lung Microstructure: ADC
Get Radiology Tree app to read full this article<
S(j)=S0×exp[NPE×Incos(α)×j−b(j)×ADC−t(j)/T1o2], S
(
j
)
=
S
0
×
exp
[
N
PE
×
In
cos
(
α
)
×
j
−
b
(
j
)
×
ADC
−
t
(
j
)
/
T
1
o
2
]
,
where all other parameters represent the same quantities as in the fractional ventilation model.
Get Radiology Tree app to read full this article<
Histology
Get Radiology Tree app to read full this article<
Data Analysis
Get Radiology Tree app to read full this article<
Get Radiology Tree app to read full this article<
Get Radiology Tree app to read full this article<
Results
Lung Histology
Get Radiology Tree app to read full this article<
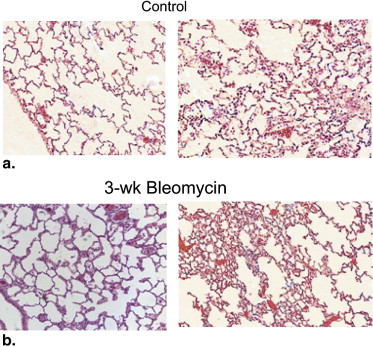
Get Radiology Tree app to read full this article<
Respiratory Physiology
Get Radiology Tree app to read full this article<
Table 1
Summary of Pulmonary Function Testing Measurements in the Two Groups of Rats
Rat TV (mL) FRC (mL) TLC (mL) FEV 100 (mL/100 ms) R I (cm H 2 O⋅s/mL) C dyn (mL/cm H 2 O) FEV 100 /FRC (100 ms −1 ) TV/(TV + FRC) FRC/TLC Healthy controls 2 2.7 4.7 17.4 9.2 0.11 0.43 1.97 0.36 0.27 3 2.7 5.3 17.6 10.2 0.05 0.34 1.91 0.34 0.30 4 3.4 6.8 22.9 8.5 0.08 0.59 1.24 0.33 0.30 Mean 2.9 5.6 19.3 9.3 0.08 0.45 1.71 0.34 0.29 SD 0.4 1.1 3.1 0.9 0.03 0.13 0.40 0.02 0.02 3-week bleomycin rats 1 1.5 5.2 10.1 2.3 0.30 0.33 0.44 0.23 0.51 2 3.1 5.9 20.7 4.5 0.19 0.42 0.77 0.35 0.28 3 2.5 5.7 16.6 5.3 0.21 0.56 0.93 0.30 0.34 4 2.8 8.3 18.6 3.8 0.41 0.47 0.45 0.25 0.45 5 1.9 10.2 12.7 1.4 0.47 0.13 0.13 0.16 0.81 6 3.3 12.7 21.8 2.0 0.65 0.50 0.15 0.20 0.58 Mean 2.5 8.0 16.7 3.2 0.37 0.40 0.48 0.25 0.50 SD 0.7 3.0 4.6 1.6 0.17 0.15 0.32 0.07 0.19
C dyn , dynamic compliance; FEV 100 , forced expiratory volume in 100 ms; FRC, functional residual capacity; R I = airway resistance; SD, standard deviation; TLC, total lung capacity; TV, total volume.
Get Radiology Tree app to read full this article<
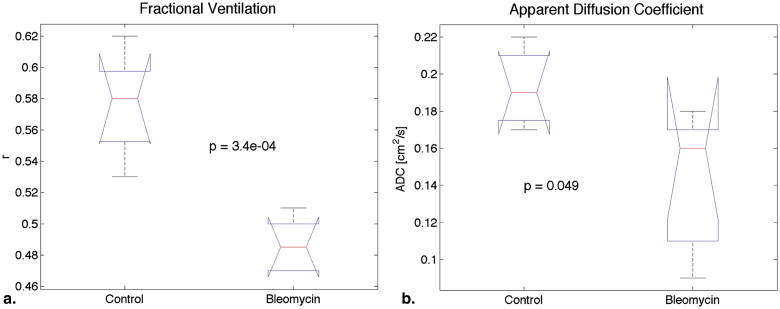
Regional Fractional Ventilation
Get Radiology Tree app to read full this article<
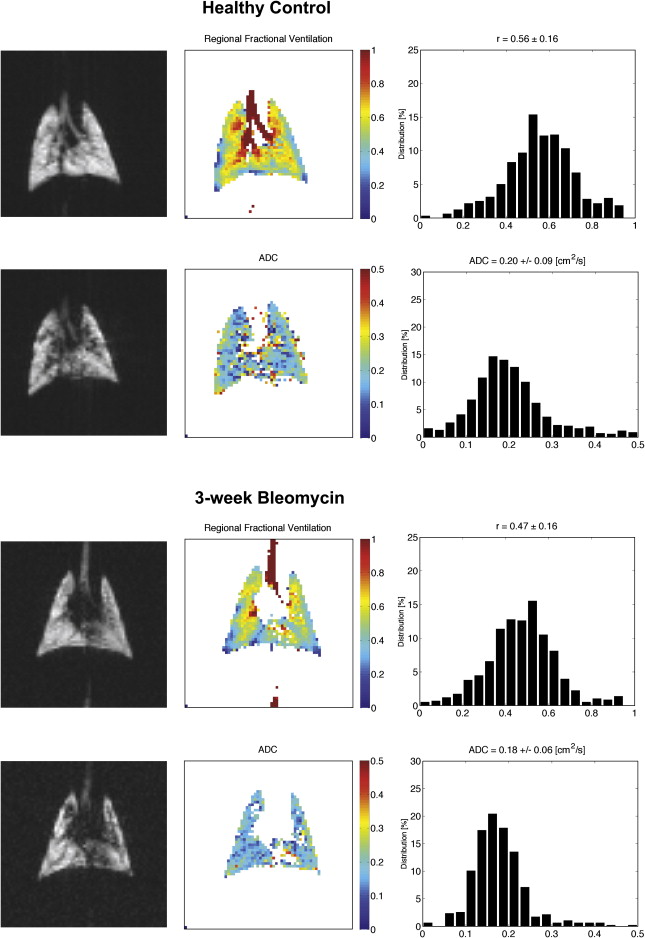
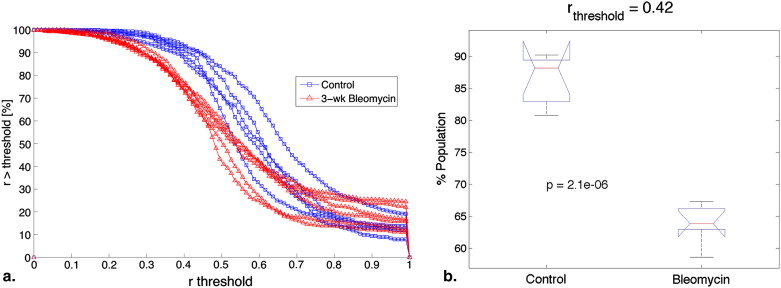
Table 2
Summary of Measurements of Fractional Ventilation in the Two Groups of Rats Along with the 80% Threshold Values
Rat Mean r Population Cutoff Percentage at r = 0.42 80% Threshold Healthy controls 1 0.58 ± 0.13 90.2 0.47 2 0.59 ± 0.16 88.2 0.45 3 0.62 ± 0.16 89.2 0.49 4 0.56 ± 0.16 80.8 0.42 5 0.53 ± 0.12 83.6 0.44 0.58 ± 0.03 86.4 ± 4.0 0.46 ± 0.03 3-week bleomycin rats 1 0.50 ± 0.19 66.2 0.34 2 0.47 ± 0.16 64.2 0.35 3 0.50 ± 0.17 63.5 0.36 4 0.47 ± 0.17 58.6 0.33 5 0.51 ± 0.18 67.3 0.34 6 0.47 ± 0.16 63.0 0.35 0.49 ± 0.02 63.3 ± 3.0 0.35 ± 0.01
Get Radiology Tree app to read full this article<
Regional ADC
Get Radiology Tree app to read full this article<
Table 3
Summary of Measurements of ADC in the Two Groups of Rats Along with the 80% Threshold Values
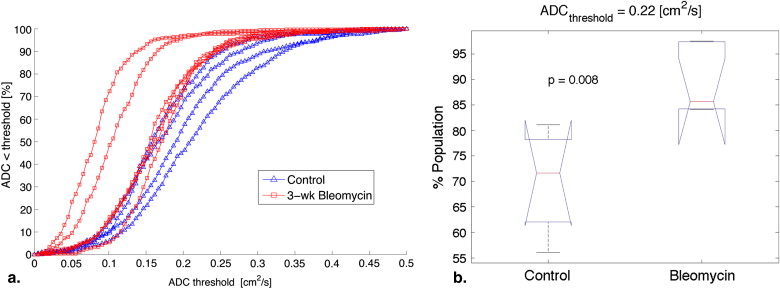
Rat Mean ADC (cm 2 /s) Population Cutoff Percentage at ADC = 0.22 cm 2 /s 80% Threshold (cm 2 /s) Healthy controls 1 — — — 2 0.18 ± 0.08 75.3 0.23 3 0.17 ± 0.07 81.1 0.22 4 0.20 ± 0.09 68.0 0.25 5 0.22 ± 0.09 56.1 0.29 0.19 ± 0.02 70.1 ± 10.8 0.25 ± 0.03 3-week bleomycin rats 1 0.17 ± 0.07 84.1 0.21 2 0.18 ± 0.06 84.2 0.21 3 0.11 ± 0.05 97.4 0.14 4 0.09 ± 0.06 97.5 0.11 5 0.16 ± 0.06 84.7 0.21 6 0.16 ± 0.07 86.6 0.20 0.14 ± 0.04 89.1 ± 6.5 0.18 ± 0.04
Get Radiology Tree app to read full this article<
Heterogeneity Analysis
Get Radiology Tree app to read full this article<
Get Radiology Tree app to read full this article<
Get Radiology Tree app to read full this article<
Get Radiology Tree app to read full this article<
Get Radiology Tree app to read full this article<
Discussion
Get Radiology Tree app to read full this article<
Get Radiology Tree app to read full this article<
Get Radiology Tree app to read full this article<
Get Radiology Tree app to read full this article<
Get Radiology Tree app to read full this article<
Get Radiology Tree app to read full this article<
Conclusions
Get Radiology Tree app to read full this article<
Get Radiology Tree app to read full this article<
References
1. Coultas D.B., Zumwalt R.E., Black W.C., Sobonya R.E.: The epidemiology of interstitial lung diseases. Am J Respir Crit Care Med 1994; 150: pp. 967-972.
2. Raghu G., Brown K.K., Bradford W.Z., et. al., Idiopathic Pulmonary Fibrosis Study Group: A placebo-controlled trial of interferon gamma-1b in patients with idiopathic pulmonary fibrosis. N Engl J Med 2004; 350: pp. 125-133.
3. Azuma A., Nukiwa T., Tsuboi E., et. al.: Placebo-controlled trial of pirfenidone in patients with idiopathic pulmonary fibrosis. Am J Respir Crit Care Med 2005; 171: pp. 1040-1047.
4. King T.E., Behr J., Brown K.K., et. al.: BUILD-1: a randomized placebo-controlled trial of bosentan in idiopathic pulmonary fibrosis. Am J Respir Crit Care Med 2008; 177: pp. 75-81.
5. Visscher D.W., Myers J.L.: Histologic spectrum of idiopathic interstitial pneumonias. Proc Am Thorac Soc 2006; 3: pp. 322-329.
6. Selman M., King T.E.J., Pardo A.: Idiopathic pulmonary fibrosis: prevailing and evolving hypotheses about its pathogenesis and implications for therapy. Ann Intern Med 2001; 134: pp. 136-151.
7. Martinez F.J., Safrin S., Weycker D., et. al., IPF Study Group: The clinical course of patients with idiopathic pulmonary fibrosis. Ann Intern Med 2005; 142: pp. 963-967.
8. Eaton T., Young P., Milne D., Wells A.U.: Six-minute walk, maximal exercise tests. reproducibility in fibrotic interstitial pneumonia. Am J Respir Crit Care Med 2005; 171: pp. 1150-1157.
9. Mugler J.P., Wang C., Miller G.W., et. al.: Helium-3 diffusion MR imaging of the human lung over multiple time scales. Acad Radiol 2008; 15: pp. 693-701.
10. Parraga G., Mathew L., Etemad-Rezai R., McCormack D.G., Santyr G.E.: Hyperpolarized 3He magnetic resonance imaging of ventilation defects in healthy elderly volunteers: initial findings at 3.0 Tesla. Acad Radiol 2008; 15: pp. 776-785.
11. Fain S.B., Korosec F.R., Holmes J.H., O’Halloran R., Sorkness R.L., Grist T.M.: Functional lung imaging using hyperpolarized gas MRI. J Magn Reson Imaging 2007; 25: pp. 910-923.
12. Rizi R.R., Baumgardner J.E., Ishii M., et. al.: Determination of regional V A /Q by hyperpolarized 3 He MRI. Magn Reson Med 2004; 52: pp. 65-72.
13. Conradi M.S., Yablonskiy D.A., Woods J.C., et. al.: The role of collateral paths in long-range diffusion of 3He in lungs. Acad Radiol 2008; 15: pp. 675-682.
14. Mathew L., Evans A., Ouriadov A., et. al.: Hyperpolarized 3He magnetic resonance imaging of chronic obstructive pulmonary disease: reproducibility at 3.0 tesla. Acad Radiol 2008; 15: pp. 1298-1311.
15. Yu J., Rajaei S., Ishii M., et. al.: Measurement of pulmonary partial pressure of oxygen and oxygen depletion rate with hyperpolarized helium-3 MRI: a preliminary reproducibility study on pig model. Acad Radiol 2008; 15: pp. 702-712.
16. Yablonskly D.A., Sukstanskii A.L., Woods J.C., et. al.: Quantification of lung microstructure with hyperpolarized 3He diffusion MRI. J Appl Physiol 2009; 107: pp. 1258-1265.
17. Deninger A.J., Månsson S., Petersson J.S., et. al.: Quantitative measurement of regional lung ventilation using 3 He MRI. Magn Reson Med 2002; 48: pp. 223-232.
18. Fain S.B., Gonzalez-Fernandez G., Peterson E.T., et. al.: Evaluation of structure-function relationships in asthma using multidetector CT and hyperpolarized He-3 MRI. Acad Radiol 2008; 15: pp. 753-762.
19. Walker T.G., Happer W.: Spin-exchange optical pumping of noble-gas nuclei. Rev Mod Phys 1997; 69: pp. 629-642.
20. Emami K., Kadlecek S.J., Woodburn J.M., et. al.: Improved technique for measurement of regional fractional ventilation by hyperpolarized 3He MRI. Magn Reson Med 2010; 63: pp. 137-150.
21. Saam B., Happer W., Middleton H.: Nuclear relaxation of 3 He in the presence of O 2 . Phys Rev A 1995; 52: pp. 862-865.
22. Emami K, Kadlecek S, Pickup S, et al. An improved technique for measurement of gas diffusion anisotropy in lung. Available at: http://crater.imaging.robarts.ca/wiki/images/1/1c/02786.pdf . Accessed August 2, 2010.
23. Neeman M., Freyer J.P., Sillerud L.O.: A simple method for obtaining cross-term-free images for diffusion anisotropy studies in NMR microimaging. Magn Reson Med 1991; 21: pp. 138-143.
24. Massaro G.D., Massaro D.: Retinoic acid treatment abrogates elastase-induced pulmonary emphysema in rats. Nat Med 1997; 3: pp. 675-677.
25. Churg A., Hobson J., Wright J.: Functional and morphologic comparison of silica- and elastase-induced airflow obstruction. Exp Lung Res 1989; 15: pp. 813-822.
26. Moeller A., Ask K., Warburton D., Gauldie J., Kolb M.: The bleomycin animal model: a useful tool to investigate treatment options for idiopathic pulmonary fibrosis?. Int J Biochem Cell Biol 2008; 40: pp. 362-382.
27. Noble P.W., Homer R.J.: Back to the future: historical perspective on the pathogenesis of idiopathic pulmonary fibrosis. Am J Respir Cell Mol Biol 2005; 33: pp. 113-120.
28. Aono Y., Nishioka Y., Inayama M., et. al.: Imatinib as a novel antifibrotic agent in bleomycin-induced pulmonary fibrosis in mice. Am J Respir Crit Care Med 2005; 171: pp. 1279-1285.
29. Park S.H., Saleh D., Giaid A., Michel R.P.: Increased endothelin-1 in bleomycin-induced pulmonary fibrosis and the effect of an endothelin receptor antagonist. Am J Respir Crit Care Med 1997; 156: pp. 600-608.
30. Günther A., Lübke N., Ermert M., et. al.: Prevention of bleomycin-induced lung fibrosis by aerosolization of heparin or urokinase in rabbits. Am J Respir Crit Care Med 2003; 168: pp. 1358-1365.
31. Pinart M., Serrano-Mollar A., Llatjós R., Rocco P.R., Romero P.V.: Single and repeated bleomycin intratracheal instillations lead to different biomechanical changes in lung tissue. Respir Physiol Neurobiol 2009; 166: pp. 41-46.
32. Fain S.B., Panth S.R., Evans M.D., et. al.: Early emphysematous changes in asymptomatic smokers: detection with 3He MR imaging. Radiology 2006; 239: pp. 875-883.
33. Yu J., Law M., Kadlecek S., et. al.: Simultaneous measurement of pulmonary partial pressure of oxygen and apparent diffusion coefficient by hyperpolarized 3He MRI. Magn Reson Med 2009; 61: pp. 1015-1021.
34. Haczku A., Emami K., Fischer M.C., et. al.: Hyperpolarized 3He MRI in asthma measurements of regional ventilation following allergic sensitization and challenge in mice—preliminary results. Acad Radiol 2005; 12: pp. 1362-1370.
35. Mata J.F., Altes T.A., Cai J., et. al.: Evaluation of emphysema severity and progression in a rabbit model: comparison of hyperpolarized 3He and 129Xe diffusion MRI with lung morphometry. J Appl Physiol 2007; 102: pp. 1273-1280.
36. Demedts M., Behr J., Buhl R., et. al., IFIGENIA Study Group: High dose acetylcysteine in idiopathic pulmonary fibrosis. N Engl J Med 2005; 353: pp. 2229-2242.