
Rationale and Objectives
The purpose of this study was to evaluate the correlations between objective quantitative computed tomography (CT) measurements of the extent of emphysematous and fibrotic lesions and the results of pulmonary function tests (PFTs) in patients with combined pulmonary fibrosis and emphysema (CPFE).
Materials and Methods
This study involved 43 CPFE patients who underwent CT and PFTs. The extent of emphysematous lesions was obtained by calculating the percentage of low attenuation area (%LAA) values lower than −950 Hounsfield units (HU). Fibrotic lesions were defined as high attenuation area (HAA) using thresholds with pixels between 0 and −700 HU, and the extent of fibrosis was obtained by calculating the percentage of HAA (%HAA). The correlations of %LAA and %HAA with PFTs were evaluated by the Spearman rank correlation coefficients and multiple linear regression analysis.
Results
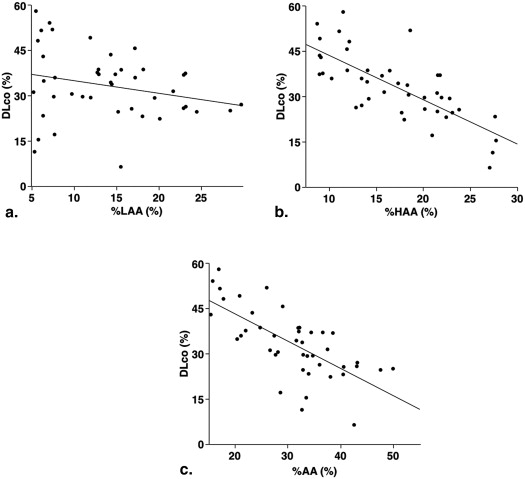
A significant negative correlation was found between %HAA and diffusing capacity of the lung for carbon monoxide (DLco) %predicted (ρ = −0.747; P < .001), whereas no significant correlation was found between %LAA and DLco %predicted. On multiple linear regression analysis, although the %HAA and %LAA were independent contributors to DLco %predicted, the predictive power of %HAA was superior to that of %LAA.
Conclusions
In CPFE, the extent of fibrosis has a more significant impact on DLco than emphysema.
Combined pulmonary fibrosis and emphysema (CPFE) has been recognized as a relatively new disease entity that is characterized by emphysema in the upper lobes and interstitial fibrosis in the lower lobes . However, the emphysema and interstitial fibrosis are not simply superimposed; several physiological and clinical differences have been confirmed in CPFE as compared to emphysema alone or interstitial fibrosis alone. Pulmonary function in patients with CPFE is characterized by mild airflow limitation and mild lung hyperinflation , but the decline in diffusing capacity of the lung for carbon monoxide (DLco) was more severe in patients with CPFE than in patients with emphysema alone or idiopathic pulmonary fibrosis (IPF) alone .
There have been a few reports about the correlations between morphologic imaging findings and pulmonary function in CPFE patients , but those previous investigations were conducted using subjective visual evaluation. Objective quantitative evaluations are essential for reproducibility and for multicenter studies. Therefore, objective quantitative computed tomography (CT) measurements should be adopted for the evaluation of the extent of emphysema and fibrosis in patients with CPFE. Understanding the relationships between morphologic findings and the decline in pulmonary function including DLco may contribute to the clarification of the pathophysiology of CPFE. Thus, the main goal of this study was to evaluate the correlations between the results of pulmonary function tests (PFTs) including DLco and the extent of emphysematous and fibrotic lesions using objective quantitative CT measurements.
Materials and methods
Subjects and Diagnostic Criteria for CPFE
Get Radiology Tree app to read full this article<
Get Radiology Tree app to read full this article<
Get Radiology Tree app to read full this article<
Get Radiology Tree app to read full this article<
CT Scanning
Get Radiology Tree app to read full this article<
Quantitative CT Evaluations
Get Radiology Tree app to read full this article<
Get Radiology Tree app to read full this article<
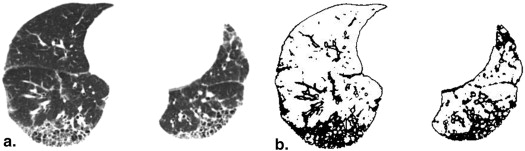
Get Radiology Tree app to read full this article<
Correlations between Quantitative CT Measurements and Honeycombing Lesions
Get Radiology Tree app to read full this article<
Pulmonary Function Tests
Get Radiology Tree app to read full this article<
Statistical Analysis
Get Radiology Tree app to read full this article<
Results
Get Radiology Tree app to read full this article<
Table 1
Patients’ Characteristics, Pulmonary Function, and CT Measurements
Age (years) 69 ± 7 Male/female 37/6 BMI (kg/m 2 ) 22.5 ± 2.6 Pack years 57.5 ± 31.3 Smoker (current/ever/never) 11/32/0 FVC %predicted (%) 88.9 ± 18.4 FEV 1 %predicted (%) 89.1 ± 20.8 FEV 1 /FVC (%) 74.9 ± 10.5 FRC %predicted (%) 82.2 ± 20.2 RV %predicted (%) 72.3 ± 25.0 TLC %predicted (%) 85.6 ± 18.4 DLco %predicted (%) 33.2 ± 11.2 %LAA (%) 13.9 ± 6.9 %HAA (%) 17.0 ± 5.7 %AA (%) 31.0 ± 8.7
%AA, percentage of abnormal area; BMI, body mass index; CT, computed tomography; DLco, diffusing capacity of the lung for carbon monoxide; FEV 1 , forced expiratory volume in 1 second; FRC, functional residual capacity; FVC, forced vital capacity; %HAA, percentage of high attenuation area; %LAA, percentage of low attenuation area; RV, residual volume; TLC, total lung capacity.
Get Radiology Tree app to read full this article<
Get Radiology Tree app to read full this article<
Table 2
Correlations between the CT Measurements and Pulmonary Functions
%LAA %HAA %AA_ρ__P_ Value_ρ__P_ Value_ρ__P_ Value FVC %predicted 0.216 .165 −0.635 <.0001 −0.267 .084 FEV 1 %predicted 0.389 .01 −0.261 .091 0.088 .576 FEV 1 /FVC −0.107 .493 0.452 .002 0.211 .174 FRC %predicted 0.102 .517 −0.688 <.0001 −0.346 .023 RV %predicted −0.123 .433 −0.624 <.0001 −0.473 .001 TLC %predicted 0.178 .255 −0.695 <.0001 −0.302 .049 DLco %predicted −0.250 .106 −0.747 <.0001 −0.710 <.0001
%AA, percentage of abnormal area; CT, computed tomography; DLco, diffusing capacity of the lung for carbon monoxide; FEV 1 , forced expiratory volume in 1 second; FRC, functional residual capacity; FVC, forced vital capacity; %HAA, percentage of high attenuation area; %LAA, percentage of low attenuation area; RV, residual volume; TLC, total lung capacity.
Get Radiology Tree app to read full this article<
Get Radiology Tree app to read full this article<
Table 3
Independent Contributions of %LAA and %HAA
Variable Covariables Partial Regression Coefficient_P_ Value DLco %predicted %LAA −0.291 .004 %HAA −0.762 <.0001 FVC %predicted %LAA 0.218 .068 %HAA −0.632 <.0001 FEV 1 %predicted %LAA 0.286 .049 %HAA −0.332 .024 FEV 1 /FVC %LAA −0.042 .768 %HAA 0.442 .003 FRC %predicted %LAA −0.036 .759 %HAA −0.682 <.0001 RV %predicted %LAA −0.165 .195 %HAA −0.601 <.0001 TLC %predicted %LAA 0.085 .446 %HAA −0.705 <.0001
DLco, diffusing capacity of the lung for carbon monoxide; FEV 1 , forced expiratory volume in 1 second; FRC, functional residual capacity; FVC, forced vital capacity; %HAA, percentage of high attenuation area; %LAA, percentage of low attenuation area; RV, residual volume; TLC, total lung capacity.
Get Radiology Tree app to read full this article<
Get Radiology Tree app to read full this article<
Discussion
Get Radiology Tree app to read full this article<
Get Radiology Tree app to read full this article<
Get Radiology Tree app to read full this article<
Get Radiology Tree app to read full this article<
Get Radiology Tree app to read full this article<
Get Radiology Tree app to read full this article<
Get Radiology Tree app to read full this article<
Get Radiology Tree app to read full this article<
References
1. Cottin V., Nunes H., Brillet P.Y., et. al.: Combined pulmonary fibrosis and emphysema: a distinct underrecognised entity. Eur Respir J 2005; 26: pp. 586-593.
2. Kitaguchi Y., Fujimoto K., Hanaoka M., et. al.: Clinical characteristics of combined pulmonary fibrosis and emphysema. Respirology 2010; 15: pp. 265-271.
3. Grubstein A., Bendayan D., Schactman I., et. al.: Concomitant upper-lobe bullous emphysema, lower-lobe interstitial fibrosis and pulmonary hypertension in heavy smokers: report of eight cases and review of the literature. Respir Med 2005; 99: pp. 948-954.
4. Jankowich M.D., Polsky M., Klein M., et. al.: Heterogeneity in combined pulmonary fibrosis and emphysema. Respiration 2008; 75: pp. 411-417.
5. Mejía M., Carrillo G., Rojas-Serrano J., et. al.: Idiopathic pulmonary fibrosis and emphysema: decreased survival associated with severe pulmonary arterial hypertension. Chest 2009; 136: pp. 10-15.
6. Mura M., Zompatori M., Pacilli A.M., et. al.: The presence of emphysema further impairs physiologic function in patients with idiopathic pulmonary fibrosis. Respir Care 2006; 51: pp. 257-265.
7. Ando K., Sekiya M., Tobino K., et. al.: Relationship between quantitative CT metrics and pulmonary function in combined pulmonary fibrosis and emphysema. Lung 2013; 191: pp. 585-591.
8. Raghu G., Collard H.R., Egan J.J., et. al.: An official ATS/ERS/JRS/ALAT statement: idiopathic pulmonary fibrosis: evidence-based guidelines for diagnosis and management. Am J Respir Crit Care Med 2011; 183: pp. 788-824.
9. Shin K.E., Chung M.J., Jung M.P., et. al.: Quantitative computed tomographic indexes in diffuse interstitial lung disease: correlation with physiologic tests and computed tomography visual scores. J Comput Assist Tomogr 2011; 35: pp. 266-271.
10. Strickland N.H., Hughes J.M., Hart D.A., et. al.: Cause of regional ventilation-perfusion mismatching in patients with idiopathic pulmonary fibrosis: a combined CT and scintigraphic study. AJR Am J Roentgenol 1993; 161: pp. 719-725.
11. Schwartz D.A., Merchant R.K., Helmers R.A., et. al.: The influence of cigarette smoking on lung function in patients with idiopathic pulmonary fibrosis. Am Rev Respir Dis 1991; 144: pp. 504-506.
12. Gevenois P.A., De Vuyst P., de Maertelaer V., et. al.: Comparison of computed density and microscopic morphometry in pulmonary emphysema. Am J Respir Crit Care Med 1996; 154: pp. 187-192.
13. Kinsella M., Muller N.L., Abboud R.T., et. al.: Quantitation of emphysema by computed tomography using a “density mask” program and correlation with pulmonary function tests. Chest 1990; 97: pp. 315-321.
14. Best A.C., Meng J., Lynch A.M., et. al.: Idiopathic pulmonary fibrosis: physiologic tests, quantitative CT indexes, and CT visual scores as predictors of mortality. Radiology 2008; 246: pp. 935-940.