
Rationale and Objectives
To diagnose hepatic steatosis with noninvasive magnetic resonance (MR)–based measurements, threshold values of liver fat percentages are used. However, these differ between studies. Consequently, the choice of threshold values influences diagnostic accuracy, especially in subjects with borderline hepatic steatosis. In this study, we compared 1 H-MR spectroscopy (MRS) and biochemically determined liver fat content in mice with moderately elevated fat content and studied the diagnostic accuracy of 1 H-MRS using two literature-based threshold values.
Materials and Methods
Fifty mice were divided into three groups: 21 C57Bl/6OlaHSD (B6) mice on a high-fat diet, 20 B6 mice on a control diet, and 9 LDLr−/− mice on a high-fat high-cholesterol diet. 1 H-MRS was performed using multi-echo STEAM at 3T to derive a fat mass fraction ( 1 H-MRS fat content). Biochemical fat content was determined from liver homogenates. Correlation and agreement were assessed with the Pearson correlation coefficient and the Bland–Altman analysis and diagnostic accuracy by calculating sensitivity, specificity, and positive and negative predictive values.
Results
All mice were pooled to form a single cohort. Mean (±standard deviation) biochemical fat content was 32.2 (±13.9) mg/g. Mean 1 H-MRS fat content did not differ at 30.2 (±12.0) mg/g ( P = .13). Correlation r was 0.74 ( P < .0001). Bland–Altman analysis indicated that 1 H-MRS fat content underestimated biochemical fat content by 2.1 mg/g. The diagnostic accuracy of 1 H-MRS depended to a great extent on the chosen reference threshold value.
Conclusions
1 H-MRS measurement of moderately elevated liver fat content in mice correlated substantially with biochemical fat content measurement. Contrary to earlier studies, diagnostic accuracy of 1 H-MRS fat content in borderline liver fat content appears limited.
With the global obesity epidemic reaching epic proportions, the number of people with fatty change of the liver—also referred to as hepatic steatosis or non-alcoholic fatty liver disease (NAFLD)—will rise too . In clinical practice, staging of steatosis on liver biopsy is the reference standard for assessing the amount of liver fat. However, this invasive method is rapidly being overtaken by other noninvasive reproducible measures that include ultrasound, computed tomography (CT), magnetic resonance imaging (MRI), and 1 H-MRS .
Magnetic resonance (MR)–derived measurements of liver fat are usually expressed as ratios between fat and water signal values. However, current threshold values based on MRI and 1 H-MRS for diagnosing “steatosis” differ between studies, field strengths, and populations targeted. For example, the widely used threshold of 5.6% first described by Szczepaniak et al. was found by defining the 95th percentile as threshold value for normal versus elevated in a healthy subgroup ( n = 345) of a large cohort. In that study, no histologic or biochemical reference standard was used to define steatosis, and the authors refer to an earlier publication by Hoyumpa et al. stating that the normal liver contains <5.0% w/w fat. In turn, however, those authors do not refer to other studies to back up this statement. The few studies that have investigated biochemical composition of liver tissue give considerably lower values for normal liver fat content ranging from 0.6% to 1.94% w/w . Even so, the 5.6% threshold value has become a much reported reference value. In a recent study by Tang et al. —which compared the MRI-based proton density fat fraction (PDFF) with biopsy-determined steatosis levels—a 6.4% PDFF threshold was found to optimally distinguish between grade 0 and grade 1 or higher on liver biopsy. The PDFF is the MR signal fat fraction corrected for T 1 and T 2 bias with, at this threshold value, sensitivity and specificity of 96% and 100%. It is important to note that although 1 H-MRS and PDFF measure signal ratios—which correspond nearly one-on-one with volume ratios—these are different metrics than the 5% of hepatocytes-containing fat vacuoles on histology.
Get Radiology Tree app to read full this article<
Get Radiology Tree app to read full this article<
Get Radiology Tree app to read full this article<
Methods
Ethical Considerations
Get Radiology Tree app to read full this article<
Mice
Get Radiology Tree app to read full this article<
![Figure 1, Flowchart of mice in different diet groups. Mice in group A (C57Bl6 on a high-fat diet) and group B (C57Bl6 on a control diet) were kept on diets for 4, 8, and 12 weeks. Mice in group C (LDLr−/− on a high-fat high-cholesterol [HFHC] diet) were kept on a diet for 4 and 8 weeks. Separate mice were used for each diet period.](https://storage.googleapis.com/dl.dentistrykey.com/clinical/QuantitativeDeterminationofLiverTriglycerideLevelswith3T1HMRSpectroscopyinMicewithModeratelyElevatedLiverFatContent/0_1s20S1076633214002384.jpg)
Get Radiology Tree app to read full this article<
Magnetic Resonance Imaging
Get Radiology Tree app to read full this article<
1 H-MR Spectroscopy
Get Radiology Tree app to read full this article<
1 H-MRS Data Analysis
Get Radiology Tree app to read full this article<
S(TE)=S(0)×e(−TET2) S
(
TE
)
=
S
(
0
)
×
e
(
−
TE
T
2
)
Get Radiology Tree app to read full this article<
Get Radiology Tree app to read full this article<
Get Radiology Tree app to read full this article<
Get Radiology Tree app to read full this article<
Fatsignalfraction(FSF)=SFATSFAT+SWATER Fat
signal
fraction
(
FSF
)
=
S
FAT
S
FAT
+
S
WATER
Get Radiology Tree app to read full this article<
Get Radiology Tree app to read full this article<
Fatmassratio(ηm)=SFAT×MWfλf(SFAT×MWfλf+SWATER×MWwλw) Fat
mass
ratio
(
η
m
)
=
S
FAT
×
M
W
f
λ
f
(
S
FAT
×
M
W
f
λ
f
+
S
WATER
×
M
W
w
λ
w
)
Get Radiology Tree app to read full this article<
Get Radiology Tree app to read full this article<
Biochemical Liver Analysis
Get Radiology Tree app to read full this article<
Get Radiology Tree app to read full this article<
Statistical Analyses
Get Radiology Tree app to read full this article<
Results
Biochemical Liver Analysis
Get Radiology Tree app to read full this article<
Table 1
Biochemical Fat Content of Diet Groups per Week in Milligrams per Gram
Weeks Control High Fat High Fat High Cholesterol Four 42.2 (11.7); n = 4 29.4 (5.2); n = 4 14.6 (3.7); n = 4 Eight 29.6 (4.9); n = 4 53.9 (15.5); n = 4 30.2 (5.2); n = 5 Twelve 25.5 (10.9); n = 12 36.6 (13.9); n = 13 —
The values are represented as the mean (standard deviation) biochemical fat content divided per diet group (columns) and per diet duration (rows).
Get Radiology Tree app to read full this article<
1 H-MR Spectroscopy
Get Radiology Tree app to read full this article<
Get Radiology Tree app to read full this article<
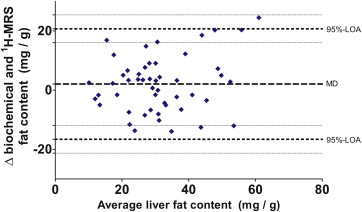
Agreement Between Biochemical and 1 H-MRS Fat Content
Get Radiology Tree app to read full this article<
![Figure 4, Scatter plot between biochemical and 1 H-MRS fat content. This scatter plot shows the biochemical fat content as a reference on the x -axis with the 1 H-MRS fat content on the y -axis. The Pearson correlation coefficient was 0.74 ( P < .0001). The line of the best fit is shown as the black line , whereas the line of identity is given by the striped line . The line of the best fit had a slope of 0.636 (95% confidence interval [CI], 0.467–0.805) and an intercept of 9.66 (95% CI, 3.75–15.56).](https://storage.googleapis.com/dl.dentistrykey.com/clinical/QuantitativeDeterminationofLiverTriglycerideLevelswith3T1HMRSpectroscopyinMicewithModeratelyElevatedLiverFatContent/3_1s20S1076633214002384.jpg)
Get Radiology Tree app to read full this article<
Diagnostic Accuracy of 1 H-MRS Fat Content
Get Radiology Tree app to read full this article<
Table 2
Diagnostic Accuracy of 1 H-MRS Fat Content at Two Threshold Values
Threshold Value 50 mg/g 19.4 mg/g Steatosis prevalence 7/50 (14%) 41/50 (82%) Sensitivity (%) 14 (0–58) 90 (77–97) Specificity (%) 98 (87–100) 67 (30–93) PPV (%) 50 (3–97) 92.5 (78–98) NPV (%) 87.5 (74–95) 60 (14–73)
The table gives the prevalence of steatosis (defined as biochemical fat content > threshold value). In addition, sensitivity, specificity, positive predictive value (PPV), and negative predictive value (NPV) of 1 H-MRS fat content at two different threshold values of 50 mg/g and 19.4 mg/g are noted. 95% Confidence intervals are given in parentheses for all parameters except prevalence.
Get Radiology Tree app to read full this article<
Discussion
Get Radiology Tree app to read full this article<
Get Radiology Tree app to read full this article<
Get Radiology Tree app to read full this article<
Get Radiology Tree app to read full this article<
Get Radiology Tree app to read full this article<
Get Radiology Tree app to read full this article<
Get Radiology Tree app to read full this article<
Get Radiology Tree app to read full this article<
Get Radiology Tree app to read full this article<
Get Radiology Tree app to read full this article<
Get Radiology Tree app to read full this article<
Get Radiology Tree app to read full this article<
Get Radiology Tree app to read full this article<
Get Radiology Tree app to read full this article<
Conclusions and Implications
Get Radiology Tree app to read full this article<
Acknowledgments
Get Radiology Tree app to read full this article<
Supplementary Data
Get Radiology Tree app to read full this article<
Supplementary Material 1
Get Radiology Tree app to read full this article<
References
1. Torres D.M., Williams C.D., Harrison S.A.: Features, diagnosis, and treatment of nonalcoholic fatty liver disease. Clin Gastroenterol Hepatol 2012; 10: pp. 837-858.
2. Reeder S.B., Cruite I., Hamilton G., et. al.: Quantitative assessment of liver fat with magnetic resonance imaging and spectroscopy. J Magn Reson Imaging 2011; 34: pp. 729-749.
3. van Werven J.R., Marsman H.A., Nederveen A.J., et. al.: Assessment of hepatic steatosis in patients undergoing liver resection: comparison of US, CT, T1-weighted dual-echo MR imaging, and point-resolved 1H MR spectroscopy. Radiology 2010; 256: pp. 159-168.
4. Szczepaniak L.S., Nurenberg P., Leonard D., et. al.: Magnetic resonance spectroscopy to measure hepatic triglyceride content: prevalence of hepatic steatosis in the general population. Am J Physiol Endocrinol Metab 2005; 288: pp. E462-E468.
5. Hoyumpa A.M., Greene H.L., Dunn G.D., et. al.: Fatty liver: biochemical and clinical considerations. Am J Dig Dis 1975; 20: pp. 1142-1170.
6. Cairns S.R., Peters T.J.: Isolation of micro- and macro-droplet fractions from needle biopsy specimens of human liver and determination of the subcellular distribution of the accumulating liver lipids in alcoholic fatty liver. Clin Sci (Lond) 1984; 67: pp. 337-345.
7. Kwiterovich P.O., Sloan H.R., Fredrickson D.S.: Glycolipids and other lipid constituents of normal human liver. J Lipid Res 1970; 11: pp. 322-330.
8. Tang A., Tan J., Sun M., et. al.: Nonalcoholic fatty liver disease: MR imaging of liver proton density fat fraction to assess hepatic steatosis. Radiology 2013; 267: pp. 422-431.
9. van Werven J.R., Schreuder T.C., Aarts E.O., et. al.: Hepatic steatosis in morbidly obese patients undergoing gastric bypass surgery: assessment with open-system 1H-MR spectroscopy. AJR Am J Roentgenol 2011; 196: pp. W736-W742.
10. Hines C.D., Yu H., Shimakawa A., et. al.: Quantification of hepatic steatosis with 3-T MR imaging: validation in ob/ob mice. Radiology 2010; 254: pp. 119-128.
11. Yokoo T., Shiehmorteza M., Hamilton G., et. al.: Estimation of hepatic proton-density fat fraction by using MR imaging at 3.0 T. Radiology 2011; 258: pp. 749-759.
12. Permutt Z., Le T.A., Peterson M.R., et. al.: Correlation between liver histology and novel magnetic resonance imaging in adult patients with non-alcoholic fatty liver disease—MRI accurately quantifies hepatic steatosis in NAFLD. Aliment Pharmacol Ther 2012; 36: pp. 22-29.
13. Dyson J.K., McPherson S., Anstee Q.M.: Non-alcoholic fatty liver disease: non-invasive investigation and risk stratification. J Clin Pathol 2013; 66: pp. 1033-1045.
14. Runge J.H., Bakker P.J., Gaemers I.C., et. al.: Measuring liver triglyceride content in mice: non-invasive magnetic resonance methods as an alternative to histopathology.. Magn Reson Mater Phy 2014; 27: pp. 317-327.
15. De Graaf R.A.: Single volume localization and water suppression. In vivo NMR spectroscopy : principles and techniques.2007.John Wiley & SonsChichester, West Sussex, Englandpp. 297-348.
16. Naressi A., Couturier C., Devos J.M., et. al.: Java-based graphical user interface for the MRUI quantitation package. Magn Reson Mater Phy 2001; 12: pp. 141-152.
17. Longo R., Pollesello P., Ricci C., et. al.: Proton MR spectroscopy in quantitative in vivo determination of fat content in human liver steatosis. J Magn Reson Imaging 1995; 5: pp. 281-285.
18. Reeder SB, Hines CD, Yu H, et al. Relationship between proton-density fat-fraction and true fat concentration for in vivo fat quantification with magnetic resonance imaging. Proceedings of the 19th Annual Meeting ISMRM, Montréal, Canada, 2011:805.
19. Hamilton G., Yokoo T., Bydder M., et. al.: In vivo characterization of the liver fat (1)H MR spectrum. NMR Biomed 2011; 24: pp. 784-790.
20. Reeder SB, Hines CD, Yu H, et al. On the definition of fat-fraction for in vivo fat quantification with magnetic resonance imaging. Proceedings of the 17th Annual Meeting ISMRM, Honolulu, USA, 2009:211.
21. Kumar Srivastava N., Pradhan S., Mittal B., et. al.: An improved, single step standardized method of lipid extraction from human skeletal muscle tissue. Analytical Letters 2006; 39: pp. 297-315.
22. Landis J.R., Koch G.G.: The measurement of observer agreement for categorical data. Biometrics 1977; 33: pp. 159-174.
23. Bohte A.E., van Werven J.R., Bipat S., et. al.: The diagnostic accuracy of US, CT, MRI and 1H-MRS for the evaluation of hepatic steatosis compared with liver biopsy: a meta-analysis. Eur Radiol 2011; 21: pp. 87-97.
24. Orlacchio A., Bolacchi F., Cadioli M., et. al.: Evaluation of the severity of chronic hepatitis C with 3-T1H-MR spectroscopy. AJR Am J Roentgenol 2008; 190: pp. 1331-1339.
25. Krssak M., Hofer H., Wrba F., et. al.: Non-invasive assessment of hepatic fat accumulation in chronic hepatitis C by 1H magnetic resonance spectroscopy. Eur J Radiol 2010; 74: pp. e60-e66.
26. d’Assignies G., Ruel M., Khiat A., et. al.: Noninvasive quantitation of human liver steatosis using magnetic resonance and bioassay methods. Eur Radiol 2009; 19: pp. 2033-2040.
27. Capitan V., Petit J.M., Aho S., et. al.: Macroscopic heterogeneity of liver fat: an MR-based study in type-2 diabetic patients. Eur Radiol 2012; 22: pp. 2161-2168.
28. Idilman I.S., Aniktar H., Idilman R., et. al.: Hepatic steatosis: quantification by proton density fat fraction with MR imaging versus liver biopsy. Radiology 2013; 267: pp. 767-775.
29. Brunt E.M.: Pathology of nonalcoholic fatty liver disease. Nat Rev Gastroenterol Hepatol 2010; 7: pp. 195-203.