
Rationale and Objectives
The study of vascular targeted cancer therapies is critically dependent on the development of noninvasive methods for assessing changes in vascular permeability and blood flow in small-animal tumor models.
Materials and Methods
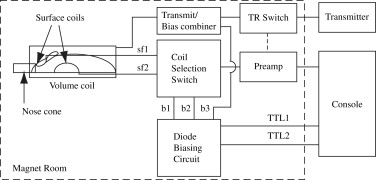
A multicoil apparatus consisting of two receive-only surface coils for observation of the rat brain and chest, a whole-body transmit-only volume coil, and the switching circuitry necessary for sharing a single receiver channel between the two surface coils was constructed for the parallel observation of left ventricular arterial input function and magnetic resonance imaging (MRI) signal intensity kinetics in the rat brain. Dynamic contrast-enhanced MRI was performed on four Fischer rats bearing intracranial 9L gliomas, and the dynamic data were evaluated using the bolus-enhanced relaxation overview (BOLERO) model yielding maps of K trans , v e , and τ i values from the tumor.
Results
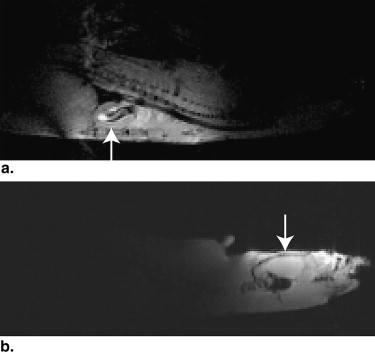
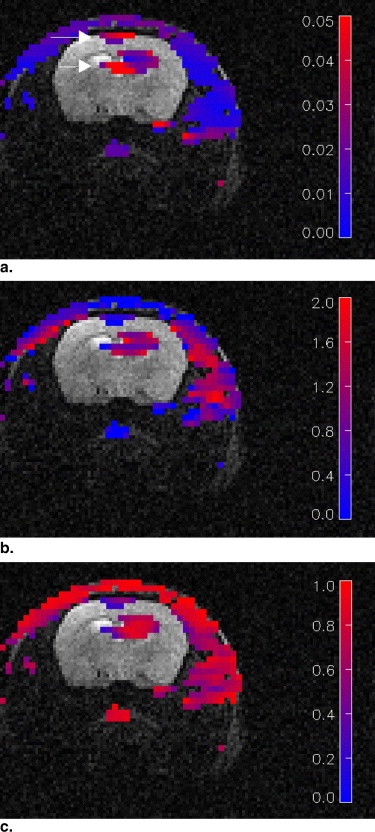
The use of the multicoil apparatus resulted in images with high signal-to-noise ratios from the rat brain and chest in parallel, with no detectable crosstalk between the surface coils. The BOLERO method accurately fit the observed data to within experimental error. Mean values of the parameters generated by the BOLERO analysis for the tumor were K trans = 0.023 ± 0.014 s −1 , τ i = 1.3 ± 0.6 seconds, and v e = 0.51. K trans and τ i values were slightly elevated in the tumor periphery, whereas v e was elevated in the tumor core.
Conclusion
These results demonstrate the feasibility of measuring quantitative dynamic contrast-enhanced MRI parameters in a rat brain tumor model using a multicoil apparatus. These methods might play an important role in determining the efficacy of antiangiogenic therapies in small-animal models.
The ongoing efforts to develop cancer therapies that target tumor vasculature would benefit significantly from the development of noninvasive methods for assessing vascular permeability and changes in blood flow in tumors in small-animal models. Dynamic magnetic resonance imaging (MRI) techniques show promise for providing such information. These methods use rapid imaging techniques, typically a fast gradient-echo protocol, to track a bolus of a paramagnetic contrast agent as it passes through the tissues of interest. The observed changes in signal intensity are then fit to a suitable pharmacokinetic model to yield tissue parameter maps. The precise nature of the information provided by dynamic MRI methods depends in part on the specific imaging protocol used. Dynamic T 1 -weighted imaging, also referred to as dynamic contrast-enhanced (DCE) MRI, provides measures of vascular permeability and extracellular volume fraction. Analysis of DCE MRI data requires an estimate of the relaxivity of the contrast agent and knowledge of the instantaneous concentration of the tracer in the arteries feeding the tissues of interest, known as the arterial input function (AIF). Numerous approaches to determining the AIF have been suggested, including using a fixed model , extracting the AIF from the target-tissue signal intensity data using curve-fitting techniques , extraction of the AIF from the signal evolution in a reference tissue , and direct observation of the AIF in large arteries.
Previous studies have suggested that there are significant intersubject and shot-to-shot variations in the AIF , making techniques that rely on assumptions about its functional form unreliable. In contrast to the other approaches, direct observation of the AIF makes no assumptions about the AIF or the vascular permeability parameters of adjacent tissues and as such is the preferred method. In large animals (such as dogs), the AIF can often be extracted from arterial pixels in the dynamic images . Automated routines for selecting pixels associated with arteries in DCE images have been demonstrated . Estimates of the AIF extracted from the temporal evolution of the signal intensity of the automatically selected arterial pixels have been found to be consistent with expectations.
Get Radiology Tree app to read full this article<
Get Radiology Tree app to read full this article<
Get Radiology Tree app to read full this article<
Get Radiology Tree app to read full this article<
Materials and methods
Get Radiology Tree app to read full this article<
Theory
Get Radiology Tree app to read full this article<
Ct(t)=Ktrans∫0tCp(t′)exp{−kep(t−t′)}dt′, C
t
(
t
)
=
K
trans
∫
0
t
C
p
(
t
′
)
exp
{
−
k
ep
(
t
−
t
′
)
}
d
t
′
,
where C t is the tracer concentration in the tissue, C p is the AIF, k ep is the tissue exchange rate constant, and K trans is the tissue transfer constant, which is given by k ep = K trans / v e , where v e is the extravascular, extracellular volume fraction of water. In dynamic imaging studies, in which the tracer is detected directly, the above relation is sufficient to describe the observed signal changes following bolus administration. However, paramagnetic MRI contrast agents are indirectly detected by their effects on the relaxation rate of the indigenous water. In isotropic solutions, the longitudinal relaxation rate ( R 1 = 1/ T 1 ) in the presence of a paramagnetic contrast agent is given by
R1=R01+r1C, R
1
=
R
1
0
+
r
1
C
,
where R01 R
1
0 is the relaxation rate in the absence of contrast agent, C is the concentration of the agent, and r 1 is a constant for a given agent known as the relaxivity. Water protons must come in close contact with the paramagnetic center of the contrast agent for the water relaxation rate to be affected. Tissues are highly compartmentalized, consisting of intracellular, extravascular extracellular, and intravascular spaces. The contrast agent generally permeates the intravascular and extravascular extracellular spaces but is excluded from the cytoplasm of intact cells. If it is assumed that the exchange rate of mobile water protons between the intracellular and extracellular spaces is fast relative to the difference in relaxation rate between these compartments, the observed relaxation rate is the water volume fraction weighted average of relaxation rates in the two compartments. This condition, referred to as the fast exchange limit (FXL), is commonly assumed in the analysis of DCE MRI data. If it is also assumed that the intracellular and extracellular water relaxation rates are identical in the absence of contrast agent, the observed relaxation rate takes the form
R1=R01+ver1Ct. R
1
=
R
1
0
+
v
e
r
1
C
t
.
This equation may be rearranged to express the tissue contrast agent concentration, C t , in terms of the relaxation rate. Substitution of the resulting expression into Equation 1 yields an expression for the tissue tracer concentration in terms of observable MRI parameters. This method of analysis of DCE data is referred to in this report as the FXL model.
Get Radiology Tree app to read full this article<
Get Radiology Tree app to read full this article<
R∗1=(2R01+r1C+1/τive)−(r1C+1/τive)2−4r1C/τi√2, R
1
∗
=
(
2
R
1
0
+
r
1
C
+
1
/
τ
i
v
e
)
−
(
r
1
C
+
1
/
τ
i
v
e
)
2
−
4
r
1
C
/
τ
i
2
,
where τ i is the mean lifetime of the intracellular water, and the remaining variables have been defined previously. Equation 4 is the main result of the BOLERO method for analyzing DCE data . Note that Equation 4 differs slightly from the previously published BOLERO equation in that the intracellular and extracellular relaxation rates are assumed to be identical in the absence of contrast agent. In analogy to the FXL case, this result may be combined with Equation 1 to yield an expression for the tissue contrast agent concentration in terms of MRI observable parameters.
Get Radiology Tree app to read full this article<
Get Radiology Tree app to read full this article<
R1(t)=1Tsln[S(t)S0(1−exp{−TsR01})−1], R
1
(
t
)
=
1
T
s
ln
[
S
(
t
)
S
0
(
1
−
exp
{
−
T
s
R
1
0
}
)
−
1
]
,
where S 0 is the observed signal intensity in the absence of contrast agent, and T s is the saturation recovery time. Maps of the instantaneous relaxation rate can thus be determined from saturation recovery images if the pre–contrast agent relaxation rate, R01 R
1
0 , and the baseline signal intensity are known.
Get Radiology Tree app to read full this article<
Experimental
Cell Culture and Tumor Inoculation
Get Radiology Tree app to read full this article<
Get Radiology Tree app to read full this article<
MRI Hardware
Get Radiology Tree app to read full this article<
Get Radiology Tree app to read full this article<
Animal Preparation for MRI
Get Radiology Tree app to read full this article<
MRI Protocol
Get Radiology Tree app to read full this article<
Get Radiology Tree app to read full this article<
Get Radiology Tree app to read full this article<
Data Analysis
Get Radiology Tree app to read full this article<
Get Radiology Tree app to read full this article<
Get Radiology Tree app to read full this article<
Get Radiology Tree app to read full this article<
Get Radiology Tree app to read full this article<
Results
Get Radiology Tree app to read full this article<
Get Radiology Tree app to read full this article<
Get Radiology Tree app to read full this article<
Get Radiology Tree app to read full this article<
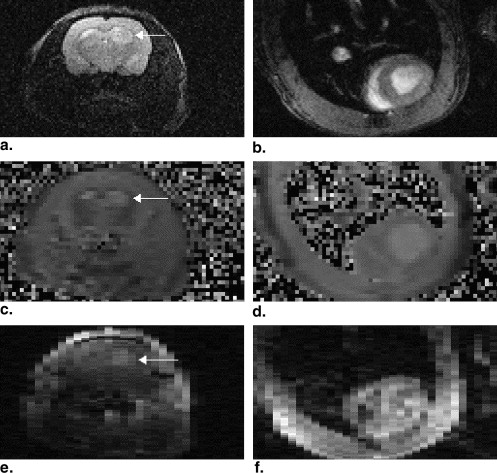
Table 1
Mean Values of Physiological Parameter Estimates Generated in the Dynamic Contrast-enhanced Magnetic Resonance Imaging Study
Animal No.T 1 Gray Matter (seconds)T 1 Blood (seconds)K trans (s −1 ) τ 1 (seconds)v e 1 1.48 ± 0.08 1.67 ± 0.19 0.016 ± 0.010 1.52 ± 0.34 0.57 ± 0.32 2 1.48 ± 0.15 1.69 ± 0.34 0.022 ± 0.011 1.19 ± 0.52 0.46 ± 0.27 3 1.00 ± 0.45 1.73 ± 0.19 0.036 ± 0.021 1.01 ± 0.43 0.51 ± 0.37 4 1.22 ± 0.10 1.66 ± 0.60 0.021 ± 0.013 1.50 ± 0.1 0.51 ± 0.25 Mean 1.30 ± 0.19 1.69 ± 0.33 0.023 ± 0.014 1.30 ± 0.57 0.52 ± 0.30
Get Radiology Tree app to read full this article<
Get Radiology Tree app to read full this article<
Get Radiology Tree app to read full this article<
Get Radiology Tree app to read full this article<
Get Radiology Tree app to read full this article<
Discussion
Get Radiology Tree app to read full this article<
Get Radiology Tree app to read full this article<
Get Radiology Tree app to read full this article<
Get Radiology Tree app to read full this article<
Get Radiology Tree app to read full this article<
Get Radiology Tree app to read full this article<
Conclusion
Get Radiology Tree app to read full this article<
Get Radiology Tree app to read full this article<
Acknowledgments
Get Radiology Tree app to read full this article<
Get Radiology Tree app to read full this article<
References
1. O’Donnell A., Padhani A., Hayes C., et. al.: A phase I study of the angiogenesis inhibitor SU5416 (semaxanib) in solid tumours, incorporating dynamic contrast MR pharmacodynamic end points. Br J Cancer 2005; 93: pp. 876-883.
2. Padhani A.R., Leach M.O.: Antivascular cancer treatments: functional assessments by dynamic contrast-enhanced magnetic resonance imaging. Abdom Imaging 2005; 30: pp. 324-341.
3. Tofts P.S., Kermode A.G.: Measurement of the blood-brain barrier permeability and leakage space using dynamic MR imaging. 1. Fundamental concepts. Magn Reson Med 1991; 17: pp. 357-367.
4. Hoffmann U., Brix G., Knopp M.V., Hess T., Lorenz W.J.: Pharmacokinetic mapping of the breast: a new method for dynamic MR mammography. Magn Reson Med 1995; 33: pp. 506-514.
5. Kovar D.A., Lewis M., Karczmar G.S.: A new method for imaging perfusion and contrast extraction fraction: input functions derived from reference tissues. J Magn Reson Imaging 1998; 8: pp. 1126-1134.
6. Yang C., Karczmar G.S., Medved M., Stadler W.M.: Estimating the arterial input function using two reference tissues in dynamic contrast-enhanced MRI studies: fundamental concepts and simulations. Magn Reson Med 2004; 52: pp. 1110-1117.
7. Yankeelov T.E., Luci J.J., Lepage M., et. al.: Quantitative pharmacokinetic analysis of DCE-MRI data without an arterial input function: a reference region model. Magn Reson Imag 2005; 23: pp. 519-529.
8. Port R.E., Knopp M.V., Brix G.: Dynamic contrast-enhanced MRI using Gd-DTPA: interindividual variability of the arterial input function and consequences for the assessment of kinetics in tumors. Magn Reson Med 2001; 45: pp. 1030-1038.
9. Ludemann L., Hamm B., Zimmer C.: Pharmacokinetic analysis of glioma compartments with dynamic Gd-DTPA-enhanced magnetic resonance imaging. Magn Reson Imag 2000; 18: pp. 1201-1214.
10. Ludemann L., Wurm R., Zimmer C.: Pharmacokinetic modeling of Gd-DTPA extravasation in brain tumors. Invest Radiol 2002; 37: pp. 562-570.
11. Calamante F., Morup M., Hansen L.K.: Defining a local arterial input function for perfusion MRI using independent component analysis. Magn Reson Med 2004; 52: pp. 789-797.
12. Murase K., Kikuchi K., Miki H., Shimizu T., Ikezoe J.: Determination of arterial input function using fuzzy clustering for quantification of cerebral blood flow with dynamic susceptibility contrast-enhanced MR imaging. J Magn Reson Imaging 2001; 13: pp. 797-806.
13. Pickup S., Zhou R., Glickson J.: MRI estimation of the arterial input function in mice. Acad Radiol 2003; 10: pp. 963-968.
14. Zhou R., Pickup S., Yankeelov T.E., Springer C.S., Glickson J.D.: Simultaneous measurement of arterial input function and tumor pharmacokinetics in mice by dynamic contrast enhanced imaging: effects of transcytolemmal water exchange. Magn Reson Med 2004; 52: pp. 248-257.
15. Ivancevic M.K., Zimine I., Montet X., et. al.: Inflow effect correction in fast gradient-echo perfusion imaging. Magn Reson Med 2003; 50: pp. 885-891.
16. Bentzen L., Horsman M.R., Daugaard P., Maxwell R.J.: Non-invasive tumour blood perfusion measurement by 2H magnetic resonance. NMR Biomed 2000; 13: pp. 429-437.
17. Pathak A.P., Artemov D., Bhujwalla Z.M.: Novel system for determining contrast agent concentration in mouse blood in vivo. Magn Reson Med 2004; 51: pp. 612-615.
18. McIntyre D.J., Ludwig C., Pasan A., Griffiths J.R.: A method for interleaved acquisition of a vascular input function for dynamic contrast-enhanced MRI in experimental rat tumours. NMR Biomed 2004; 17: pp. 132-143.
19. Vincensini D., Dedieu V., Renou J.P., Otal P., Joffre F.: Measurements of extracellular volume fraction and capillary permeability in tissues using dynamic spin-lattice relaxometry: studies in rabbit muscles. Magn Reson Imag 2003; 21: pp. 85-93.
20. Yankeelov T.E., Rooney W.D., Li X., Springer C.S.: Variation of the relaxographic “shutter-speed” for transcytolemmal water exchange affects the CR bolus-tracking curve shape. Magn Reson Med 2003; 50: pp. 1151-1169.
21. Donahue K.M., Burstein D., Manning W.J., Gray M.L.: Studies of Gd-DTPA relaxivity and proton exchange rates in tissue. Magn Reson Med 1994; 32: pp. 66-76.
22. Quirk J.D., Bretthorst G.L., Duong T.Q., et. al.: Equilibrium water exchange between the intra- and extracellular spaces of mammalian brain. Magn Reson Med 2003; 50: pp. 493-499.
23. Landis C.S., Li X., Telang F.W., et. al.: Determination of the MRI contrast agent concentration time course in vivo following bolus injection: effect of equilibrium transcytolemmal water exchange. Magn Reson Med 2000; 44: pp. 563-574.
24. Woessner D.E.: Nuclear transfer effects in nuclear magnetic resonance pulse experiments. J Chem Phys 1961; 35: pp. 41-48.
25. Look D.C., Locker D.R.: Time saving in measurement of NMR and EPR relaxation time. Rev Sci Instrum 1970; 41: pp. 250-251.
26. Pickup S., Wood A.K., Kundel H.L.: A novel method for analysis of TOMROP data. J Magn Reson Imaging 2004; 19: pp. 508-512.
27. Pickup S., Wood A.K., Kundel H.L.: Gadodiamide T1 relaxivity in brain tissue in vivo is lower than in saline. Magn Reson Med 2005; 53: pp. 35-40.
28. Herbst M.D., Goldstein J.H.: A review of water diffusion measurement by NMR in human red blood cells. Am J Physiol 1989; 256: pp. C1097-C1104.
29. Hejtmancik M.R., Ryan M.J., Toft J.D., Persing R.L., Kurtz P.J., Chhabra R.S.: Hematological effects in F344 rats and B6C3F1 mice during the 13-week gavage toxicity study of methylene blue trihydrate. Toxicol Sci 2002; 65: pp. 126-134.
30. Kim S., Quon H., Loevner L.A., et. al.: Pharmacokinetic analysis of dynamic contrast enhanced MRI data in human head and neck cancer. J Magn Reson Imaging 2007; 26: pp. 1607-1617.
31. Song H.K., Dougherty L.: Dynamic MRI with projection reconstruction and KWIC processing for simultaneous high spatial and temporal resolution. Magn Reson Med 2004; 52: pp. 815-824.
32. Song H.K., Dougherty L.: k-space weighted image contrast (KWIC) for contrast manipulation in projection reconstruction MRI. Magn Reson Med 2000; 44: pp. 825-832.