
Rationale and Objectives
To better understand imaging measurement precision and reproducibility and to provide guidance for measurements in individual cystic fibrosis (CF) subjects, we evaluated CF adults on two occasions 7 ± 2 days apart using spirometry, plethysmography, and hyperpolarized helium-3 ( 3 He) magnetic resonance imaging (MRI).
Materials and Methods
Twelve CF subjects underwent spirometry, plethysmography, and 3 He MRI twice within 7 ± 2 days, reporting 3 He ventilation defect volume (VDV) and ventilation defect percent (VDP).
Results
Based on measurement variability, the smallest detectable difference (SDD) for 3 He VDV and VDP was determined to be 120 mL and 2%, respectively. Although no significant difference in spirometry or plethysmography was detected after 7 days, there was a significant difference in mean 3 He VDV (130 mL ± 250 mL, P < .0001) and VDP (3% ± 4%, P < .0001), although baseline and 7-day measurements were highly correlated (VDV: r = .85, P = .001; VDP: r = .94, P < .0001). We estimated the sample sizes required to detect a 5%/7%/10% change in 3 He VDP as 60/15/5 subjects per group.
Conclusion
Hyperpolarized 3 He MRI VDP measurement precision resulted in an SDD for individual CF subjects of 2%, indicating that changes greater than this can be attributed to lung functional changes and not measurement error. After 7 days, significant changes in mean 3 He VDV and VDP were detected and these changes were not reflected by changes in pulmonary function measurements. These findings demonstrate the high sensitivity and reproducibility of 3 He MRI functional imaging that permits the use of relatively small samples sizes in CF interventional studies.
High-resolution computed tomography (HRCT) is currently the gold standard imaging method for providing quantitative morphological measurements of lung abnormalities associated with cystic fibrosis (CF). Scoring systems have been developed for radiological interpretation of various pulmonary abnormalities, including bronchiectasis, mucous plugging, airway wall thickening, and air trapping. Such scoring systems correlate with chest radiograph scores , pulmonary function tests , and clinical findings and have been shown to be more sensitive than spirometry for detecting disease worsening . Despite these important advantages, the risk associated from repeated radiation exposure, particularly in monitoring disease progression and serial imaging in therapy studies, limits the use of CT in CF. In addition, the relationship between lung functional changes and the structural, anatomical, and morphological changes reflected by quantitative HRCT is still not completely understood.
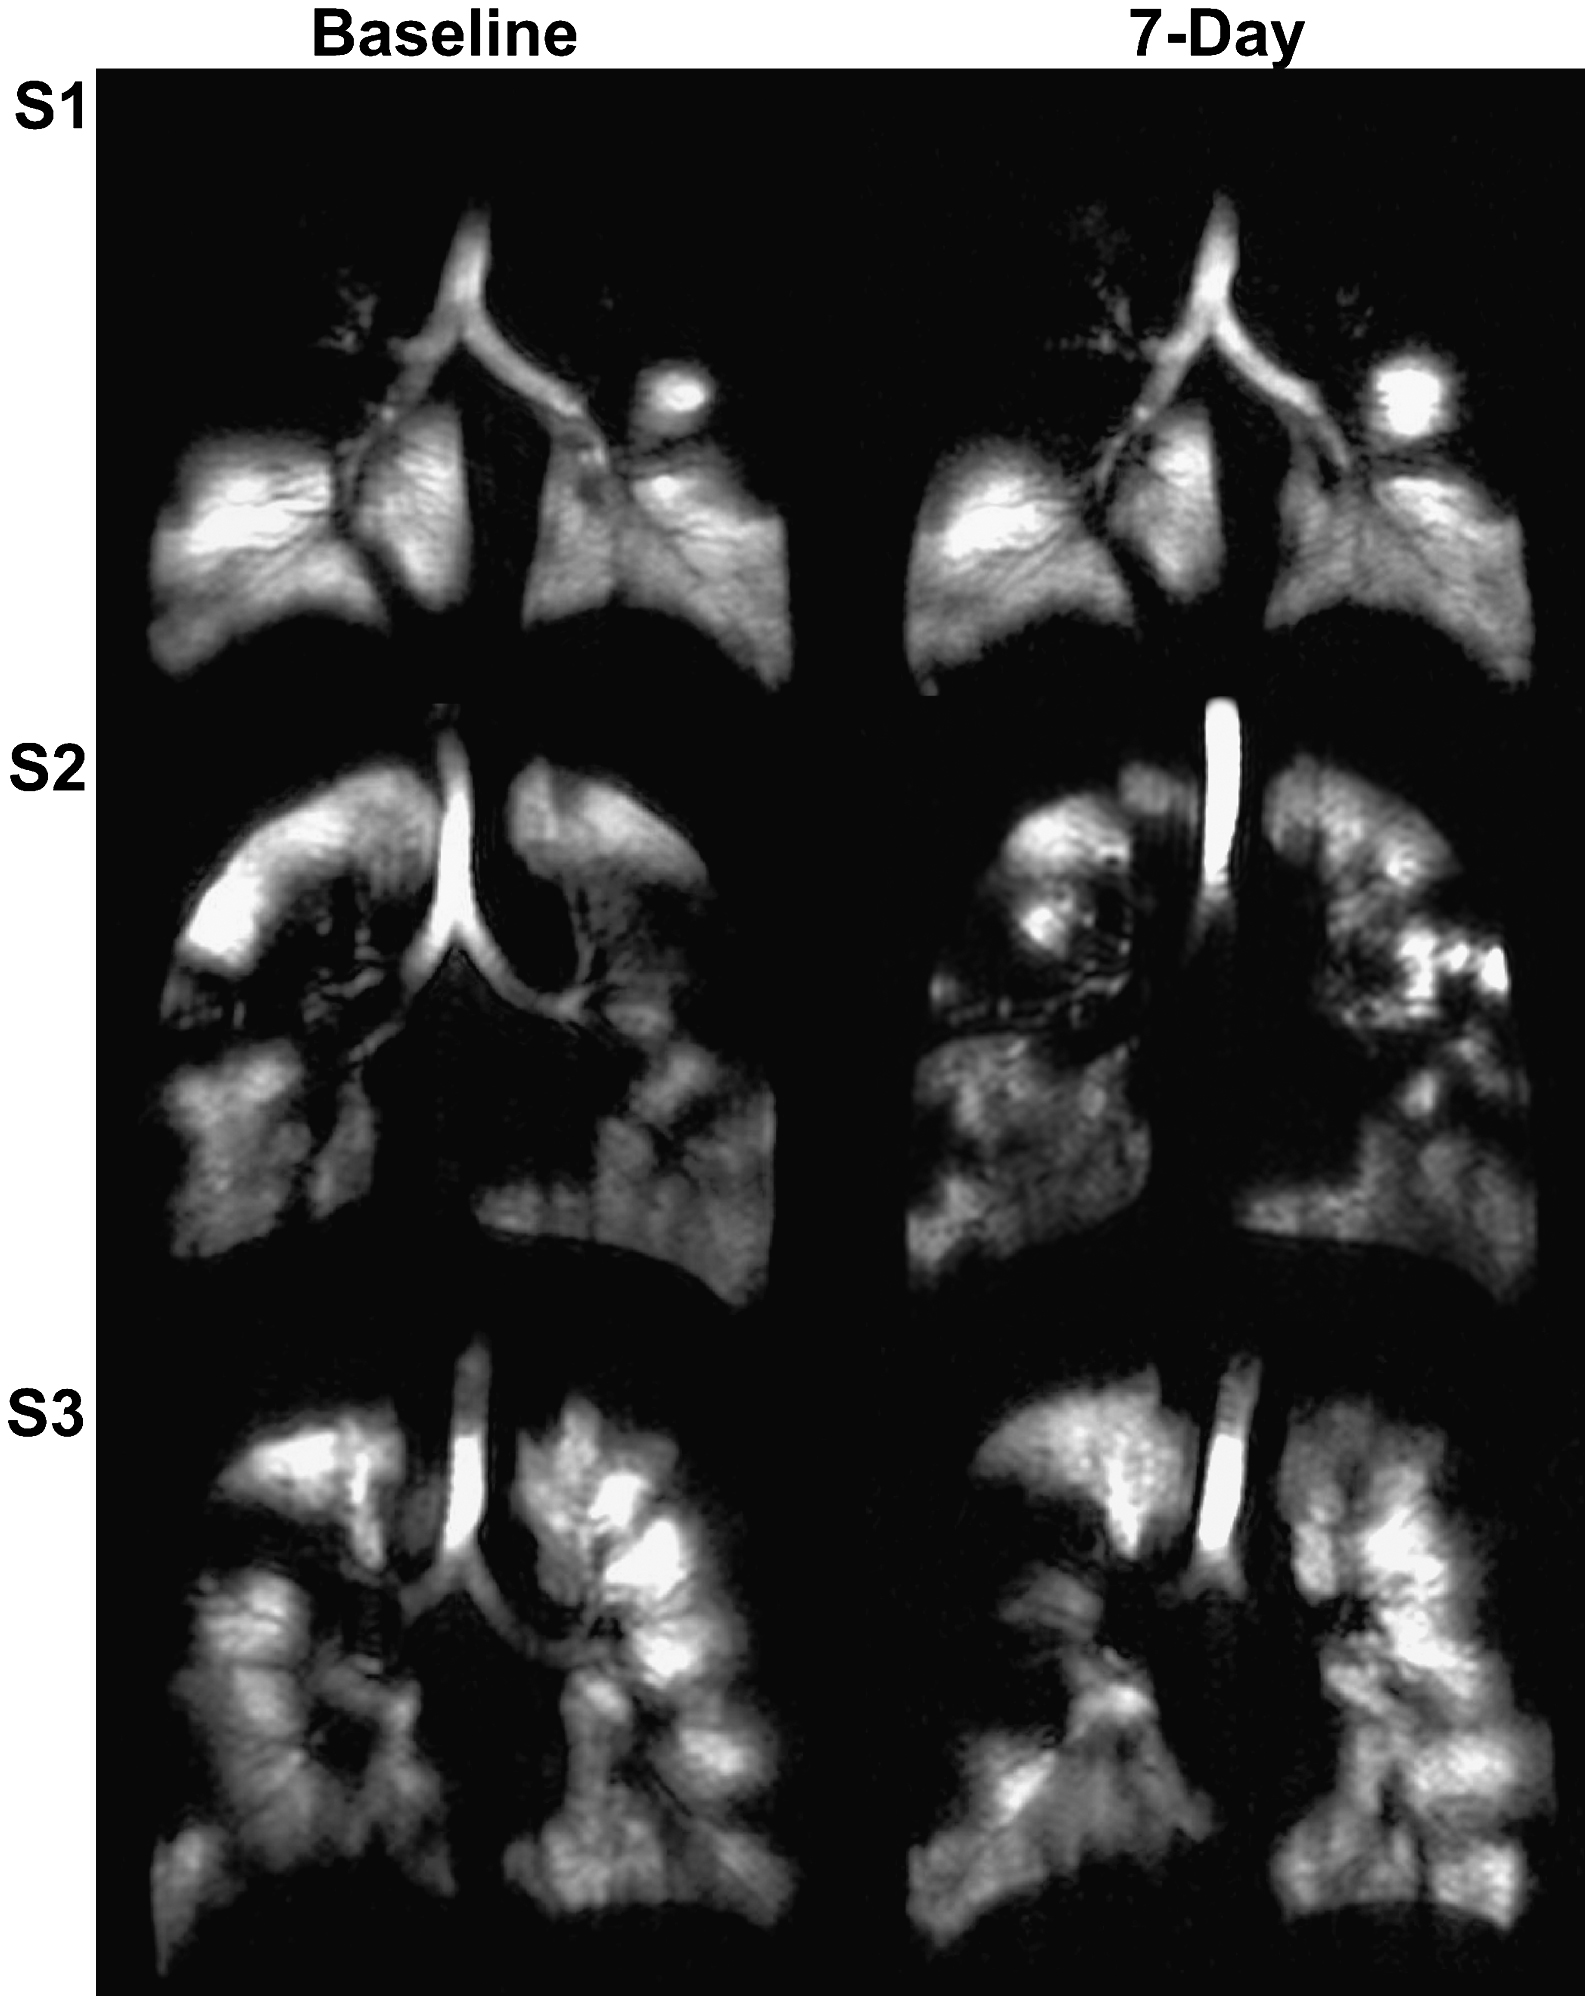
Hyperpolarized helium-3 ( 3 He) magnetic resonance imaging (MRI) provides high spatial and temporal resolution images of both lung structure and function without ionizing radiation. Regional ventilation abnormalities can be clearly visualized as decreased or absent 3 He signal in the lung that can be evaluated using quantitative scoring systems or volumetric approaches . These measurements are sensitive to the pathological changes that accompany CF , have high same-day reproducibility in pediatric CF patients , and changes are clearly visible despite clinically normal spirometry results . Because of previous same-day reproducibility and treatment studies in CF patients, we hypothesized that 3 He MRI would provide the necessary and sufficient spatial and temporal sensitivity to detect day-to-day changes in lung function.
Get Radiology Tree app to read full this article<
Methods and materials
Subjects
Get Radiology Tree app to read full this article<
Pulmonary Function Tests
Get Radiology Tree app to read full this article<
Image Acquisition
Get Radiology Tree app to read full this article<
Get Radiology Tree app to read full this article<
Get Radiology Tree app to read full this article<
Image Analysis
Get Radiology Tree app to read full this article<
Get Radiology Tree app to read full this article<
Get Radiology Tree app to read full this article<
Statistical Methods
Get Radiology Tree app to read full this article<
SDD≥zα2SEMintra−−−−−−−−−√ S
D
D
≥
z
α
2
S
E
M
int
r
a
where zα z
α is 1.96 corresponding to a significance level of α α = .05 and SEMintra S
E
M
int
r
a is the standard error of measurement from intraobserver variability and is calculated as shown in Equation 2 :
SEMintra=σ∧2e−−√ S
E
M
int
r
a
=
σ
∧
e
2
where σ∧2e σ
∧
e
2 is the intraobserver repeated measures variance. Multivariate analysis of variance was performed for comparison of baseline and 7-day pulmonary function measurements using SPSS 16.00 (SPSS Inc., Chicago, IL; LEAD Technologies, Inc., Chicago, IL). For 3 He MRI measurements, a three-way mixed design repeated measures analysis of variance was used to determine the interactions between time-point (baseline and 7-day), repetition (four repeated measurements) and subject using SPSS 16.00. The agreement between time-points for both pulmonary function and 3 He MRI measurements was evaluated using Bland-Altman plots generated using GraphPad Prism version 4.00 (GraphPad Software Inc, San Diego, CA). Linear regression ( r 2 ) and Spearman correlation coefficients ( r ) were used to determine the relationship between pulmonary function and 3 He MRI measurements using SPSS 16.00. A sample size ( n ) calculation was also performed to determine the number of subjects required in a controlled trial to detect a significant difference ( δ ) for VDP between baseline and follow-up with 95% confidence (α = 0.05, zα=1.96 z
α
=
1.96 ) and 80% power ( β=0.20 β
=
0.20 , zβ=0.84 z
β
=
0.84 ), according to Equation 3 :
n=2(Zα+Zβ)2SD2Diffδ2 n
=
2
(
Z
α
+
Z
β
)
2
S
D
D
i
f
f
2
δ
2
where SDDiff S
D
D
i
f
f is the standard deviation of the difference between baseline and follow-up. In all statistical analyses, results were considered significant when the probability of making a type I error was less than 5% ( P < .05).
Get Radiology Tree app to read full this article<
Results
Subject Demographics
Get Radiology Tree app to read full this article<
Table 1
Subject Demographics
Subjects (± SD) (range) ( n = 12) Age, y 26 (8) (18–41) Male sex 5 BMI kg∙m −2 24 (4) (18–30) FEV 1 L 2.68 (0.66) (1.70–3.58) FEV 1 % pred 72 (14) (50–96) FVC L 3.87 (0.97) (2.87–5.65) FVC % pred 87 (12) (74–103) FEV 1 /FVC % 70 (12) (45–87) FEV 1 /FVC % pred 84 (13) (54–99) TLC L 6.52 (1.22) (5.15–8.95) ∗ TLC % pred 108 (12) (96–128) IC L 2.98 (0.63) (1.88–3.67) ∗ IC % pred 101 (20) (80–149) ∗ FRC L 3.60 (1.04) (2.05–4.71) † FRC % pred 116 (28) (77–156) † RV L 2.51 (0.79) (1.51–3.82) ∗ RV % pred 168 (41) (122–232) † D LCO 30.64 (6.39) (21.49–40) † D LCO % pred 105 (18) (87–138) †
BMI, body mass index; D LCO , carbon monoxide diffusion capacity of the lung; FEV 1 , forced expiratory volume in 1 second; FRC, functional residual capacity; FVC, forces vital capacity; IC, inspiratory capacity; % pred , percent predicted; RV, reserve volume; SD, standard deviation; TLC, total lung capacity.
Get Radiology Tree app to read full this article<
Get Radiology Tree app to read full this article<
Table 2
Subject Listing of Baseline and 7-day Pulmonary Function and Hyperpolarized 3 He MRI Measurements
Subject 1 2 3 4 5 6 7 8 9 10 11 12 Mean (± SD) Pulmonary function measurements Baseline FEV 1 (L) 2.11 3.55 1.70 2.53 2.83 3.58 3.56 2.79 2.22 2.28 1.93 3.04 2.68 (0.66) FEV 1 % pred 50 78 54 74 79 81 79 82 69 55 61 96 72 (14) FVC (L) 3.41 4.87 3.06 2.92 3.55 5.65 4.88 3.52 2.87 5.02 2.96 3.77 3.87 (0.97) FVC% pred 65 89 79 75 87 103 90 90 74 103 81 103 87 (12) 7-day FEV 1 (L) 2.17 3.39 2.2 2.7 2.66 3.46 3.4 2.69 2.36 2.32 1.85 3.04 2.69 (0.54) FEV 1 % pred 51 74 69 79 75 78 75 79 73 56 58 96 72 (12) FVC (L) 3.69 4.75 3.39 3.05 3.49 5.31 4.82 3.34 3.05 4.87 2.83 3.76 3.86 (0.85) FVC% pred 70 87 87 78 85 96 89 86 79 100 77 102 86 (10) 3 He MRI measurements Baseline VDV (L) 1.70 1.49 1.15 0.52 0.62 1.79 0.87 0.38 0.98 1.38 1.71 0.15 1.06 (0.56) VDP (%) 30 24 22 13 13 27 17 10 21 24 34 3 20 (9) 7-day VDV (L) 1.80 1.16 1.61 0.30 0.46 1.31 0.52 0.33 0.65 1.36 1.51 0.14 0.93 (0.59) VDP (%) 30 18 27 7 10 25 10 8 11 22 31 3 17 (10)
FEV 1 , forced expiratory volume in 1 second; FVC, forced vital capacity; % pred , percent predicted; VDP, ventilation defect percent; VDV, ventilation defect volume.
Get Radiology Tree app to read full this article<
Baseline and 7-day Measurements
Get Radiology Tree app to read full this article<
Table 3
Baseline and 7-day Pulmonary Function and 3 He MRI Measurements
Parameter Baseline ( n = 12) 7-day ( n = 12) Mean Difference ( P ) ∗ Pulmonary function measurements FEV 1 (L) (± SD) 2.68 (0.66) 2.69 (0.54) −0.01(.19)(NS) FEV 1 % pred (± SD) 72 (14) 72 (12) 0 (6) (NS) FVC % pred (± SD) 87 (12) 86 (10) 0 (4) (NS) FEV 1 /FVC (± SD) 70 (12) 71 (11) −1(4)(NS) TLC % pred (± SD) 108(12) † 113 (16) † −5(7)(NS) IC % pred (± SD) 101 (20) † 103 (19) † −2(14)(NS) FRC % pred (± SD) 116 (29) † 125 (32) † −9(7)(NS) RV % pred (± SD) 168 (41) † 176 (58) † −8(37)(NS) D L CO (% pred ) (± SD) 106 (18) ‡ 111 (13) ‡ −5(8)(NS) Hyperpolarized 3 He MRI VDV L (± SD) 1.06 (0.56) 0.93 (.59) ∗ 0.13 (0.25) (<.0001) VDP % (± SD) 20 (9) 17 (10) ∗ 3 (4) (<.0001)
D LCO , carbon monoxide diffusion capacity of the lung; FEV 1 , forced expiratory volume in 1 second; FRC, functional residual capacity; FVC, forced vital capacity; IC, inspiratory capacity; % pred , percent predicted; RV, reserve volume; SD, standard deviation; TLC, total lung capacity; VDP, ventilation defect percent; VDV, ventilation defect volume.
Get Radiology Tree app to read full this article<
Get Radiology Tree app to read full this article<
Get Radiology Tree app to read full this article<
Get Radiology Tree app to read full this article<
Get Radiology Tree app to read full this article<
Get Radiology Tree app to read full this article<
Get Radiology Tree app to read full this article<
Get Radiology Tree app to read full this article<
Correlations
Get Radiology Tree app to read full this article<
Table 4
Correlation between the Baseline and 7-day Pulmonary Function and 3 He MRI Measurements
Spearman Correlation Coefficient (p) VDV L VDP % FEV 1 L −0.34 (0.12) −0.41 (0.05) FEV 1 % pred −0.65 (0.001) −0.68 (<0.0001) FVC L 0.14 (0.52) 0.04 (0.86) FVC % pred −0.17 (0.43) −0.25 (0.24)
FEV 1 , forced expiratory volume in 1s; FVC, forced vital vapacity; % pred , percent predicted; VDP, ventilation defect percent; VDV, ventilation defect volume.
Get Radiology Tree app to read full this article<
Sample Size Calculations
Get Radiology Tree app to read full this article<
Discussion
Get Radiology Tree app to read full this article<
Get Radiology Tree app to read full this article<
Get Radiology Tree app to read full this article<
Get Radiology Tree app to read full this article<
Get Radiology Tree app to read full this article<
Get Radiology Tree app to read full this article<
Get Radiology Tree app to read full this article<
Get Radiology Tree app to read full this article<
Get Radiology Tree app to read full this article<
References
1. Bhalla M., Turcios N., Aponte V., et. al.: Cystic fibrosis: scoring system with thin-section CT. Radiology 1991; 179: pp. 783-788.
2. de Jong P.A., Ottink M.D., Robben S.G., et. al.: Pulmonary disease assessment in cystic fibrosis: comparison of CT scoring systems and value of bronchial and arterial dimension measurements. Radiology 2004; 231: pp. 434-439.
3. Dodd J.D., Barry S.C., Barry R.B., et. al.: Thin-section CT in patients with cystic fibrosis: correlation with peak exercise capacity and body mass index. Radiology 2006; 240: pp. 236-245.
4. de Jong P.A., Nakano Y., Lequin M.H., et. al.: Progressive damage on high resolution computed tomography despite stable lung function in cystic fibrosis. Eur Respir J 2004; 23: pp. 93-97.
5. Evans A., McCormack D.G., Santyr G., et. al.: Mapping and quantifying hyperpolarized 3He magnetic resonance imaging apparent diffusion coefficient gradients. J Appl Physiol 2008; 105: pp. 693-699.
6. Kirby M., Mathew L., Wheatley A., et. al.: Chronic obstructive pulmonary disease: longitudinal hyperpolarized (3)He MR imaging. Radiology 2010; 256: pp. 280-289.
7. Mathew L., Evans A., Ouriadov A., et. al.: Hyperpolarized 3He magnetic resonance imaging of chronic obstructive pulmonary disease: reproducibility at 3.0 tesla. Acad Radiol 2008; 15: pp. 1298-1311.
8. Mathew L., Gaede S., Wheatley A., et. al.: Detection of longitudinal lung structural and functional changes after diagnosis of radiation-induced lung injury using hyperpolarized 3He magnetic resonance imaging. Med Phys 2010; 37: pp. 22-31.
9. Mathew L., Kirby M., Etemad-Rezai R., et. al.: Hyperpolarized (3)He magnetic resonance imaging: preliminary evaluation of phenotyping potential in chronic obstructive pulmonary disease. Eur J Radiol 2009 Nov 20; [Epub ahead of print]
10. Parraga G., Ouriadov A., Evans A., et. al.: Hyperpolarized 3He ventilation defects and apparent diffusion coefficients in chronic obstructive pulmonary disease: preliminary results at 3.0 Tesla. Invest Radiol 2007; 42: pp. 384-391.
11. Woodhouse N., Wild J.M., Paley M.N., et. al.: Combined helium-3/proton magnetic resonance imaging measurement of ventilated lung volumes in smokers compared to never-smokers. J Magn Reson Imaging 2005; 21: pp. 365-369.
12. Bannier E., Cieslar K., Mosbah K., et. al.: Hyperpolarized 3He MR for sensitive imaging of ventilation function and treatment efficiency in young cystic fibrosis patients with normal lung function. Radiology 2010; 255: pp. 225-232.
13. Donnelly L.F., MacFall J.R., McAdams H.P., et. al.: Cystic fibrosis: combined hyperpolarized 3He-enhanced and conventional proton MR imaging in the lung—preliminary observations. Radiology 1999; 212: pp. 885-889.
14. Koumellis P., Van Beek E.J., Woodhouse N., et. al.: Quantitative analysis of regional airways obstruction using dynamic hyperpolarized 3He MRI-preliminary results in children with cystic fibrosis. J Magn Reson Imaging 2005; 22: pp. 420-426.
15. McMahon C.J., Dodd J.D., Hill C., et. al.: Hyperpolarized 3helium magnetic resonance ventilation imaging of the lung in cystic fibrosis: comparison with high resolution CT and spirometry. Eur Radiol 2006; 16: pp. 2483-2490.
16. Mentore K., Froh D.K., de Lange E.E., et. al.: Hyperpolarized HHe 3 MRI of the lung in cystic fibrosis: assessment at baseline and after bronchodilator and airway clearance treatment. Acad Radiol 2005; 12: pp. 1423-1429.
17. Van Beek E.J., Hill C., Woodhouse N., et. al.: Assessment of lung disease in children with cystic fibrosis using hyperpolarized 3-Helium MRI: comparison with Shwachman score, Chrispin-Norman score and spirometry. Eur Radiol 2007; 17: pp. 1018-1024.
18. Woodhouse N., Wild J.M., Van Beek E.J., et. al.: Assessment of hyperpolarized 3He lung MRI for regional evaluation of interventional therapy: a pilot study in pediatric cystic fibrosis. J Magn Reson Imaging 2009; 30: pp. 981-988.
19. Walter S.D., Eliasziw M., Donner A.: Sample size and optimal designs for reliability studies. Stat Med 1998; 17: pp. 101-110.
20. Heydarian M, Kirby M, Choy S, et al. Semi-automated segmentation of pulmonary ventilation using hyperpolarized 3 He magnetic resonance imaging. Biomedical Engineering Society Annual Meeting 2010 Imaging the Lung - The New Frontier [PS-8A-14–190]. 10.
21. MacQueen J.: Some methods for classification and analysis of multivariate observations. Fifth Berkeley Symposium on Mathematical Statistics and Probability; Statistical Laboratory of the University of California, Berkeley.1967.University of California PressBerkeley, Calif p. 281–97
22. Cooley B, Acton S, Salerno M, et al. Automated scoring of hyperpolarized helium-3 MR lung ventilation images: initial development and validation. Proc Intl Soc Mag Reson Med. Honolulu, Hawaii, May 18-25, 2002.
23. Guyer R.A., Hellman M.D., Emami K., et. al.: A robust method for estimating regional pulmonary parameters in presence of noise. Acad Radiol 2008; 15: pp. 740-752.
24. Ray N., Acton S.T., Altes T., et. al.: Merging parametric active contours within homogeneous image regions for MRI-based lung segmentation. IEEE Trans Med Imaging 2003; 22: pp. 189-199.
25. Adams R., Bischof L.: Seeded region growing. IEEE Trans Pattern Anal Machine Intell 1994; 16: pp. 641-647.
26. Kirby M., Wheatley A., McCormack D.G., et. al.: Development and application of methods to quantify spatial and temporal hyperpolarized 3He MRI ventilation dynamics: preliminary results in chronic obstructive pulmonary disease. Proc SPIE 2010; 7626: pp. 762605-1-762605-9.
27. Eliasziw M., Young S.L., Woodbury M.G., et. al.: Statistical methodology for the concurrent assessment of interrater and intrarater reliability: using goniometric measurements as an example. Phys Ther 1994; 74: pp. 777-788.
28. Bland J.M., Altman D.G.: Statistical methods for assessing agreement between two methods of clinical measurement. Lancet 1986; 1: pp. 307-310.
29. Jekel J., Katz D., Wild D., et. al.: Epidemiology, biostatistics, and preventive medicine.3 ed.2007.Elsevier Inc;Philadelphia