
Rationale and Objectives
T2-weighted magnetic resonance imaging (MRI) hyperintensity assessed visually in the corticospinal tract (CST) lacks sensitivity for a diagnosis of amyotrophic lateral sclerosis (ALS). We sought to explore a quantitative approach to fluid-attenuated inversion recovery (FLAIR) MRI intensity across a range of ALS phenotypes.
Materials and Methods
Thirty-three classical ALS patients, 10 with a flail arm presentation, and six with primary lateral sclerosis underwent MRI at 3 Tesla. Comparisons of quantitative FLAIR intensity in the CST and corpus callosum were made between 21 healthy controls and within patient phenotypic subgroups, some of whom were studied longitudinally.
Results
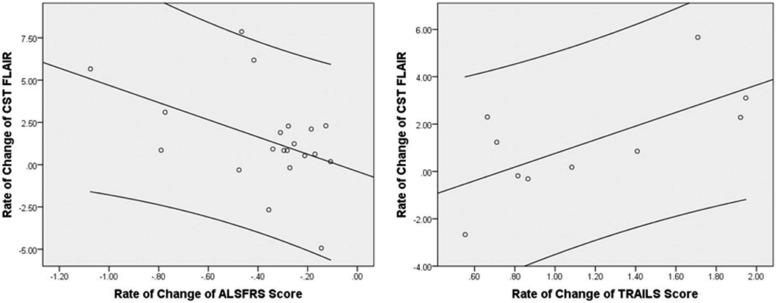
Mean FLAIR intensity was greater in patient groups. The cerebral peduncle intensity provided the strongest subgroup classification. FLAIR intensity increased longitudinally. The rate of change of FLAIR within CST correlated with rate of decline in executive function and ALS functional rating score.
Conclusions
FLAIR MRI encodes quantifiable information of potential diagnostic, stratification, and monitoring value.
Introduction
The neurodegenerative disorder amyotrophic lateral sclerosis (ALS) remains predominantly a clinical diagnosis with significant heterogeneity in rate of disability accumulation. Therapeutic trials rely on survival or change in disability accumulation rate as the primary endpoints. Biomarkers are therefore a research priority . Research-based magnetic resonance imaging (MRI) techniques, in particular diffusion tensor imaging (DTI), have demonstrated a consistent involvement of the corticospinal tracts (CSTs) and corpus callosum (CC) in ALS across a range of phenotypes (reviewed in Reference ).
Classical ALS is characterized by the presence of both upper motor neuron (UMN) and lower motor neuron (LMN) clinical signs . Current diagnostic criteria rely heavily on the presence of UMN signs , but these may be difficult to elicit and are minimal or absent in a substantial proportion of ALS cases . Those with clinically LMN predominant forms of ALS have a similar clinical progression and postmortem evidence of CST involvement , yet may be excluded from therapeutic trials.
Get Radiology Tree app to read full this article<
Get Radiology Tree app to read full this article<
Methods
Participants
Get Radiology Tree app to read full this article<
Get Radiology Tree app to read full this article<
Get Radiology Tree app to read full this article<
Image Acquisition
Get Radiology Tree app to read full this article<
Image Analysis and Statistics
Get Radiology Tree app to read full this article<
Creation of CST ROI
Get Radiology Tree app to read full this article<
Quantitative FLAIR Analysis
Get Radiology Tree app to read full this article<
Clinical Measures
Get Radiology Tree app to read full this article<
Classification Analysis
Get Radiology Tree app to read full this article<
Longitudinal Study
Get Radiology Tree app to read full this article<
Results
Get Radiology Tree app to read full this article<
Table 1
(a) Participant Characteristics (Cross-Sectional Group). (b) Participant Characteristics (Longitudinal Group)
(a) Participant Characteristics (Cross-Sectional Group) Controls ( n = 21) Cross-Sectional Patients ( n = 49) Mean ± SD Range Mean ± SD Range_P_ † Age (years) \* 51.1 ± 12.7 28–72 60.9 ± 11.1 31–83 0.002 Classical ALS — — 59.3 ± 11.0 31–77 0.021 “Flail arm” ALS — — 61.7 ± 12.5 41–83 0.042 PLS — — 68.8 ± 6.2 62–76 0.003 Disease duration (months) \* — — 59 ± 66.4 5–366 — UMN score \* — — 9.5 ± 4.7 0–25 — ALSFRS-R \* — — 33.3 ± 5.8 18–44 — TMT B − A \* — — 36.8 ± 22 0–86 —
n %n %P Male 11 52.4% 31 63.3% 0.433 ‡ Classical ALS — — 33 67.4% — “Flail arm” ALS — — 10 20.4% — PLS — — 6 12.2% —
Disease Duration (Months ± SD) Classical ALS 35.1 ±29.2 “Flail arm” ALS 64.7 ±34.6 PLS 180.5 ±114.9
(b) Participant Characteristics (Longitudinal Group) Controls ( n = 21) Single-Scan Patients ( n = 28) Longitudinal Patients ( n = 21) Mean ± SD Range Mean ± SD Range_P_ † Mean ± SD Range_P_ § Age (years) \* 51.1 ± 12.7 28–72 60.9 ± 10.6 31–77 0.143 61.6 ± 12.2 39–83 0.954 Disease duration (months) \* — — 37.3 ± 39.1 5–190 — 91.5 ± 84 21–366 0.007 UMN score \* — — 10.0 ± 5.0 2–25 — 8.7 ± 4.7 0–15 0.494 ALSFRS-R \* — — 33.2 ± 7.2 18–44 — 33.3 ± 3.4 26–37 0.906 TMT B − A \* — — 39.5 ± 22.5 8–81 — 36.4 ± 19.9 10–86 0.472 Number of scans — — — — — 3.6 ± 1.1 2–5 —
n %n %P ‡ n %P ¶ Male 11 52.4% 19 67.7% 0.376 11 52.4% 0.553 Classical ALS — — 24 85.7% — 9 42.9% 0.002 “Flail arm” ALS — — 3 10.7% — 7 33.3% 0.076 PLS — — 1 3.6% — 5 23.8% 0.072
Disease Duration (Months ± SD) Disease Duration_P_ ‖ Classical ALS 29.8 ± 25.0 49.4 ±36.0 0.222 “Flail arm” ALS 46.8 ± 30.5 72.3 ±35.4 0.665 PLS 189.9 — 178.6 128.4 0.980
Longitudinal Patient Clinical Progression_n_ Mean ± SD Range Rate of change of ALSFRS \\ 20 −0.379 ±9 0.25 −1.07 to −0.11 Rate of change of TMT B − A \\ 14 0.31 ± 1.7 −4.09 to 1.95 Rate of change of CST FLAIR †† 21 1.47 ± 2.78 — Rate of change of CC FLAIR †† 21 0.58 ± 3.08 —
ALS, amyotrophic lateral sclerosis; ALSFRS-R, revised Amyotrophic Lateral Sclerosis Functional Rating Scale; CC, corpus callosum; CST, corticospinal tract; FLAIR, fluid-attenuated inversion recovery; PLS, primary lateral sclerosis; SD, standard deviation; TMT, Trail Making Test; UMN, upper motor neuron.
ALS vs PLS: P = 0.049.
ALS vs Flail arm: P = 0.589.
Flail arm vs PLS: P = 0.149.
Get Radiology Tree app to read full this article<
Get Radiology Tree app to read full this article<
Get Radiology Tree app to read full this article<
Get Radiology Tree app to read full this article<
Get Radiology Tree app to read full this article<
Get Radiology Tree app to read full this article<
Get Radiology Tree app to read full this article<
Get Radiology Tree app to read full this article<
Get Radiology Tree app to read full this article<
Quantitative FLAIR Analysis
Get Radiology Tree app to read full this article<
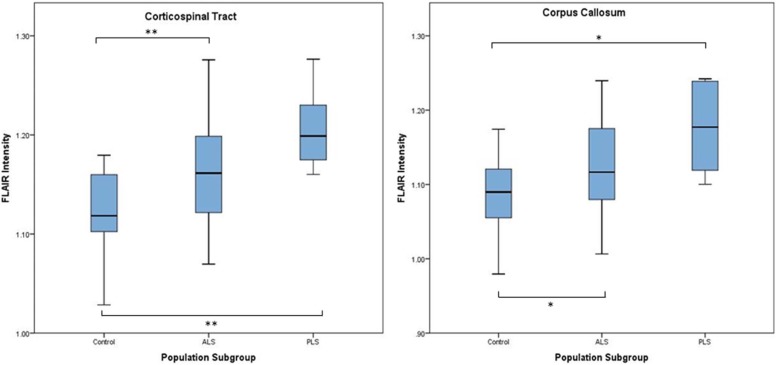
Table 2
Quantitative FLAIR in Subregions of the CST and CC
Control All ALS Patients Classical ALS Flail Arm PLS Intensity Intensity_P_ \* Intensity_P_ \* Intensity_P_ \* Intensity_P_ \* Whole CST 1.121 1.167 0.001 1.167 0.003 1.144 0.114 1.207 <0.001 Corona radiata 1.154 1.210 <0.001 1.208 0.001 1.188 0.038 1.258 <0.001 Internal capsule 1.066 1.091 0.081 1.094 0.084 1.069 0.625 1.114 0.022 Cerebral peduncle 0.984 1.010 0.099 1.017 0.046 0.972 0.462 1.034 0.032 Whole CC 1.085 1.132 0.003 1.127 0.007 1.122 0.070 1.176 0.001 Genu of CC 1.114 1.168 0.009 1.157 0.050 1.176 0.019 1.217 0.001 Body of CC 1.149 1.202 0.001 1.199 0.002 1.191 0.060 1.237 0.001 Splenium of CC 0.996 1.032 0.025 1.029 0.033 1.011 0.386 1.081 0.004
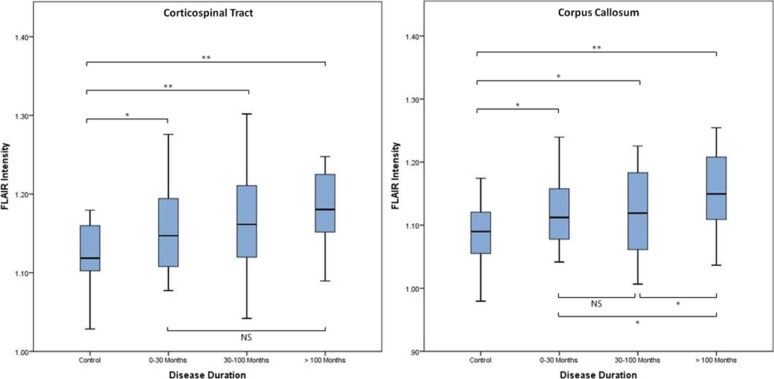
Control All ALS Patients Classical ALS Flail Arm PLS Intensity Intensity_P_ † Intensity_P_ † Intensity_P_ † Intensity_P_ † Whole CST 1.12 0–30 months — 1.16 0.013 1.16 0.009 1.11 0.579 — — 30–100 months — 1.17 0.001 1.16 0.011 1.14 0.277 1.25 <0.001 >100 months — 1.18 <0.001 1.14 0.460 1.19 0.002 1.20 <0.001 Whole CC 1.08 0–30 months — 1.12 0.020 1.12 0.009 1.06 0.041 — — 30–100 months — 1.12 0.020 1.11 0.133 1.11 0.283 1.18 <0.001 >100 months – 1.15 <0.001 1.10 0.672 1.16 0.001 1.18 <0.001
ALS, amyotrophic lateral sclerosis; CC, corpus callosum; CST, corticospinal tract; PLS, primary lateral sclerosis.
Get Radiology Tree app to read full this article<
Get Radiology Tree app to read full this article<
Get Radiology Tree app to read full this article<
Clinical Measures
Get Radiology Tree app to read full this article<
Get Radiology Tree app to read full this article<
Classification Analysis
Get Radiology Tree app to read full this article<
Longitudinal Analysis
Get Radiology Tree app to read full this article<
Get Radiology Tree app to read full this article<
Discussion
Get Radiology Tree app to read full this article<
Get Radiology Tree app to read full this article<
Get Radiology Tree app to read full this article<
Get Radiology Tree app to read full this article<
Get Radiology Tree app to read full this article<
Get Radiology Tree app to read full this article<
Get Radiology Tree app to read full this article<
Conclusions
Get Radiology Tree app to read full this article<
Appendix
Supplementary Data
Get Radiology Tree app to read full this article<
Figure S1
Get Radiology Tree app to read full this article<
Get Radiology Tree app to read full this article<
Get Radiology Tree app to read full this article<
Get Radiology Tree app to read full this article<
References
1. Turner M.R., Benatar M.: Ensuring continued progress in biomarkers for amyotrophic lateral sclerosis. Muscle Nerve 2015; 51: pp. 14-18.
2. Turner M.R., Verstraete E.: What does imaging reveal about the pathology of amyotrophic lateral sclerosis?. Curr Neurol Neurosci Rep 2015; 15: pp. 569.
3. Kiernan M.C., Vucic S., Cheah B.C., et. al.: Amyotrophic lateral sclerosis. Lancet 2011; 377: pp. 942-955.
4. Brooks B.R., Miller R.G., Swash M., et. al.: El Escorial revisited: revised criteria for the diagnosis of amyotrophic lateral sclerosis. Amyotroph Lateral Scler Other Motor Neuron Disord 2000; 1: pp. 293-299.
5. Swash M.: Why are upper motor neuron signs difficult to elicit in amyotrophic lateral sclerosis?. J Neurol Neurosurg Psychiatry 2012; 83: pp. 659-662.
6. Brownell B., Oppenheimer D.R., Hughes J.T.: The central nervous system in motor neurone disease. J Neurol Neurosurg Psychiatry 1970; 33: pp. 338-357.
7. Ince P.G., Evans J., Knopp M., et. al.: Corticospinal tract degeneration in the progressive muscular atrophy variant of ALS. Neurology 2003; 60: pp. 1252-1258.
8. Pringle C.E., Hudson A.J., Munoz D.G., et. al.: Primary lateral sclerosis. Clinical features, neuropathology and diagnostic criteria. Brain 1992; 115: pp. 495-520.
9. Hu M.T., Ellis C.M., Al Chalabi A., et. al.: Flail arm syndrome: a distinctive variant of amyotrophic lateral sclerosis. J Neurol Neurosurg Psychiatry 1998; 65: pp. 950-951.
10. Turner M.R., Talbot K.: Mimics and chameleons in motor neurone disease. Pract Neurol 2013; 13: pp. 153-164.
11. Filippi M., Agosta F., Abrahams S., et. al.: EFNS guidelines on the use of neuroimaging in the management of motor neuron diseases. Eur J Neurol 2010; 17: pp. 526-533.
12. Goodin D.S., Rowley H.A., Olney R.K.: Magnetic resonance imaging in amyotrophic lateral sclerosis. Ann Neurol 1988; 23: pp. 418-420.
13. Kono Y., Sengoku R., Mitsumura H., et. al.: Clinical characteristics associated with corticospinal tract hyperintensity on magnetic resonance imaging in patients with amyotrophic lateral sclerosis. Clin Neurol Neurosurg 2014; 127: pp. 1-4.
14. Gordon P.H., Cheng B., Katz I.B., et. al.: The natural history of primary lateral sclerosis. Neurology 2006; 66: pp. 647-653.
15. Menke R.A., Korner S., Filippini N., et. al.: Widespread grey matter pathology dominates the longitudinal cerebral MRI and clinical landscape of amyotrophic lateral sclerosis. Brain 2014; 137: pp. 2546-2555.
16. Arbuthnott K., Frank J.: Trail making test, part B as a measure of executive control: validation using a set-switching paradigm. J Clin Exp Neuropsychol 2000; 22: pp. 518-528.
17. Smith S.M., Jenkinson M., Woolrich M.W., et. al.: Advances in functional and structural MR image analysis and implementation as FSL. Neuroimage 2004; 23: pp. S208-S219.
18. Waragai M.: MRI and clinical features in amyotrophic lateral sclerosis. Neuroradiology 1997; 39: pp. 847-851.
19. Cheung G., Gawel M.J., Cooper P.W., et. al.: Amyotrophic lateral sclerosis: correlation of clinical and MR imaging findings. Radiology 1995; 194: pp. 263-270.
20. Hofmann E., Ochs G., Pelzl A., et. al.: The corticospinal tract in amyotrophic lateral sclerosis: an MRI study. Neuroradiology 1998; 40: pp. 71-75.
21. Charil A., Corbo M., Filippi M., et. al.: Structural and metabolic changes in the brain of patients with upper motor neuron disorders: a multiparametric MRI study. Amyotroph Lateral Scler Other Motor Neuron Disord 2009; 10: pp. 269-279.
22. Ding X.Q., Kollewe K., Blum K., et. al.: Value of quantitative analysis of routine clinical MRI sequences in ALS. Amyotroph Lateral Scler 2011; 12: pp. 406-413.
23. Peretti-Viton P., Azulay J.P., Trefouret S., et. al.: MRI of the intracranial corticospinal tracts in amyotrophic and primary lateral sclerosis. Neuroradiology 1999; 41: pp. 744-749.
24. Hecht M.J., Fellner F., Fellner C., et. al.: MRI-FLAIR images of the head show corticospinal tract alterations in ALS patients more frequently than T2-, T1- and proton-density-weighted images. J Neurol Sci 2001; 186: pp. 37-44.
25. Turner M.R.: Reversible diffusion MRI abnormalities and transient mutism after liver transplantation. Neurology 2005; 64: pp. 177. author reply
26. Evans M.C., Serres S., Khrapitchev A.A., et. al.: T(2)-weighted MRI detects presymptomatic pathology in the SOD1 mouse model o ALS. J Cereb Blood Flow Metab 2014; 34: pp. 785-793.
27. Hughes J.T.: Pathology of amyotrophic lateral sclerosis. Adv Neurol 1982; 36: pp. 61-74.
28. Rajagopalan V., Allexandre D., Yue G.H., et. al.: Diffusion tensor imaging evaluation of corticospinal tract hyperintensity in upper motor neuron-predominant ALS patients. J Aging Res 2011; 2011: pp. 481745.
29. Miller K.L., Stagg C.J., Douaud G., et. al.: Diffusion imaging of whole, post-mortem human brains on a clinical MRI scanner. Neuroimage 2011; 57: pp. 167-181.
30. Turner M.R., Agosta F., Bede P., et. al.: Neuroimaging in amyotrophic lateral sclerosis. Biomark Med 2012; 6: pp. 319-337.
31. Sarro L., Agosta F., Canu E., et. al.: Cognitive functions and white matter tract damage in amyotrophic lateral sclerosis: a diffusion tensor tractography study. AJNR Am J Neuroradiol 2011; 32: pp. 1866-1872.
32. Kolind S., Sharma R., Knight S., et. al.: Myelin imaging in amyotrophic and primary lateral sclerosis. Amyotrophic lateral sclerosis & frontotemporal degeneration 2013; 14: pp. 562-573.
33. Turner M.R., Grosskreutz J., Kassubek J., et. al.: Towards a neuroimaging biomarker for amyotrophic lateral sclerosis. Lancet Neurol 2011; 10: pp. 400-403.
34. Foerster B.R., Dwamena B.A., Petrou M., et. al.: Diagnostic accuracy using diffusion tensor imaging in the diagnosis of ALS: a meta-analysis. Acad Radiol 2012; 19: pp. 1075-1086.
35. Verstraete E., Turner M.R., Grosskreutz J., et. al.: Mind the gap: the mismatch between clinical and imaging metrics in ALS. Amyotrophic lateral sclerosis & frontotemporal degeneration 2015; 16: pp. 524-529.
36. Menke R.A., Abraham I., Thiel C.S., et. al.: Fractional anisotropy in the posterior limb of the internal capsule and prognosis in amyotrophic lateral sclerosis. Arch Neurol 2012; 69: pp. 1493-1499.
37. Ciccarelli O., Behrens T.E., Johansen-Berg H., et. al.: Investigation of white matter pathology in ALS and PLS using tract-based spatial statistics. Hum Brain Mapp 2009; 30: pp. 615-624.
38. Iwata N.K., Kwan J.Y., Danielian L.E., et. al.: White matter alterations differ in primary lateral sclerosis and amyotrophic lateral sclerosis. Brain 2011; 134: pp. 2642-2655.
39. van der Graaff M.M., Sage C.A., Caan M.W., et. al.: Upper and extra-motoneuron involvement in early motoneuron disease: a diffusion tensor imaging study. Brain 2011; 134: pp. 1211-1228.
40. Kwan J.Y., Meoded A., Danielian L.E., et. al.: Structural imaging differences and longitudinal changes in primary lateral sclerosis and amyotrophic lateral sclerosis. Neuroimage Clin 2012; 2: pp. 151-160.
41. Agosta F., Galantucci S., Riva N., et. al.: Intrahemispheric and interhemispheric structural network abnormalities in PLS and ALS. Hum Brain Mapp 2014; 35: pp. 1710-1722.
42. Pettit L.D., Bastin M.E., Smith C., et. al.: Executive deficits, not processing speed relates to abnormalities in distinct prefrontal tracts in amyotrophic lateral sclerosis. Brain 2013; 136: pp. 3290-3304.
43. Elamin M., Phukan J., Bede P., et. al.: Executive dysfunction is a negative prognostic indicator in patients with ALS without dementia. Neurology 2011; 76: pp. 1263-1269.