
Rationale and Objectives
To investigate the usefulness of the statistical shape model (SSM) for the quantification of liver shape to evaluate hepatic fibrosis.
Materials and Methods
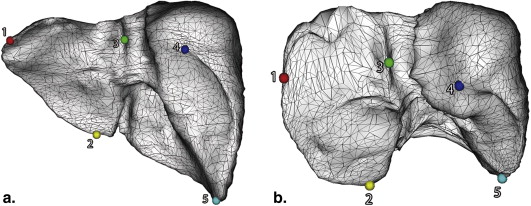
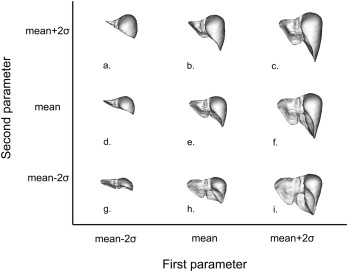
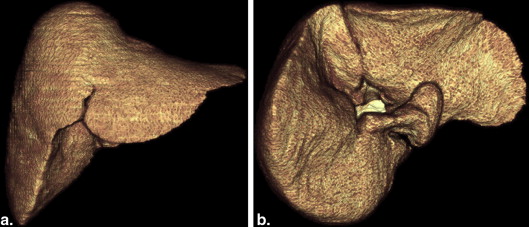
Ninety-one subjects (45 men and 46 women; age range, 20–75 years) were included in this retrospective study: 54 potential liver donors and 37 patients with chronic liver disease. The subjects were classified histopathologically according to the fibrosis stage as follows: F0 ( n = 55); F1 ( n = 6); F2 (3); F3 ( n = 1); and F4 ( n = 26). Each subject underwent contrast-enhanced computed tomography (CT) using a 64-channel scanner (0.625-mm slice thickness). An abdominal radiologist manually traced the liver boundaries on every CT section using an image workstation; the boundaries were used for subsequent analyses. An SSM was constructed by the principal component analysis of the subject data set, which defined a parametric model of the liver shapes. The shape parameters were calculated by fitting SSM to the segmented liver shape of each subject and were used for the training of a linear support vector regression (SVR), which classifies the liver fibrosis stage to maximize the area under the receiver operating characteristic curve (AUC). SSM/SVR models were constructed and were validated in a leave-one-out manner. The performance of our technique was compared to those of two previously reported types of caudate–right lobe ratios (C/RL-m and C/RL-r).
Results
In our SSM/SVR models, the AUC values for the classification of liver fibrosis were 0.96 (F0 vs. F1–4), 0.95 (F0–1 vs. F2–4), 0.96 (F0–2 vs. F3–4), and 0.95 (F0–3 vs. F4). These values were significantly superior to AUC values using the C/RL-m or C/RL-r ratios ( P < .005).
Conclusions
SSM was useful for estimating the stage of hepatic fibrosis by quantifying liver shape.
Hepatic fibrosis is a reversible scaring response that occurs in patients with chronic liver injury . Ultimately, it can develop into cirrhosis and hepatocellular carcinoma. Evaluation of the stage of hepatic fibrosis is clinically useful for the management of patients with chronic liver disease because of some reasons. First, the risk of developing hepatocellular carcinoma increases with the stage of hepatic fibrosis . Second, the evaluation of hepatic fibrosis has the potential to predict the outcome of antiviral therapy because advanced hepatic fibrosis impairs the response to interferon-based antiviral therapy in patients with chronic hepatitis C . Third, there is a possibility that therapeutic responses can be monitored by evaluating the fibrosis stage because antiviral therapies can lead to fibrosis regression .
Biopsy has been the widely accepted gold standard in the evaluation of hepatic fibrosis; however, it is an invasive procedure that carries the risk of serious complications. Moreover, pathologic assessment is subjective and prone to sampling error. Therefore, various types of less-invasive techniques have been proposed to evaluate the stage of hepatic fibrosis, such as laboratory tests and imaging techniques .
Get Radiology Tree app to read full this article<
Materials and methods
Subjects
Get Radiology Tree app to read full this article<
Get Radiology Tree app to read full this article<
Get Radiology Tree app to read full this article<
CT Examination
Get Radiology Tree app to read full this article<
Development and Evaluation of a Classifier Based on the Statistical Shape Model
Liver Segmentation and Spatially Normalized Surface Model Construction
Get Radiology Tree app to read full this article<
Get Radiology Tree app to read full this article<
Statistical Shape Model and Support Vector Regression
Get Radiology Tree app to read full this article<
Get Radiology Tree app to read full this article<
Performance Evaluation
Get Radiology Tree app to read full this article<
Statistical Analysis
Get Radiology Tree app to read full this article<
Ethics Statement
Get Radiology Tree app to read full this article<
Results
Get Radiology Tree app to read full this article<
Get Radiology Tree app to read full this article<
Get Radiology Tree app to read full this article<


Table 1
Statistical Values for Assessment of Hepatic Fibrosis
AUC Sensitivity (%) Specificity (%) Stage F0 versus Stage F1–4 SSM/SVR 0.96 88.6 91.5 C/RL-m 0.69 ∗ 56.0 70.6 C/RL-r 0.64 ∗ 42.2 79.5 Stage F0–1 versus Stage F2–4 SSM/SVR 0.95 84.8 91.7 C/RL-m 0.75 † 79.3 59.2 C/RL-r 0.70 ∗ 75.6 54.5 Stage F0–2 versus Stage F3–4 SSM/SVR 0.96 88.7 90.2 C/RL-m 0.75 ∗ 74.7 63.3 C/RL-r 0.75 ∗ 78.0 59.9 Stage F0–3 versus Stage F4 SSM/SVR 0.95 87.2 89.4 C/RL-m 0.77 † 74.4 65.3 C/RL-r 0.74 ∗ 77.1 59.3
AUC, area under the receiver operating characteristic curve; C/RL, caudate–right lobe ratios; SSM, statistical shape model; SVR, support vector regression.
Sensitivities and specificities are values at the so-called “optimal operating point” where the compromise between sensitivity and specificity is balanced (equal weights were attributed to specificity and sensitivity).
Get Radiology Tree app to read full this article<
Get Radiology Tree app to read full this article<
Get Radiology Tree app to read full this article<
Get Radiology Tree app to read full this article<

Get Radiology Tree app to read full this article<
Discussion
Get Radiology Tree app to read full this article<
Get Radiology Tree app to read full this article<
Get Radiology Tree app to read full this article<
Get Radiology Tree app to read full this article<
Get Radiology Tree app to read full this article<
Get Radiology Tree app to read full this article<
Acknowledgments
Get Radiology Tree app to read full this article<
Get Radiology Tree app to read full this article<
References
1. Friedman S.L.: Hepatic fibrosis—overview. Toxicology 2008; 254: pp. 120-129.
2. Yoshida H., Shiratori Y., Moriyama M., et. al.: Interferon therapy reduces the risk for hepatocellular carcinoma: national surveillance program of cirrhotic and noncirrhotic patients with chronic hepatitis C in Japan. IHIT study group. Inhibition of hepatocarcinogenesis by interferon therapy. Ann Intern Med 1999; 131: pp. 174-181.
3. Chen C.J., Yang H.I., Su J., et. al.: Risk of hepatocellular carcinoma across a biological gradient of serum hepatitis B virus DNA level. JAMA 2006; 295: pp. 65-73.
4. Everson G.T., Hoefs J.C., Seeff L.B., et. al.: Impact of disease severity on outcome of antiviral therapy for chronic hepatitis C: lessons from the HALT-C trial. Hepatology 2006; 44: pp. 1675-1684.
5. Dienstag J.L., Goldin R.D., Heathcote E.J., et. al.: Histological outcome during long-term lamivudine therapy. Gastroenterology 2003; 124: pp. 105-117.
6. Camma C., Di Bona D., Schepis F., et. al.: Effect of peginterferon alfa-2a on liver histology in chronic hepatitis C: a meta-analysis of individual patient data. Hepatology 2004; 39: pp. 333-342.
7. Marcellin P., Gane E., Buti M., et. al.: Regression of cirrhosis during treatment with tenofovir disoproxil fumarate for chronic hepatitis B: a 5-year open-label follow-up study. Lancet 2013; 381: pp. 468-475.
8. Gressner O.A., Weiskirchen R., Gressner A.M.: Biomarkers of liver fibrosis: clinical translation of molecular pathogenesis or based on liver-dependent malfunction tests. Clin Chim Acta 2007; 381: pp. 107-113.
9. Harbin W.P., Robert N.J., Ferrucci J.T.: Diagnosis of cirrhosis based on regional changes in hepatic morphology: a radiological and pathological analysis. Radiology 1980; 135: pp. 273-283.
10. Awaya H., Mitchell D.G., Kamishima T., et. al.: Cirrhosis: modified caudate-right lobe ratio. Radiology 2002; 224: pp. 769-774.
11. Colli A., Fraquelli M., Andreoletti M., et. al.: Severe liver fibrosis or cirrhosis: accuracy of US for detection—analysis of 300 cases. Radiology 2003; 227: pp. 89-94.
12. Rouviere O., Yin M., Dresner M.A., et. al.: MR elastography of the liver: preliminary results. Radiology 2006; 240: pp. 440-448.
13. Goshima S., Kanematsu M., Kobayashi T., et. al.: Staging hepatic fibrosis: computer-aided analysis of hepatic contours on gadolinium ethoxybenzyl diethylenetriaminepentaacetic acid-enhanced hepatocyte-phase magnetic resonance imaging. Hepatology 2012; 55: pp. 328-329.
14. Ogura S., Saitoh S., Kawamura Y., et. al.: Magnetic resonance laparoscopy: a new non-invasive technique for the assessment of chronic viral liver disease. Hepatol Res 2013; 43: pp. 836-845.
15. Cohen E.B., Afdhal N.H.: Ultrasound-based hepatic elastography: origins, limitations, and applications. J Clin Gastroenterol 2010; 44: pp. 637-645.
16. Styner M., Lieberman J.A., McClure R.K., et. al.: Morphometric analysis of lateral ventricles in schizophrenia and healthy controls regarding genetic and disease-specific factors. Proc Natl Acad Sci U S A 2005; 102: pp. 4872-4877.
17. Shen K.K., Fripp J., Meriaudeau F., et. al.: Detecting global and local hippocampal shape changes in Alzheimer’s disease using statistical shape models. Neuroimage 2012; 59: pp. 2155-2166.
18. Heimann T., Meinzer H.P.: Statistical shape models for 3D medical image segmentation: a review. Med Image Anal 2009; 13: pp. 543-563.
19. Chen Y.W., Luo J., Dong C., et. al.: Computer-aided diagnosis and quantification of cirrhotic livers based on morphological analysis and machine learning. Comput Math Methods Med 2013; 2013: pp. 264809.
20. Shen D., Herskovits E.H., Davatzikos C.: An adaptive-focus statistical shape model for segmentation and shape modeling of 3-D brain structures. IEEE Trans Med Imaging 2001; 20: pp. 257-270.
21. Okada T., Shimada R., Hori M., et. al.: Automated segmentation of the liver from 3D CT images using probabilistic atlas and multilevel statistical shape model. Acad Radiol 2008; 15: pp. 1390-1403.
22. Gutierrez-Becker B., Arambula Cosio F., Guzman Huerta M.E., et. al.: Automatic segmentation of the fetal cerebellum on ultrasound volumes, using a 3D statistical shape model. Med Biol Eng Comput 2013; 51: pp. 1021-1030.
23. Tomoshige S., Oost E., Shimizu A., et. al.: A conditional statistical shape model with integrated error estimation of the conditions; application to liver segmentation in non-contrast CT images. Med Image Anal 2014; 18: pp. 130-143.
24. Ichida F., Tsuji T., Omata M., et. al.: New Inuyama classification; new criteria for histological assessment of chronic hepatitis. Int Hepatol Commun 1996; 6: pp. 112-119.
25. Drucker H., Burges C.J.C., Kaufman L., et. al.: Support vector regression machines. Adv Neural Inf Process Syst 1996; 9: pp. 155-161.
26. Smola A.J., Schölkopf B.: A tutorial on support vector regression. Statistics and Computing 2004; 14: pp. 199-222.
27. Gokturk S.B., Tomasi C., Acar B., et. al.: A statistical 3-D pattern processing method for computer-aided detection of polyps in CT colonography. IEEE Trans Med Imaging 2001; 20: pp. 1251-1260.
28. Cox D.D., Savoy R.L.: Functional magnetic resonance imaging (fMRI) “brain reading”: detecting and classifying distributed patterns of fMRI activity in human visual cortex. Neuroimage 2003; 19: pp. 261-270.
29. Wang Y.M., Schultz R.T., Constable R.T., et. al.: Nonlinear estimation and modeling of fMRI data using spatio-temporal support vector regression. Inf Process Med Imaging 2003; 18: pp. 647-659.
30. Xu J.W., Suzuki K.: Massive-training support vector regression and Gaussian process for false-positive reduction in computer-aided detection of polyps in CT colonography. Med Phys 2011; 38: pp. 1888-1902.
31. Chang C.C., Lin C.J.: LIBSVM: a library for support vector machines. ACM TIST 2011; 2: pp. 21-27. 27
32. Nakayama Y., Li Q., Katsuragawa S., et. al.: Automated hepatic volumetry for living related liver transplantation at multisection CT. Radiology 2006; 240: pp. 743-748.
33. Suzuki K., Epstein M.L., Kohlbrenner R., et. al.: Quantitative radiology: automated CT liver volumetry compared with interactive volumetry and manual volumetry. AJR Am J Roentgenol 2011; 197: pp. W706-W712.
34. Song X., Cheng M., Wang B., et. al.: Adaptive fast marching method for automatic liver segmentation from CT images. Med Phys 2013; 40: pp. 091917.
35. Huynh H.T., Karademir I., Oto A., et. al.: Computerized liver volumetry on MRI by using 3D geodesic active contour segmentation. AJR Am J Roentgenol 2014; 202: pp. 152-159.
36. Talwalkar J.A., Yin M., Fidler J.L., et. al.: Magnetic resonance imaging of hepatic fibrosis: emerging clinical applications. Hepatology 2008; 47: pp. 332-342.
37. Yin M., Talwalkar J.A., Glaser K.J., et. al.: Assessment of hepatic fibrosis with magnetic resonance elastography. Clin Gastroenterol Hepatol 2007; 5: pp. 1207-1213 e1202.
38. Venkatesh S.K., Wang G., Lim S.G., et. al.: Magnetic resonance elastography for the detection and staging of liver fibrosis in chronic hepatitis B. Eur Radiol 2014; 24: pp. 70-78.