
Rationale and Objectives
To investigate the value of iodine-based material decomposition images produced via spectral computed tomography (CT) in differentiating prostate cancer (PCa) from benign prostate hyperplasia (BPH).
Materials and Methods
Fifty-six male patients underwent CT examination with spectral imaging during arterial phase (AP), venous phase (VP), and parenchymal phase (PP) of enhancement. Iodine concentrations of lesions were measured and normalized to that of the obturator internus muscle. Lesion CT values at 75 keV (corresponding to the energy of polychromatic images at 120 kVp) were measured and also normalized; their differences between AP and VP, VP and PP, and PP and AP were also obtained. The two-sample t -test was performed for comparisons. A receiver operating characteristic curve was generated to establish the threshold for normalized iodine concentration (NIC).
Results
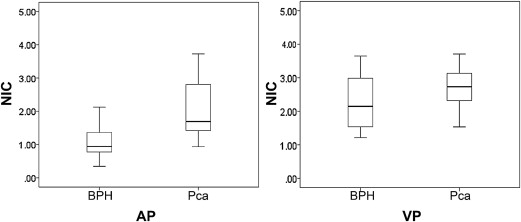
Fifty-two peripheral lesions were found, which were confirmed by biopsy as 28 cases of PCa and 24 BPHs. The NICs of prostate cancers significantly differed from those of the BPHs: 2.38 ± 1.72 compared with 1.21 ± 0.72 in AP, respectively, and 2.67 ± 0.61 compared with 2.27 ± 0.77 in VP. Receiver operating characteristic analysis indicated that an NIC of 1.24 in the AP provided a sensitivity of 88% and a specificity of 71% for differentiating PCa from BPH.
Conclusions
Spectral CT imaging enabled quantitative depiction of contrast medium uptake in prostatic lesions and improved sensitivity and specificity for differentiating PCa from BPH.
Cancer of the prostate (PCa) is the most common cancer in men and the second most common cause of cancer death . PCa and benign prostate hyperplasia (BPH) both rank among the 10 most diagnosed diseases in men over the age of 65 years . Although there is considerable overlap between BPH and PCa in symptom and risk profiles, management approaches are very different and appropriate differential diagnostic evaluation is crucial to achieve the best possible outcomes.
The main diagnostic tools for suspected carcinoma of the prostate are digital rectal examination, prostate-specific antigen (PSA) levels and associated parameters, and color Doppler transrectal sonographically guided biopsy . Although the latter is currently the best technique for detecting cancer in patients with elevated PSA or a positive digital rectal examination, it has its limitations. For example, septic complications after prophylactic antibiotics occur in 1% to 4% of patients and may require aggressive therapy . Therefore, a reliable noninvasive method of distinguishing malignant from benign disease would be of considerable benefit.
Get Radiology Tree app to read full this article<
Get Radiology Tree app to read full this article<
Get Radiology Tree app to read full this article<
Materials and methods
Patients
Get Radiology Tree app to read full this article<
Get Radiology Tree app to read full this article<
Get Radiology Tree app to read full this article<
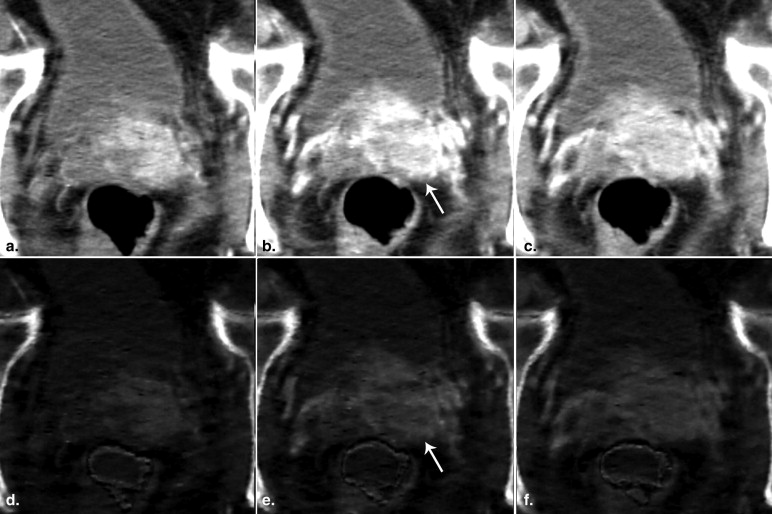
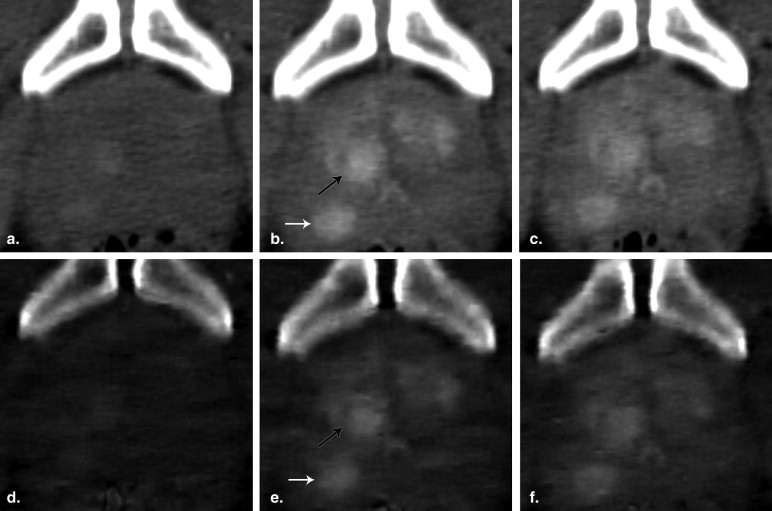
CT Examinations
Get Radiology Tree app to read full this article<
Get Radiology Tree app to read full this article<
Get Radiology Tree app to read full this article<
Image Generation
Get Radiology Tree app to read full this article<
CT Analysis
Get Radiology Tree app to read full this article<
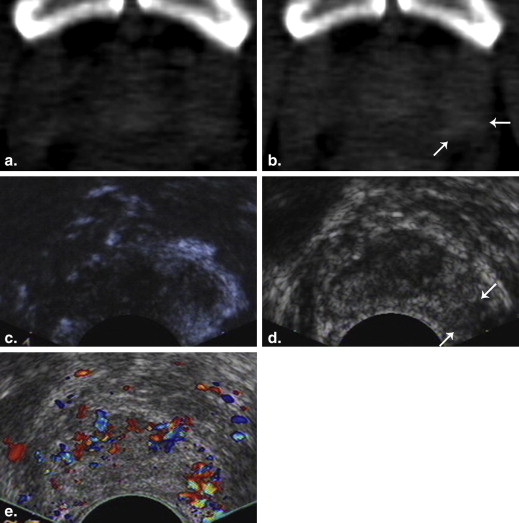
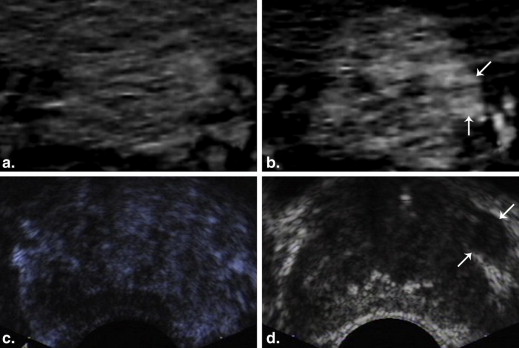
CECD-Targeted Biopsy and Pathological Analysis
Get Radiology Tree app to read full this article<
Get Radiology Tree app to read full this article<
Get Radiology Tree app to read full this article<
Get Radiology Tree app to read full this article<
Get Radiology Tree app to read full this article<
Quantitative Analysis
Get Radiology Tree app to read full this article<
Statistical Analyses
Get Radiology Tree app to read full this article<
Get Radiology Tree app to read full this article<
Get Radiology Tree app to read full this article<
Results
CT and CECD-Targeted Biopsy
Get Radiology Tree app to read full this article<
Image Analysis
Get Radiology Tree app to read full this article<
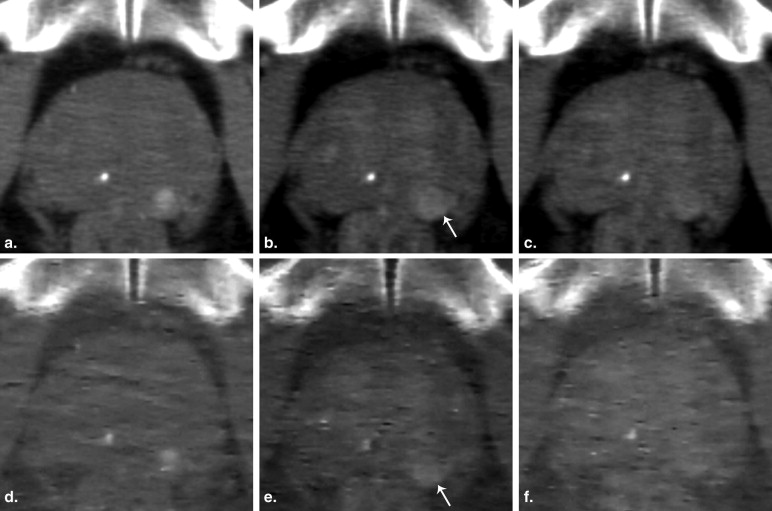
Get Radiology Tree app to read full this article<
Quantitative Analysis
Get Radiology Tree app to read full this article<
Table 1
Quantitative Assessment of Iodine Concentrations and Computed Tomography (CT) Number Differences in Different Scanning Phases between Prostate Cancer (PCa) and Benign Prostate Hyperplasia (BPH)
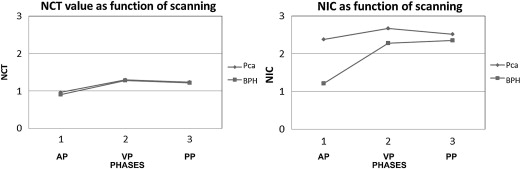
PCa ( n = 28) BPH ( n = 24)P Value ∗ NIC AP † 2.38 ± 1.72 (1.55, 2.09) 1.21 ± 0.72 (0.90, 1.52) .00 (.41, 1.93) NIC VP † 2.67 ± 0.61 (2.35, 2.88) 2.27 ± 0.77 (1.95, 2.60) .04 (0, .78) NIC PP 2.51 ± 0.49 (2.28, 2.70) 2.35 ± 0.82 (2.00, 2.69) .37 (−.20, .53) NCT AP 0.96 ± 0.16 (0.90, 1.04) 0.90 ± 0.30 (0.78, 1.03) .33 (−.07, .19) NCT VP 1.30 ± 0.16 (1.22, 1.36) 1.28 ± 0.40 (1.14, 1.42) .79 (−.12, .16) NCT PP 1.23 ± 0.17 (1.14, 1.29) 1.22 ± 0.33 (1.11, 1.32) .83 (−.11, .13) DNCT VA ‡ 0.34 ± 0.15 (0.26, 0.39) 0.38 ± 0.28 (0.26, 0.50) .47 (−.17, .08) DNCT PV ‡ −0.07 ± 0.13 (−0.13, −0.18) −0.06 ± 0.15 (−0.13, 0) .87 (−.09, .07) DNCT PA ‡ 0.27 ± 0.19 (0.20, 0.34) 0.32 ± 0.31 (0.19, 0.45) .47 (−.19, .09)
AP, arterial phase; VP, venous phase; PP, parenchymal phase.
Value are mean ± SD (95% confidence interval).
Get Radiology Tree app to read full this article<
Get Radiology Tree app to read full this article<
Get Radiology Tree app to read full this article<
Diagnostic Implications
Get Radiology Tree app to read full this article<
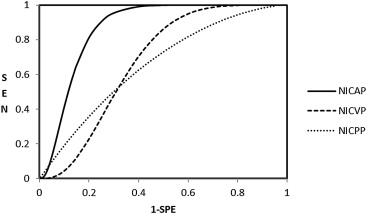
Table 2
ormalized Iodine Concentration (NIC) Thresholds, Sensitivities, and Specificities for Distinguishing Prostate Cancer from Benign Prostate Hyperplasia
Phase AUC ∗ P † Threshold Sensitivity (%) ‡ Specificity (%) ‡ P § NIC AP 0.87 ± 0.05 (0.73, 0.94) .0054 (.06, .35) 1.24 88, 28, (72, 91) 71, 24, (65, 89) .03 NIC VP 0.66 ± 0.08 (0.49, 0.80) 1.96 84, 28, (69, 90) 55, 24, (49, 77) NIC PP 0.63 ± 0.08 (0.47, 0.77) 2.00 87, 28, (74, 90) 42, 24, (41, 68)
AP, arterial phase. VP, venous phase; PP, parenchymal phase.
Get Radiology Tree app to read full this article<
Get Radiology Tree app to read full this article<
Get Radiology Tree app to read full this article<
Get Radiology Tree app to read full this article<
Get Radiology Tree app to read full this article<
Discussion
Get Radiology Tree app to read full this article<
Get Radiology Tree app to read full this article<
P=−ln(II0)=d1μ1(E)+d2μ2(E) P
=
−
ln
(
I
I
0
)
=
d
1
μ
1
(
E
)
+
d
2
μ
2
(
E
)
Get Radiology Tree app to read full this article<
Get Radiology Tree app to read full this article<
Get Radiology Tree app to read full this article<
P′=Pμ1(E)=d1+d2μ2(E)μ1(E) P
′
=
P
μ
1
(
E
)
=
d
1
+
d
2
μ
2
(
E
)
μ
1
(
E
)
Get Radiology Tree app to read full this article<
Get Radiology Tree app to read full this article<
Get Radiology Tree app to read full this article<
Get Radiology Tree app to read full this article<
Get Radiology Tree app to read full this article<
Get Radiology Tree app to read full this article<
Get Radiology Tree app to read full this article<
Get Radiology Tree app to read full this article<
Get Radiology Tree app to read full this article<
References
1. Ferlay J., Parkin D.M., Steliarova-Foucher E.: Estimates of the cancer incidence and mortality in Europe in 2008. Eur J Cancer 2010 Mar; 4: pp. 765-781.
2. Issa M.M., Regan T.S.: Medical therapy for benign prostatic hyperplasia: present and future impact. Am J Manag Care 2007; 13: pp. S4-S9.
3. Arcangeli C.G., Ornstein D.K., Keetch D.W., et. al.: Prostate-specific antigen as a screening test for prostate cancer: the United States experience. Urol Clin North Am 1997; 24: pp. 299-306.
4. Catalona W.J., Beiser J.A., Smith D.S.: Serum free prostate specific antigen and prostate specific antigen density measurements for predicting cancer in men with prior negative prostatic biopsies. J Urol 1997; 158: pp. 2162-2167.
5. Letran J.L., Blase A.B., Loberiza F.R., et. al.: Repeat ultrasound guided prostate needle biopsy: use of free-to-total prostate specimen antigen ratio in predicting prostatic carcinoma. J Urol 1998; 160: pp. 426-429.
6. Kelly I.M., Lees W.R., Rickards D., et. al.: Prostate cancer and the role of color Doppler US. Radiology 1993; 189: pp. 153-156.
7. Rifkin M.D., Sudakoff G.S., Alexander A.A.: Prostate: techniques, results, and potential applications of color Doppler US scanning. Radiology 1993; 186: pp. 509-513.
8. Bree R.L.: The role of color Doppler and staging biopsies in prostate cancer detection. Urology 1997; 49: pp. 31-34.
9. Lavoipierre A.M., Snow R.M., Frydenberg M., et. al.: Prostatic cancer: role of color Doppler imaging in transrectal sonography. AJR Am J Roentgenol 1998; 171: pp. 205-210.
10. Puig J., Darnell A., Bermudez P., et. al.: Transrectal ultra sound-guided prostate biopsy: is antibiotic prophylaxis necessary?. Eur Radiol 2006; 16: pp. 939-943.
11. Sheikh M., Hussein A.Y., Kehinde E.O., et. al.: Patients’ tolerance and early complications of transrectal sonographically guided prostate biopsy: prospective study of 300 patients. J Clin Ultrasound 2005; 33: pp. 452-456.
12. Brown G., Macvicar D.A., Ayton V., et. al.: The role of intravenous contrast enhancement in magnetic resonance imaging of prostatic carcinoma. Clin Radiol 1995; 50: pp. 601-606.
13. Cruz M., Tsuda K., Narumi Y., et. al.: Characterization of low-intensity lesions in the peripheral zone of prostate on pre-biopsy endorectal coil MR imaging. Eur Radiol 2002; 12: pp. 357-365.
14. Price J.M., Davidson A.J.: Computed tomography in the evaluation of the suspected carcinomatous prostate. Urol Radiol 1979; 1: pp. 39-42.
15. Prando A., Wallace Sidney: Helical CT of prostate cancer: early clinical experience. AJR Am J Roentgenol 2000; 175: pp. 343-346.
16. Lin X.Z., Miao F., Li J.Y., et. al.: High-definition CT gemstone spectral imaging of the brain: initial results of selecting optimal monochromatic image for beam-hardening artifacts and image noise reduction. J Comput Assist Tomogr 2011; 35: pp. 294-297.
17. Zhao L.Q., He W., Li J.Y., et. al.: Improving image quality in portal venography with spectral CT imaging. Eur J Radiol 2012; 81: pp. 1677-1681.
18. Lv P.J., Lin X.Z., Li J.Y., et. al.: Differentiation of small hepatic hemangioma from small hepatocellular carcinoma: recently introduced spectral CT method. Radiology 2011; 259: pp. 720-729.
19. Geyer L.L., Scherr M., Körner M., et. al.: Imaging of acute pulmonary embolism using a dual energy CT system with rapid kVp switching: initial results. Eur J Radiol 2011; (March) [Epub ahead of print]
20. Mitterberger M., Aigner F., Pinggera G.M., et. al.: Contrast-enhanced colour Doppler-targeted prostate biopsy: correlation of a subjective blood-flow rating scale with the histopathological outcome of the biopsy. BJU Int 2010; 106: pp. 1315-1318.
21. Padhani A.R., Hayes C., Landau S., et. al.: Reproducibility of quantitative dynamic MRI of normal human tissues. NMR Biomed 2002; 15: pp. 143-153.
22. Dorfman D.D., Alf E.: Maximum likelihood estimation of parameters of signal detection theory—a direct solution. Psychometrika 1968; 33: pp. 117-124.
23. Obuchowski N.A.: ROC analysis. AJR Am J Roentgenol 2005; 184: pp. 364-372.
24. Bigler S.A., Deering R.E., Brawer M.K.: Comparison of microscopic vascularity in benign and malignant prostate tissue. Hum Pathol 1993; 24: pp. 220-226.
25. Hawighorst H., Knapstein P.G., Knopp M.V., et. al.: Cervical carcinoma: standard and pharmacokinetic analysis of time intensity curve for assessment of tumors angiogenesis and patient survival. MAGMA 1999; 8: pp. 55-62.
26. Checkley D., Tessier J.J., Kendrew J., et. al.: Use of dynamic contrast-enhanced MRI to evaluate acute treatment with ZD6474, a VEGF signaling inhibitor, in PC-3 prostate tumors. Br J Cancer 2003; 89: pp. 1889-1895.
27. Wiedenbeck M.: Total x-ray attenuation coefficients from 40KeV to 412KeV. Phys Rev 1962; 126: pp. 1009-1010. (1962)
28. Ferlay J., Autier P., Boniol M., et. al.: Estimates of the cancer incidence and mortality in Europe in 2006. Ann Oncol 2007; 18: pp. 581-592.
29. Halpern E.J., Ramey J.R., Strup S.E.: Detection of prostate carcinoma with contrast-enhanced sonography using intermittent harmonic imaging. Cancer 2005; 104: pp. 2373-2383.
30. Corcetti L., Lencioni R., DeB eni S.: Targeting liver lesions for radiofrequency ablation. An experimental feasibility study using a CT-US fusion imaging system. Invest Radiol 2008; 43: pp. 33-39.