
Rationale and Objectives
The objectives of this study were to measure the parallel changes of transverse relaxation times (T 2 ), spin-lattice relaxation time in the rotating frame (T 1ρ ), and the delayed gadolinium-enhanced magnetic resonance imaging of cartilage (dGEMRIC)-T 1 mapping of human knee cartilage in detecting cartilage degeneration at 3.0T.
Materials and Methods
Healthy volunteers ( n = 10, mean age 35.6 years) and patients ( n = 10, mean age 65 years) with early knee osteoarthritis (OA) were scanned at 3.0T MR using an 8-channel phased array knee coil (transmit–receive). Quantitative assessment of T 2 , T 1ρ , and dGEMRIC-T 1 values (global and regional) were correlated between asymptomatic subjects and patients with OA.
Results
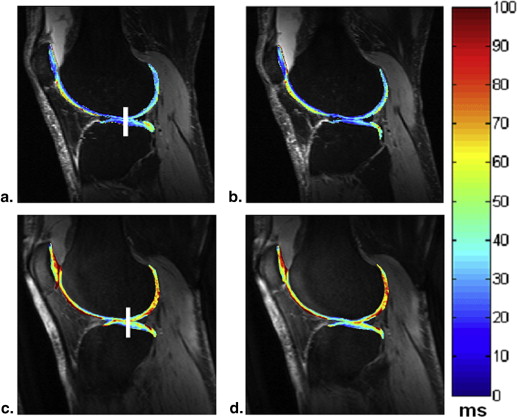
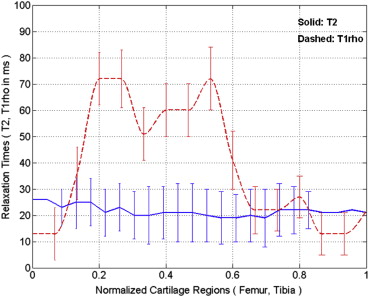
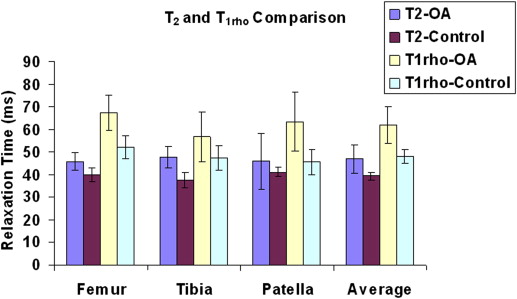
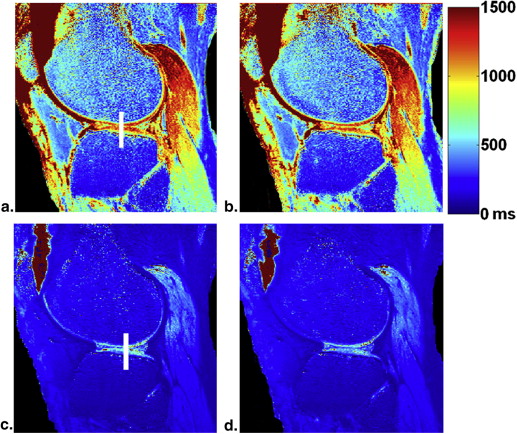
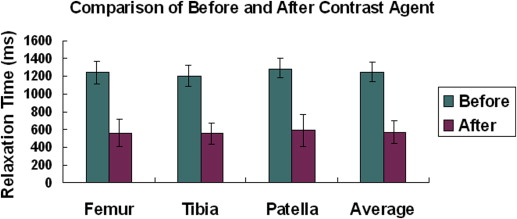
The average T 2 (39 ± 2 milliseconds [mean ± standard deviation] vs. 47 ± 6 milliseconds, P < .0007) and T 1ρ (48 ± 3 vs. 62 ± 8 milliseconds, P < .0002) values were all markedly increased in all patients with OA when compared to healthy volunteers. The average dGEMRIC-T 1 (1244 ± 134 vs. 643 ± 227 milliseconds, P < .000002) value was sharply decreased after intravenous administration of gadolinium contrast agent in all patients with OA.
Conclusions
The research results showed that all the T 2 , T 1ρ , and dGEMRIC-T 1 relaxation times varied with the cartilage degeneration. The dGEMRIC-T 1 and T 1ρ relaxation times seem to be more sensitive than T 2 in detecting early cartilage degeneration. The preliminary study demonstrated that the early biochemical changes in knee osteoarthritic patients could be detected noninvasively in in vivo using T 1ρ and dGEMRIC-T 1 mapping.
The earliest biochemical changes in osteoarthritis (OA) are the modifications at the molecular level of cartilage matrix that occur without obvious morphologic changes . The loss of glycosaminoglycan (GAG) and collagen breakdown are the typical characteristics of early OA.
Several attempts have been made to quantify the changes concerning the loss of GAG in knee cartilage using various quantitative magnetic resonance methods . In recent years, three relaxation methods, based on the measurement of the delayed gadolinium-enhanced magnetic resonance imaging (MRI) of cartilage (dGEMRIC)-T 1 , transverse relaxation times (T 2 ), and spin-lattice relaxation time in the rotating frame (T 1rho or T 1ρ ), have been reported and shown to be promising . The dGEMRIC technique has been validated in both basic scientific and clinical studies by the intravenous injection of negatively charged gadolinium-based contrast agent as a marker of proteoglycan (PG) depletion .
Get Radiology Tree app to read full this article<
Get Radiology Tree app to read full this article<
Materials and methods
Study Population
Get Radiology Tree app to read full this article<
Imaging Hardware
Get Radiology Tree app to read full this article<
Imaging Protocol
Get Radiology Tree app to read full this article<
Get Radiology Tree app to read full this article<
Table 1
Magnetic Resonance Imaging Sequence Parameters
Imaging Parameters 2D MESE 3D GRE 3D FLASH Weighting T2 T1rho T1 Plane Sagittal Sagittal Sagittal Fat sat Yes Yes Yes Matrix 256 × 128 256 × 128 320 × 320 Number of slices 31 30 80 FOV (mm) 150 150 130 Slice thickness (mm) 1.5 3 1.5 Flip angle ( ° ) 180 25 3.9/23 (Before); 5.5/32.5 (After) TE (ms) 16.5/33/49.5/66/82.5 2.04 7.24 TR (ms) 4000 175 17 BW (Hz/pixel) 130 260 130 Interpolated in-plane spatial resolution (mm) 0.59 × 0.59 0.59 × 0.59 0.7 × 0.7 Echo train length 5 1 1 NEX 1 1 2 Duration of each 90 ° pulse (μs) 1536 200 200 Acceleration factor — 2 2 Spin-lock frequency (Hz) — 300 — Time of spin-lock (TSL) [ms] — 2/10/20/30 — Acquisition time 8 minutes 30 seconds 5 minutes 31 seconds/TSL <15 minutes
BW, band width; FLASH, fast low angle shot; FOV, field of view; GRE, gradient recalled echo; MESE, multiecho spin echo (MESE); NEX, number of excitations; TE, echo time; TR, relaxation time.
Get Radiology Tree app to read full this article<
MR Images Analysis and Processing
Get Radiology Tree app to read full this article<
Get Radiology Tree app to read full this article<
Get Radiology Tree app to read full this article<
Results
Get Radiology Tree app to read full this article<
Get Radiology Tree app to read full this article<
Table 2
Average T 2 , T 1ρ (in Milliseconds) Relaxation Times (Mean ± Standard Deviation, n = 10 for Each Group) for Each Cartilage Region
Femur Tibia Patella Average Controls (T 2 ) 40 ± 3 37 ± 4 41 ± 2 39 ± 2 Patients with OA (T 2 ) 46 ± 4 48 ± 5 46 ± 12 47 ± 6 Controls (T 1ρ ) 52 ± 5 47 ± 5 46 ± 6 48 ± 3 Patients with OA (T 1ρ ) 67 ± 8 57 ± 11 64 ± 13 62 ± 8
OA, osteoarthritis.
Get Radiology Tree app to read full this article<
Get Radiology Tree app to read full this article<
Get Radiology Tree app to read full this article<
Get Radiology Tree app to read full this article<
Get Radiology Tree app to read full this article<
Get Radiology Tree app to read full this article<
Get Radiology Tree app to read full this article<
Table 3
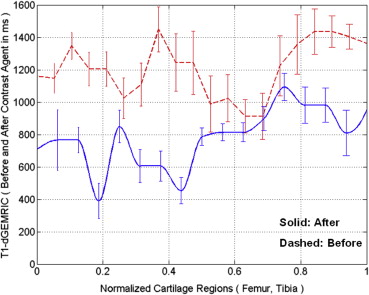
Average T 1 (in Milliseconds) Relaxation Times (Mean ± Standard Deviation, n = 10) before and after Contrast Agent Injection for Each Cartilage Region
Femur Tibia Patella Average Before (T 1 ) 1239 ± 145 1235 ± 148 1304 ± 114 1244 ± 134 After (T 1 ) 639 ± 235 621 ± 193 658 ± 252 643 ± 227
Get Radiology Tree app to read full this article<
Get Radiology Tree app to read full this article<
Get Radiology Tree app to read full this article<
Get Radiology Tree app to read full this article<
Get Radiology Tree app to read full this article<
Get Radiology Tree app to read full this article<
Get Radiology Tree app to read full this article<
Discussion
Get Radiology Tree app to read full this article<
Get Radiology Tree app to read full this article<
Get Radiology Tree app to read full this article<
Get Radiology Tree app to read full this article<
Get Radiology Tree app to read full this article<
Get Radiology Tree app to read full this article<
Get Radiology Tree app to read full this article<
Conclusion
Get Radiology Tree app to read full this article<
Acknowledgments
Get Radiology Tree app to read full this article<
References
1. Menezes N.M., Gray M.L., Hartke J.R., et. al.: T2 and T1rho MRI in articular cartilage systems. Magn Reson Med 2004; 51: pp. 503-509.
2. Pakin S.K., Xu J., Schweitzer M.E., et. al.: Rapid 3D-T1rho mapping of the knee joint at 3.0T with parallel imaging. Magn Reson Med 2006; 56: pp. 563-571.
3. Mlynarik V., Trattnig S., Huber M., et. al.: The role of relaxation times in monitoring proteoglycan depletion in articular cartilage. J Magn Reson Imaging 1999; 10: pp. 497-502.
4. Williams A., Gillis A., McKenzie C., et. al.: Glycosaminoglycan distribution in cartilage as determined by delayed gadolinium-enhanced MRI of cartilage (dGEMRIC): potential clinical applications. AJR Am J Roentgenol 2004; 182: pp. 167-172.
5. McKenzie C.A., Williams A., Prasad P.V., et. al.: Three-dimensional delayed gadolinium-enhanced MRI of cartilage (dGEMRIC) at 1.5T and 3.0T. J Magn Reson Imaging 2006; 24: pp. 928-933.
6. Masi J.N., Newitt D., Sell C.A., et. al.: Optimization of gadodiamide concentration for MR arthrography at 3 T. AJR Am J Roentgenol 2005; 184: pp. 1754-1761.
7. Tiderius C.J., Olsson L.E., Leander P., et. al.: Delayed gadolinium-enhanced MRI of cartilage (dGEMRIC) in early knee osteoarthritis. Magn Reson Med 2003; 49: pp. 488-492.
8. Burstein D., Velyvis J., Scott K.T., et. al.: Protocol issues for delayed Gd(DTPA)(2-)-enhanced MRI (dGEMRIC) for clinical evaluation of articular cartilage. Magn Reson Med 2001; 45: pp. 36-41.
9. Bashir A., Gray M.L., Hartke J., et. al.: Nondestructive imaging of human cartilage glycosaminoglycan concentration by MRI. Magn Reson Med 1999; 41: pp. 857-865.
10. Kimelman T., Vu A., Storey P., et. al.: Three-dimensional T1 mapping for dGEMRIC at 3.0 T using the Look Locker method. Invest Radiol 2006; 41: pp. 198-203.
11. Li X., Benjamin Ma C., Link T.M., et. al.: In vivo T(1rho) and T(2) mapping of articular cartilage in osteoarthritis of the knee using 3T MRI. Osteoarthr Cartilage 2007; 15: pp. 789-797.
12. Maier C.F., Tan S.G., Hariharan H., et. al.: T2 quantitation of articular cartilage at 1.5 T. J Magn Reson Imaging 2003; 17: pp. 358-364.
13. Deichmann R., Adolf H., Noth U., et. al.: Fast T2-mapping with snapshot flash imaging. Magn Reson Imaging 1995; 13: pp. 633-639.
14. McKenzie C.A., Chen Z., Drost D.J., et. al.: Fast acquisition of quantitative T2 maps. Magn Reson Med 1999; 41: pp. 208-212.
15. Regatte R.R., Akella S.V., Borthakur A., et. al.: In vivo proton MR three-dimensional T1rho mapping of human articular cartilage: initial experience. Radiology 2003; 229: pp. 269-274.
16. Regatte R.R., Akella S.V., Borthakur A., et. al.: Proton spin-lock ratio imaging for quantitation of glycosaminoglycans in articular cartilage. J Magn Reson Imaging 2003; 17: pp. 114-121.
17. Akella S.V., Regatte R.R., Gougoutas A.J., et. al.: Proteoglycan-induced changes in T1rho-relaxation of articular cartilage at 4T. Magn Reson Med 2001; 46: pp. 419-423.
18. Redfield A.G.: Nuclear magnetic resonance saturation and rotary saturation in solids. Phys Rev 1955; 98: pp. 1787-1809.
19. Kellgren J.H., Lawrence J.S.: Radiological assessment of osteo-arthrosis. Ann Rheum Dis 1957; 16: pp. 494-502.
20. Nieminen M.T., Menezes N.M., Williams A., et. al.: T2 of articular cartilage in the presence of Gd-DTPA2. Magn Reson Med 2004; 51: pp. 1147-1152.
21. Mosher T.J., Dardzinski B.J.: Cartilage MRI T2 relaxation time mapping: overview and applications. Semin Musculoskelet Radiol 2004; 8: pp. 355-368.
22. Blumenkrantz G., Majumdar S.: Quantitative magnetic resonance imaging of articular cartilage in osteoarthritis. Eur Cell Mater 2007; 13: pp. 76-86.
23. Klocke N.F., Amendola A., Thedens D.R.: Comparison of T1ρ, dGEMRIC, and quantitative T2 MRI in preoperative ACL rupture patients. Acad Radiol 2013; 20: pp. 99-107.
24. Regatte R.R., Akella S.V., Lonner J.H., et. al.: T1rho relaxation mapping in human osteoarthritis (OA) cartilage: comparison of T1rho with T2. J Magn Reson Imaging 2006; 23: pp. 547-553.
25. Friedrich K.M., Shepard T., de Oliveira V.S., et. al.: T2 measurements of cartilage in osteoarthritis patients with meniscal tears. AJR Am J Roentgenol 2009; 193: pp. W411-W415.
26. David-Vaudey E., Ghosh S., Ries M., et. al.: T2 relaxation time measurements in osteoarthritis. Magn Reson Imaging 2004; 22: pp. 673-682.
27. Goodwin D.W., Wadghiri Y.Z., Dunn J.F.: Micro-imaging of articular cartilage: T2, proton density, and the magic angle effect. Acad Radiol 1998; 5: pp. 790-798.
28. Goodwin D.W., Dunn J.F.: High-resolution magnetic resonance imaging of articular cartilage: correlation with histology and pathology. Top Magn Reson Imaging 1998; 9: pp. 337-347.
29. Goodwin D.W., Wadghiri Y.Z., Zhu H., et. al.: Macroscopic structure of articular cartilage of the tibial plateau: influence of a characteristic matrix architecture on MRI appearance. AJR Am J Roentgenol 2004; 182: pp. 311-318.
30. Lammentausta E., Kiviranta P., Nissi M.J., et. al.: T2 relaxation time and delayed gadolinium-enhanced MRI of cartilage (dGEMRIC) of human patellar cartilage at 1.5 T and 9.4 T: relationships with tissue mechanical properties. J Orthop Res 2006; 24: pp. 366-374.
31. Watrin-Pinzano A., Ruaud J.P., Cheli Y., et. al.: Evaluation of cartilage repair tissue after biomaterial implantation in rat patella by using T2 mapping. Magma 2004; 17: pp. 219-228.
32. Watrin-Pinzano A., Ruaud J.P., Cheli Y., et. al.: T2 mapping: an efficient MR quantitative technique to evaluate spontaneous cartilage repair in rat patella. Osteoarthr Cartilage 2004; 12: pp. 191-200.
33. Watrin-Pinzano A., Ruaud J.P., Olivier P., et. al.: Effect of proteoglycan depletion on T2 mapping in rat patellar cartilage. Radiology 2005; 234: pp. 162-170.
34. Xia Y., Farquhar T., Burton-Wurster N., et. al.: Diffusion and relaxation mapping of cartilage-bone plugs and excised disks using microscopic magnetic resonance imaging. Magn Reson Med 1994; 31: pp. 273-282.
35. Xia Y.: Relaxation anisotropy in cartilage by NMR microscopy (muMRI) at 14-microm resolution. Magn Reson Med 1998; 39: pp. 941-949.
36. Dardzinski B.J., Mosher T.J., Li S., et. al.: Spatial variation of T2 in human articular cartilage. Radiology 1997; 205: pp. 546-550.
37. Dardzinski B.J., Laor T., Schmithorst V.J., et. al.: Mapping T2 relaxation time in the pediatric knee: feasibility with a clinical 1.5-T MR imaging system. Radiology 2002; 225: pp. 233-239.
38. Dunn T.C., Lu Y., Jin H., et. al.: T2 relaxation time of cartilage at MR imaging: comparison with severity of knee osteoarthritis. Radiology 2004; 232: pp. 592-598.
39. Mosher T.J., Dardzinski B.J., Smith M.B.: Human articular cartilage: influence of aging and early symptomatic degeneration on the spatial variation of T2-preliminary findings at 3 T. Radiology 2000; 214: pp. 259-266.
40. Mosher T.J., Smith H., Dardzinski B.J., et. al.: MR imaging and T2 mapping of femoral cartilage: in vivo determination of the magic angle effect. AJR Am J Roentgenol 2001; 177: pp. 665-669.
41. Mosher T.J., Smith H.E., Collins C., et. al.: Change in knee cartilage T2 at MR imaging after running: a feasibility study. Radiology 2005; 234: pp. 245-249.
42. Smith H.E., Mosher T.J., Dardzinski B.J., et. al.: Spatial variation in cartilage T2 of the knee. J Magn Reson Imaging 2001; 14: pp. 50-55.
43. Duvvuri U., Reddy R., Patel S.D., et. al.: T1rho-relaxation in articular cartilage: effects of enzymatic degradation. Magn Reson Med 1997; 38: pp. 863-867.
44. Mlynarik V., Szomolanyi P., Toffanin R., et. al.: Transverse relaxation mechanisms in articular cartilage. J Magn Reson 2004; 169: pp. 300-307.
45. Wheaton A.J., Dodge G.R., Elliott D.M., et. al.: Quantification of cartilage biomechanical and biochemical properties via T1rho magnetic resonance imaging. Magn Reson Med 2005; 54: pp. 1087-1093.
46. Wheaton A.J., Dodge G.R., Borthakur A., et. al.: Detection of changes in articular cartilage proteoglycan by T(1rho) magnetic resonance imaging. J Orthop Res 2005; 23: pp. 102-108.
47. Wheaton A.J., Borthakur A., Kneeland J.B., et. al.: In vivo quantification of T1rho using a multislice spin-lock pulse sequence. Magn Reson Med 2004; 52: pp. 1453-1458.
48. Bashir A., Gray M.L., Burstein D.: Gd-DTPA2- as a measure of cartilage degradation. Magn Reson Med 1996; 36: pp. 665-673.
49. Kurkijarvi J.E., Nissi M.J., Kiviranta I., et. al.: Delayed gadolinium-enhanced MRI of cartilage (dGEMRIC) and T2 characteristics of human knee articular cartilage: topographical variation and relationships to mechanical properties. Magn Reson Med 2004; 52: pp. 41-46.
50. Nieminen M.T., Toyras J., Laasanen M.S., et. al.: Prediction of biomechanical properties of articular cartilage with quantitative magnetic resonance imaging. J Biomech 2004; 37: pp. 321-328.
51. Nissi M.J., Toyras J., Laasanen M.S., et. al.: Proteoglycan and collagen sensitive MRI evaluation of normal and degenerated articular cartilage. J Orthop Res 2004; 22: pp. 557-564.
52. Samosky J.T., Burstein D., Eric Grimson W., et. al.: Spatially-localized correlation of dGEMRIC-measured GAG distribution and mechanical stiffness in the human tibial plateau. J Orthop Res 2005; 23: pp. 93-101.
53. Cunningham T., Jessel R., Zurakowski D., et. al.: Delayed gadolinium-enhanced magnetic resonance imaging of cartilage to predict early failure of Bernese periacetabular osteotomy for hip dysplasia. J Bone Joint Surg Am 2006; 88: pp. 1540-1548.
54. Gillis A., Bashir A., McKeon B., et. al.: Magnetic resonance imaging of relative glycosaminoglycan distribution in patients with autologous chondrocyte transplants. Invest Radiol 2001; 36: pp. 743-748.
55. Roos E.M., Dahlberg L.: Positive effects of moderate exercise on glycosaminoglycan content in knee cartilage: a four-month, randomized, controlled trial in patients at risk of osteoarthritis. Arthritis Rheum 2005; 52: pp. 3507-3514.
56. Tiderius C., Hori M., Williams A., et. al.: dGEMRIC as a function of BMI. Osteoarthr Cartilage 2006; 14: pp. 1091-1097.
57. Williams A., Sharma L., McKenzie C.A., et. al.: Delayed gadolinium-enhanced magnetic resonance imaging of cartilage in knee osteoarthritis: findings at different radiographic stages of disease and relationship to malalignment. Arthritis Rheum 2005; 52: pp. 3528-3535.