
Rationale and Objectives
To examine the feasibility of quantitative high-resolution computed tomography (HRCT) findings to monitor the stage of bleomycin-induced pulmonary fibrosis in rabbits by correlating HRCT and pathologic scores and analyzing sequential changes on HRCT images using regional volume histograms.
Materials and Methods
Lung fibrosis was induced by injecting bleomycin intratracheally into 23 Japanese white rabbits. Rabbits were randomly separated into seven groups depending on follow-up period (12-hour, 24-hour, 3-day, 7-day, 14-day, 21-day, and 28-day). Four-row HRCT examinations were performed at any of the seven time points in each follow-up period and just after bleomycin administration in addition to pre-bleomycin administration as the baseline scan. Scores of consolidation, homogenous ground-glass opacity (GGO), inhomogeneous GGO, reticulolinear shadow, and honey-comb formation were recorded as ratio of affected area to total cross-section in four transaxial planes. Inflammatory and fibrous changes were scored histopathologically. Correlations between HRCT and pathologic findings were assessed. Sequential changes on HRCT images in areas with pathologically confirmed fibrosis were assessed on volume histograms of cubic regions of interest (ROI) using quantitative parameters.
Results
Consolidation and inhomogeneous GGO exhibited fair correlations with inflammation scores ( r = 0.273, P = .009, and r = 0.393, P < .001); reticulolinear shadow and inhomogeneous GGO had a fair and good correlation, respectively, with fibrous scores ( r = 0.327, P = .001, and r = 0.579, P < .001). Inhomogeneous GGO was hardly detected on regional images at 21 and 28 days after bleomycin administration. As to mean computed tomography attenuation, skewness, and kurtosis, inhomogeneous GGO differed from reticulolinear shadow and consolidation.
Conclusion
Using appropriate ROI settings, quantitative assessment of inhomogeneous GGO with regional volume histograms enables us to monitor the progression of lung fibrosis by sequential observations.
Idiopathic pulmonary fibrosis (IPF) is a chronic progressive and fatal lung disease; average survival from the time of diagnosis ranges from 3 to 5 years . It is the most common form of idiopathic interstitial pneumonia and is associated with a pathologic pattern known as usual interstitial pneumonia (UIP). Typical high-resolution computed tomography (HRCT) findings of IPF are reticular abnormality, subpleural honeycombing, and traction bronchiectasis of spatially patchy distribution with minimal ground-glass opacity (GGO) . The underlying etiology of IPF and its optimal treatment remain to be identified .
Although the pathogenesis of IPF is not completely understood, proposed factors are injury to the alveolar epithelium followed by not only persistent inflammatory stimulation but also lymphocyte-monocyte interactions that sustain the production of growth factors such as tumor growth factor-β1 , proteolytic enzymes such as arginase-1 and tissue inhibitor of matrix metalloproteinase , and pro-fibrotic cytokines such as interleukin-4 and 13 under the influence of a T H 2 to T H 1 response . The deposition of connective tissue elements that progressively remodel and destroy the normal tissue architecture plays an important role.
Get Radiology Tree app to read full this article<
Get Radiology Tree app to read full this article<
Get Radiology Tree app to read full this article<
Materials and methods
Rabbit Model of Bleomycin-induced Pulmonary Fibrosis
Get Radiology Tree app to read full this article<
Experimental Protocol
Get Radiology Tree app to read full this article<
CT Data Acquisition
Get Radiology Tree app to read full this article<
HRCT Scoring
Get Radiology Tree app to read full this article<
Get Radiology Tree app to read full this article<
Get Radiology Tree app to read full this article<
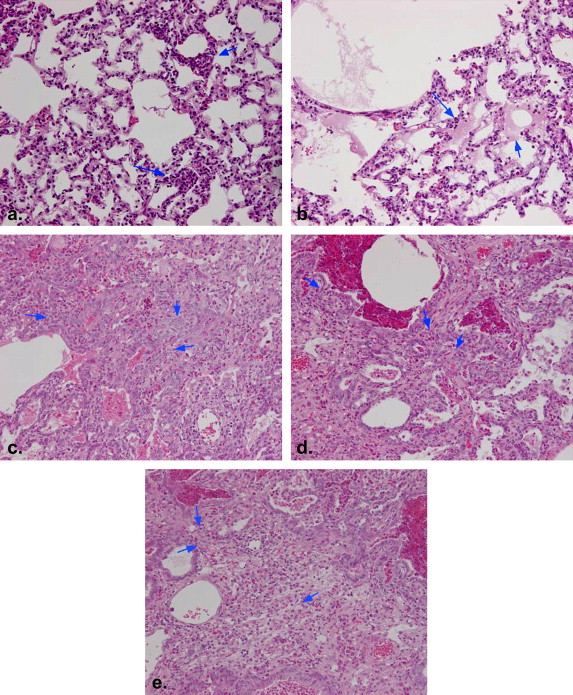
Pathologic Scoring
Get Radiology Tree app to read full this article<
Serial Change of the HRCT Images in Rabbits with the Pathologically Proven Fibrosis
Get Radiology Tree app to read full this article<
Statistical Analysis
Get Radiology Tree app to read full this article<
Get Radiology Tree app to read full this article<
Results
Get Radiology Tree app to read full this article<
Get Radiology Tree app to read full this article<
Comparison of Values Obtained at Different Postadministration Time Points
Get Radiology Tree app to read full this article<
Table 1
HRCT and Pathologic Scores in Different Intervals
Consolidation Homogeneous Inhomogeneous Reticulolinear Honey-comb Inflammation Fibrosis GGO GGO Shadow Formation Score Score 12-hour 0.007 ± 0.034 0.096 ± 0.157 0.001 ± 0.003 0.003 ± 0.012 0.000 ± 0.000 6.17 ± 2.51 0.00 ± 0.00 24-hour 0.013 ± 0.055 0.077 ± 0.115 0.012 ± 0.051 0.004 ± 0.011 0.000 ± 0.000 7.33 ± 3.40 0.00 ± 0.00 3-day 0.044 ± 0.103 0.055 ± 0.082 0.027 ± 0.042 0.005 ± 0.012 0.000 ± 0.000 5.67 ± 3.54 0.00 ± 0.00 7-day 0.057 ± 0.093 0.083 ± 0.081 0.116 ± 0.183 0.013 ± 0.035 0.000 ± 0.000 11.08 ± 2.98 4.80 ± 2.27 14-day 0.079 ± 0.156 0.117 ± 0.112 0.124 ± 0.106 0.014 ± 0.023 0.000 ± 0.000 10.33 ± 3.24 4.67 ± 2.32 21-day 0.023 ± 0.051 0.112 ± 0.093 0.099 ± 0.104 0.116 ± 0.096 0.000 ± 0.000 10.25 ± 3.74 2.33 ± 1.80 28-day 0.008 ± 0.015 0.202 ± 0.144 0.082 ± 0.061 0.182 ± 0.109 0.000 ± 0.000 6.83 ± 3.51 2.16 ± 2.11
GGO, ground-glass opacity; HRCT, high-resolution computed tomography.
Data are mean ± standard deviation.
Get Radiology Tree app to read full this article<
Get Radiology Tree app to read full this article<
Correlation Between HRCT and Pathologic Scores
Get Radiology Tree app to read full this article<
Table 2
Correlation of HRCT Score with Pathologic Score
Inflammation Score Fibrosis Score r Value_P_ Value r Value_P_ Value Consolidation 0.273 ∗ .009 0.160 .128 Homogeneous GGO 0.026 .807 0.058 .580 Inhomogeneous GGO 0.393 ∗ <.001 0.579 ∗ <.001 Reticulolinear shadow 0.137 .193 0.327 ∗ .001
GGO, ground-glass opacity; HRCT, high-resolution computed tomography.
Get Radiology Tree app to read full this article<
Get Radiology Tree app to read full this article<
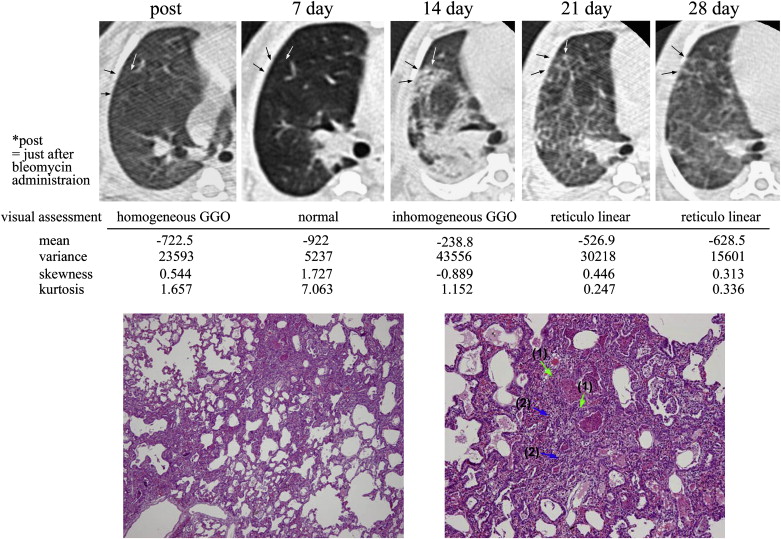
Serial Changes on HRCT Images of Lungs with Pathologically Confirmed Fibrosis
Get Radiology Tree app to read full this article<
Table 3
Serial Change of HRCT Images in Regions with Pathologically Proven Pulmonary Fibrosis
Post 3-day 7-day 14-day 21-day 28-day FS Lobe Post 3-day 7-day 14-day 21-day 28-day FS Lobe N N N HG N RL 1 RM N N N HG HG RL 5 LP HG N HG RL RL RL 1 RM N N HG RL 5 LP N N N HG HG 2 LA HG IG C 5 LP HG HG C RL RL RL 2 LP HG N HG RL 5 LP HG HG HG IG RL RL 2 LP HG HG IG IG RL RL 5 RP N N N 2 LP HG C C C IG 5 RP HG N HG IG RL 3 LA HG IG IG IG 5 RP N HG HG N 3 LA HG HG IG 5 RP HG HG IG 3 LA N N N HG 6 LA HG N HG IG RL 3 LP HG HG IG 6 LP HG C C C HG 3 RM HG N HG IG RL RL 6 RM HG IG IG IG 3 RM HG N RL 6 RM HG N N RL IG RL 3 RP HG IG IG RL 6 RM HG N RL IG RL RL 4 LA HG HG N C RL RL 6 RP HG IG C 4 LA HG C IG IG 6 RP HG N RL IG RL RL 4 LP HG C IG 6 RP N N N HG HG 4 LP HG HG IG IG 6 RP HG N HG IG RL 4 RP N N N HG 7 LA HG IG IG IG RL 4 RM HG IG RL 7 RP HG N IG IG RL RL 5 LA HG HG RL 9 RM HG IG IG 5 LA HG RL IG RL 9 RM
C, consolidation; FS, fibrotic score; GGO, ground-glass opacity; HG, homogeneous GGO; HRCT, high-resolution computed tomography; IG, inhomogeneous GGO; LA, left anterior lobe; LP, left posterior lobe; N, normal lung; post, just after bleomycin administration; RL, reticulolinear shadow; RM, right middle lobe; RP, right posterior lobe.
Get Radiology Tree app to read full this article<
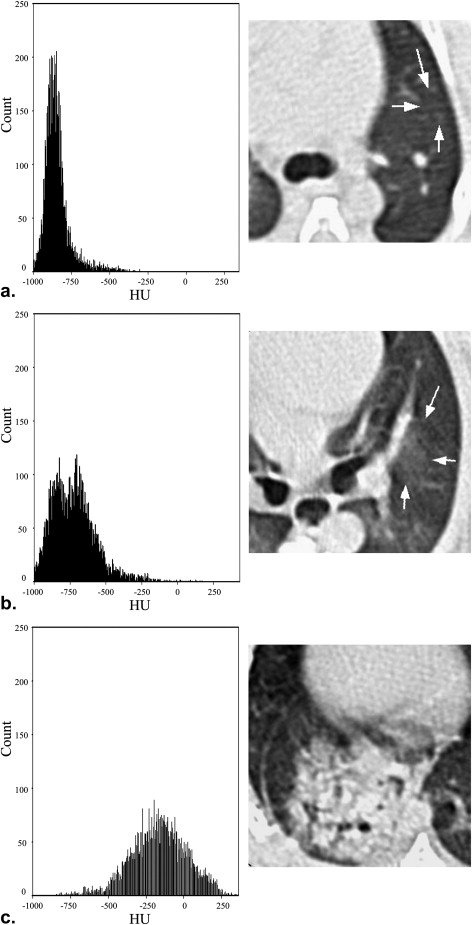
Volume Histograms of 5 HRCT Findings Using Cubic ROI
Get Radiology Tree app to read full this article<
Table 4
Parameters for Volume Histogram in Different HRCT Findings
Mean Variance Skewness Kurtosis Normal lung −811.2 ± 69.3 10883 ± 5241 1.51 ± 0.64 4.34 ± 3.65 Homogeneous GGO −634.3 ± 112.5 27330 ± 19366 0.76 ± 0.54 1.39 ± 1.32 Reticulolinear Shadow −472.5 ± 90.5 48551 ± 29398 0.51 ± 0.48 0.11 ± 0.74 Inhomogeneous GGO −224.0 ± 108.9 55555 ± 28767 −0.53 ± 0.45 0.38 ± 1.08 Consolidation −64.8 ± 80.9 58304 ± 40895 −1.74 ± 0.46 4.44 ± 2.87
Data are mean ± standard deviation.
Get Radiology Tree app to read full this article<
Discussion
Get Radiology Tree app to read full this article<
Get Radiology Tree app to read full this article<
Get Radiology Tree app to read full this article<
Get Radiology Tree app to read full this article<
Get Radiology Tree app to read full this article<
Get Radiology Tree app to read full this article<
Get Radiology Tree app to read full this article<
Get Radiology Tree app to read full this article<
References
1. Collard H.R., King T.E., Bartelson B.B., et. al.: Changes in clinical and physiologic variables predict survival in idiopathic pulmonary fibrosis. Am J Respir Crit Care Med 2003; 168: pp. 538-542.
2. Flaherty K.R., Mumford J.A., Murray S., et. al.: Prognostic implications of physiologic and radiographic changes in idiopathic interstitial pneumonia. Am J Respir Crit Care Med 2003; 168: pp. 543-548.
3. Bjoraker J.A., Ryu J.H., Edwin M.K., et. al.: Prognostic significance of histopathologic subsets in idiopathic pulmonary fibrosis. Am J Respir Crit Care Med 1998; 157: pp. 199-203.
4. Hunninghake G.W., Lynch D.A., Galvin J.R., et. al.: Radiologic findings are strongly associated with a pathologic diagnosis of usual interstitial pneumonia. Chest 2003; 124: pp. 1215-1223.
5. American Thoracic Society/European Respiratory Society: American Thoracic Society/European Respiratory Society international multidisciplinary consensus classification of the idiopathic interstitial pneumonias. Am J Respir Crit Care Med 2002; 165: pp. 277-304.
6. Mason R.J., Schwarz M.I., Hunninghake G.W., et. al.: NHLBI workshop summary. Pharmacological theraphy for idiopathic pulmonary fibrosis. Past, present, and future. Am J Respir Crit Care Med 1999; 160: pp. 1771-1777.
7. Sime P.J., Xing Z., Graham F.L., et. al.: Adenovector-mediated gene transfer of active transforming growth factor-β1 induces prolonged severe fibrosis in rat lung. J Clin Invest 1997; 100: pp. 768-776.
8. Decitre M., Gleyzal C., Raccurt M., et. al.: Lysyl oxidase-like protein localizes to sites of de novo fibrinogenesis in fibrosis and in the early stromal reaction of ductal breast carcinomas. Lab Invest 1998; 78: pp. 143-151.
9. Blease K., Jakubzick C., Westwick J., et. al.: Therapeutic effect of IL-13 immunoneutralization during chronic experimental fungal asthma. J Immunol 2001; 166: pp. 5219-5224.
10. Sandler N.G., Mentink-Kane M.M., Cheever A.W., et. al.: Global gene expression profiles during acute pathogen-induced pulmonary inflammation reveal divergent roles for T H 1 and T H 2 responses in tissue repair. J Immunol 2003; 171: pp. 3655-3667.
11. Günther A., Lübke N., Ermert M., et. al.: Prevention of bleomycin-induced lung fibrosis by aerosolization of heparin or urokinase in rabbits. Am J Respir Crit Care Med 2003; 168: pp. 1358-1365.
12. Daniels D.E., Wilkes M.C., Edens M., et. al.: Imatinib mesylate inhibits the profibrogenic activity of TGF-beta and prevents bleomycin-mediated lung fibrosis. J Clin Invest 2004; 114: pp. 1308-1316.
13. Kim J.H., Kim H.Y., Kim S., et. al.: Natural killer T (NKT) cells attenuate bleomycin-induced pulmonary fibrosis by producing interferon-gamma. Am J Pathol 2005; 167: pp. 1231-1241.
14. Keogh K.A., Standing J., Kane G.C., et. al.: Angiotensin Π antagonism fails to ameliorate bleomycin-induced pulmonary fibrosis in mice. Eur Respir J 2005; 25: pp. 708-714.
15. Aono Y., Nishioka Y., Inayama M., et. al.: Imatinib as a novel antifibrotic agent in bleomycin-induced pulmonary fibrosis in mice. Am J Respir Crit Care Med 2005; 171: pp. 1279-1285.
16. Hutson P.R., Crawford M.E., Sorkness R.L.: Liquid chromatographic determination of hydroxyproline in tissue samples. J Chromatogr B Analyt Technol Biomed Life Sci 2003; 791: pp. 427-430.
17. Lee H.J., Goo J.M., Kim N.R., et. al.: Semiquantitative measurement of murine bleomycin-induced lung fibrosis in in-vivo and postmortem conditions using microcomputed tomography: correlation with pathologic scores—initial results. Invest Radiol 2008; 43: pp. 453-460.
18. Bland J.M., Altman D.G.: Statistical methods for assessing agreement between two methods of clinical measurement. Lancet 1986; 1: pp. 307-310.
19. Cherniack R.M., Colby T.V., Flint A., et. al.: Quantitative assessment of lung pathology in idiopathic pulmonary fibrosis. The BAL Cooperative Group Steering Committee. Am Rev Respir Dis 1991; 144: pp. 892-900.
20. Sumikawa H., Johkoh T., Yamamoto S., et. al.: Computed tomography values calculation and volume histogram analysis for various computed tomographic patterns of diffuse lung diseases. J Comput Assist Tomogr 2009; 33: pp. 731-738.
21. Paulus M.J., Geason S.S., Easterly M.E., et. al.: A review of high-resolution X-ray computed tomography and other imaging modalities for small animal research. Lab Anim (NY) 2001; 30: pp. 36-45.
22. Coultas D.B., Zumwalt R.E., Black W.C., et. al.: The epidemiology of interstitial lung diseases. Am J Respir Crit Care Med 1994; 150: pp. 967-972.
23. Lindenschmidt R.C., Tryka A.F., Godfrey G.A., et. al.: Intratracheal versus intravenous administration of bleomycin in mice: acute effects. Toxicol Appl Pharmacol 1986; 85: pp. 69-77.
24. Balazs G., Noma S., Khan A., et. al.: Bleomycin-induced fibrosis in pigs: evaluation with CT. Radiology 1994; 191: pp. 232-236.
25. Amber L.D., Harikrishna T., Xiaochuan C.X., et. al.: Repetitive intratracheal bleomycin models several features of idiopathic pulmonary fibrosis. Am J Physiol Lung Cell Mol Physiol 2010; 299: pp. L442-L452.
26. Chung M.P., Monick M.M., Hamzeh N.Y., et. al.: Role of repeated lung injury and genetic background in bleomycin-induced fibrosis. Am J Respir Cell Mol boil 2003; 29: pp. 375-380.
27. Gurujeyalakshmi G., Giri S.N.: Molecular mechanisms of antifibrotic effect of interferon-γ in bleomycin-mouse model of lung fibrosis: downregulation of TGF-β and procollagen І and Ш gene expression. Exp Lung Res 1995; 21: pp. 791-808.
28. Keane M.P., Belperio J.A., Burdick M.D., et. al.: IL-12 attenuates bleomycin-induced pulmonary fibrosis. Am J Physiol Lung Cell 2001; 281: pp. L92-L97.
29. Sumikawa H., Johkoh T., Ichikado K., et. al.: Usual interstitial pneumonia and chronic idiopathic interstitial pneumonia: analysis of CT appearance in 92 patients. Radiology 2006; 241: pp. 258-266.
30. Honda O., Johkoh T., Tomiyama N., et. al.: High resolution CT using multidetector CT equipment: evaluation of image quality in 11 cadaveric lungs and a phantom. AJR Am J Roentogenol 2001; 177: pp. 179-184.
31. Sumikawa H., Johkoh T., Yamamoto S., et. al.: Volume histogram analysis for lung thin-section computed tomography: differentiation between usual interstitial pneumonia and nonspecific interstitial pneumonia. J Comput Assist Tomogr 2007; 31: pp. 936-942.
32. Matsuoka S., Kurihara Y., Yagihashi K., et. al.: Quantification of this-section CT lung attenuation in acute pulmonary embolism correlations with arterial blood gas levels and CT angiography. AJR Am J Roentogenol 2006; 186: pp. 1272-1279.