
Rationale and Objectives
To correlate prognostic histologic features and immunohistochemical biomarkers of breast cancer with quantitative shear wave elastography (SWE) parameters.
Materials and Methods
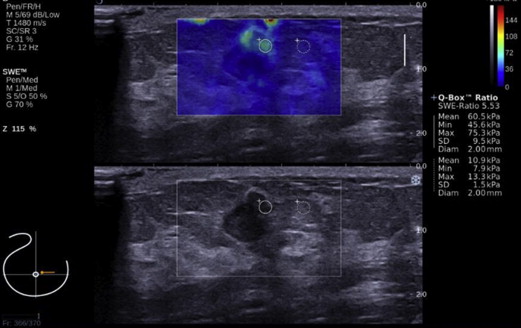
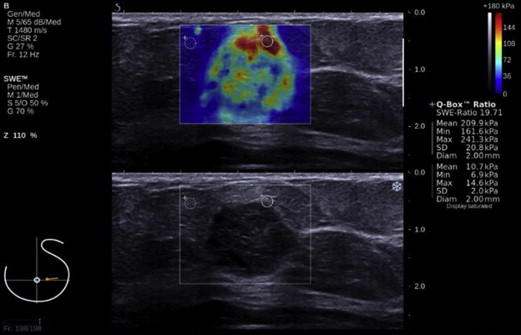
B-mode ultrasound (US) and SWE were performed before core biopsy on 72 cancers in 68 patients. Mean cancer size was determined from US. Histologic grade, lymph node status, lymphovascular invasion (LVI), histologic type, and immunohistochemical biomarkers (estrogen receptor, progesterone receptor, human epidermal growth factor receptor 2 [HER2]) were determined from surgical pathology reports. Correlation between these features and quantitative SWE parameters (mean elasticity [E mean], maximum elasticity [E max], and elasticity ratio [E ratio]) was made.
Results
There was significant correlation of mean cancer size with E mean, E max, and E ratio (correlation, 0.492, 0.500, and 0.435, respectively; all P < .001). Lymph node involvement was associated with significantly higher E max ( P = .040). LVI was associated with significantly higher E mean, E max, and E ratio ( P = .002, .004, and .042, respectively). There was no significant correlation of histologic grade with SWE parameters. HER2+ cancers were associated with significantly higher E ratio ( P = .030). In multivariate analysis, only mean cancer size was significantly correlated with E mean and E max ( P < .001).
Conclusions
There was significant correlation of cancer size with SWE parameters. There was significant correlation of lymph node status and LVI with SWE, but only on univariate analysis. SWE has the potential to provide prognostic information of breast cancer in a noninvasive manner, but further study is required.
Breast cancer is a heterogeneous disease, with different histologic types, clinical course, response to treatment, and prognosis. The prognostic histologic features of breast cancer include invasive size, lymph node status , histologic grade , lymphovascular invasion (LVI), and histologic type . Molecular profiling of breast cancer by gene expression array analysis classifies breast cancers into different subtypes. There is correlation of the different molecular subtypes with the response to systemic therapy . There is also a significant correlation between the different histologic types of breast cancer and their molecular subtypes . Because gene expression array analysis has strict tissue requirements and is not always available, immunohistochemical study is used as a surrogate with determination of the expression of the following cancer biomarkers: estrogen receptor (ER), progesterone receptor (PR), and human epidermal growth factor receptor 2 (HER2) . Three major subtypes are defined: ER positive (ER+ [ER+, PR+/−, and HER2−/+]), HER2 positive (HER2+ [ER−, PR−, and HER2+]), and triple negative (TN [ER−, PR−, and HER2−]). These immunohistochemical subtypes correspond approximately to the molecular subtypes of luminal A (ER+, PR+/−, HER2−; low grade)/luminal B (ER+, PR+/−, HER2−; high grade or ER+, PR+/−, HER2+), HER2 enriched and basal-like, respectively. The luminal A subtype has the best prognosis and the basal-like subtype the worst prognosis .
Core biopsy is performed to obtain samples for analysis of histologic and immunohistochemical features of breast cancer. However, these limited biopsy samples are inadequate for assessment of the entire range of intratumoral heterogeneity, which can influence the course of tumor progression and treatment . Imaging of the entire tumor for prognostic features can potentially add useful information to that obtained from tissue biopsy.
Get Radiology Tree app to read full this article<
Get Radiology Tree app to read full this article<
Get Radiology Tree app to read full this article<
Get Radiology Tree app to read full this article<
Materials and methods
Get Radiology Tree app to read full this article<
Get Radiology Tree app to read full this article<
Get Radiology Tree app to read full this article<
Get Radiology Tree app to read full this article<
Get Radiology Tree app to read full this article<
Get Radiology Tree app to read full this article<
Get Radiology Tree app to read full this article<
Statistical Analysis
Get Radiology Tree app to read full this article<
Get Radiology Tree app to read full this article<
Get Radiology Tree app to read full this article<
Results
Descriptive Statistics of Demographic and Clinical Characteristics
Get Radiology Tree app to read full this article<
Get Radiology Tree app to read full this article<
Get Radiology Tree app to read full this article<
Get Radiology Tree app to read full this article<
Get Radiology Tree app to read full this article<
Get Radiology Tree app to read full this article<
Get Radiology Tree app to read full this article<
Get Radiology Tree app to read full this article<
Get Radiology Tree app to read full this article<
Mean Cancer Size
Get Radiology Tree app to read full this article<
Histologic Grade
Get Radiology Tree app to read full this article<
Table 1
Correlation of Histologic Grade with SWE Parameters
SWE Parameter Grade_n_ Mean ± SD Range E mean 1 12 127.37 ± 76.82 26.90–286.30P ∗ = .247 2 29 131.48 ± 78.52 16.20–292.90 3 26 163.39 ± 77.86 32.70–300.00 E max 1 12 150.65 ± 86.33 29.80–300.00P = .241 2 29 156.60 ± 89.39 20.00–300.00 3 26 193.87 ± 89.15 37.10–300.00 E ratio 1 12 7.23 ± 3.34 2.30–13.01P = .152 2 29 12.28 ± 12.83 1.83–62.63 3 26 13.18 ± 9.48 2.55–41.43
E max, maximum elasticity; E mean, mean elasticity; E ratio, elasticity ratio; SD, standard deviation; SWE, shear wave elastography.
Get Radiology Tree app to read full this article<
Get Radiology Tree app to read full this article<
Lymph Node Status
Get Radiology Tree app to read full this article<
Table 2
Correlation of Lymph Node Status with SWE Parameters
Variable Negative Lymph Node Status ( n = 36) Positive Lymph Node Status ( n = 22)P ∗ Value Mean ± SD Range Mean ± SD Range E mean 129.99 ± 76.41 16.20–292.90 169.85 ± 78.86 39.60–300.00 .062 E max 154.40 ± 87.21 20.00–300.00 204.07 ± 87.70 46.80–300.00 .040 E ratio 12.18 ± 12.62 1.83–62.63 12.40 ± 8.15 5.36–34.52 .941
E max, maximum elasticity; E mean, mean elasticity; E ratio, elasticity ratio; SD, standard deviation; SWE, shear wave elastography.
Get Radiology Tree app to read full this article<
Get Radiology Tree app to read full this article<
Lymphovascular Invasion
Get Radiology Tree app to read full this article<
Table 3
Correlation of LVI with SWE Parameters
Variable Without LVI ( n = 43) With LVI ( n = 27)P ∗ Value Mean ± SD Range Mean ± SD Range E mean 121.15 ± 67.90 16.20–240.60 177.63 ± 80.44 42.50–300.00 .002 E max 146.96 ± 82.82 20.00–300.00 209.04 ± 86.33 53.30–300.00 .004 E ratio 9.23 ± 7.71 1.83–36.40 15.05 ± 12.98 5.36–62.63 .042
E max, maximum elasticity; E mean, mean elasticity; E ratio, elasticity ratio; LVI, lymphovascular invasion; SD, standard deviation; SWE, shear wave elastography.
Get Radiology Tree app to read full this article<
Get Radiology Tree app to read full this article<
Immunohistochemical Biomarkers
Get Radiology Tree app to read full this article<
Table 4
Correlation of Immunohistochemical Biomarkers with SWE Parameters
Biomarker Variable Biomarker− Biomarker+ Mean ± SD Range Mean ± SD Range ER− ( n = 10), ER+ ( n = 57) E mean ( P ∗ = .438) 159.76 ± 63.66 59.60–237.00 142.35 ± 79.67 16.20–300.00 E max ( P = .629) 185.97 ± 74.95 71.80–283.40 171.06 ± 90.89 20.00–300.00 E ratio ( P = .941) 9.71 ± 5.14 2.55–15.34 12.06 ± 11.11 1.83–62.63 PR− ( n = 17), PR+ ( n = 50) E mean ( P = .980) 142.38 ± 66.19 48.90–237.00 145.75 ± 81.32 16.20–300.00 E max ( P = .930) 170.20 ± 78.03 57.80–300.00 174.27 ± 92.27 20.00–300.00 E ratio ( P = .700) 11.17 ± 7.52 2.55–33.24 11.90 ± 11.32 1.83–62.63 HER2− ( n = 53), HER2+ ( n = 14) E mean ( P = .259) 152.27 ± 78.54 16.20–300.00 123.06 ± 69.83 39.60–257.00 E max ( P = .162) 182.97 ± 89.19 20.00–300.00 143.46 ± 79.73 46.80–300.00 E ratio ( P = .030) 11.21 ± 11.15 1.83–62.63 14.08 ± 7.49 5.54–33.24
E max, maximum elasticity; E mean, mean elasticity; ER, estrogen receptor; E ratio, elasticity ratio; HER2, human epidermal growth factor receptor 2; PR, progesterone receptor; SD, standard deviation; SWE, shear wave elastography.
Get Radiology Tree app to read full this article<
Get Radiology Tree app to read full this article<
Get Radiology Tree app to read full this article<
Histologic Type
Get Radiology Tree app to read full this article<
Table 5
Correlation of Histologic Type with SWE Parameters
SWE Parameter Histologic Type_n_ Mean ± SD Range E mean DCIS 5 79.52 ± 56.07 32.70–177.00 P ∗ = .076 IDC 64 141.70 ± 75.79 16.20–300.00 ILC 1 286.30 286.30–286.30 IMC 2 219.10 ± 13.01 209.90–228.30 E max DCIS 5 95.36 ± 72.11 37.10–221.20P = .067 IDC 64 169.76 ± 86.94 20.00–300.00 ILC 1 300.00 300.00–300.00 IMC 2 270.65 ± 41.51 241.30–300.00 E ratio DCIS 5 4.92 ± 1.98 2.98–7.68P = .031 IDC 64 11.31 ± 10.30 1.83–62.63 ILC 1 13.01 13.01–13.01 IMC 2 27.12 ± 10.47 19.71–34.52
DCIS, ductal carcinoma in situ; E max, maximum elasticity; E mean, mean elasticity; E ratio, elasticity ratio; IDC, invasive ductal cancer; IMC, invasive mucinous carcinoma; SD, standard deviation; SWE, shear wave elastography.
Get Radiology Tree app to read full this article<
Get Radiology Tree app to read full this article<
Multivariate Analysis
Get Radiology Tree app to read full this article<
Correlation of Cancer Size and Lymph Node Status
Get Radiology Tree app to read full this article<
Correlation of Cancer Size and LVI
Get Radiology Tree app to read full this article<
Discussion
Get Radiology Tree app to read full this article<
Get Radiology Tree app to read full this article<
Get Radiology Tree app to read full this article<
Get Radiology Tree app to read full this article<
Get Radiology Tree app to read full this article<
Get Radiology Tree app to read full this article<
Get Radiology Tree app to read full this article<
Get Radiology Tree app to read full this article<
Get Radiology Tree app to read full this article<
Get Radiology Tree app to read full this article<
Get Radiology Tree app to read full this article<
Get Radiology Tree app to read full this article<
Get Radiology Tree app to read full this article<
Get Radiology Tree app to read full this article<
Get Radiology Tree app to read full this article<
References
1. Carter C.L., Allen C., Henson D.E.: Relation of tumor size, lymph node status, and survival in 24,740 breast cancer cases. Cancer 1989; 63: pp. 181-187.
2. Elston C.W., Ellis I.O.: Pathological prognostic factors in breast cancer: 1. The value of histological grade in breast cancer: experience from a large study with long-term follow-up. Histopathology 1991; 19: pp. 403-410.
3. Rakha E.A., Martin S., Lee A.H., et. al.: The prognostic significance of lymphovascular invasion in invasive breast carcinoma. Cancer 2012; 118: pp. 3670-3680.
4. Bijker N., Donker M., Wesseling J., et. al.: Is DCIS breast cancer, and how do I treat it?. Curr Treat Options Oncol 2013; 14: pp. 75-87.
5. Iorfida M., Maiorano E., Orvieto E., et. al.: Invasive lobular breast cancer: subtypes and outcome. Breast Cancer Res Treat 2012; 133: pp. 713-723.
6. Perou C.M., Sorlie T., Eisen M.B., et. al.: Molecular portraits of human breast tumours. Nature 2000; 406: pp. 747-752.
7. Sorlie T.: Molecular portraits of breast cancer: tumour subtypes as distinct disease entities. Eur J Cancer 2004; 40: pp. 2667-2675.
8. Desmedt C., Haibe-Kains B., Wirapati P., et. al.: Biological processes associated with breast cancer clinical outcome depend on the molecular subtypes. Clin Cancer Res 2008; 14: pp. 5158-5165.
9. Cadoo K.A., Traina T.A., King T.A.: Advances in molecular and clinical subtyping of breast cancer and their implications for therapy. Surg Oncol Clinic N Am 2013; 22: pp. 823-840.
10. Caldarella A., Buzzoni C., Crocetti E., et. al.: Invasive breast cancer: a significant correlation between histological types and molecular subgroups. J Cancer Res Clin Oncol 2013; 139: pp. 617-623.
11. Tang P., Skinner K.A., Hicks D.G.: Molecular classification of breast carcinomas by immunohistochemical analysis: are we ready?. Diag Mol Pathol 2009; 18: pp. 125-132.
12. Bhargava R., Striebel J., Beriwal S., et. al.: Prevalence, morphologic features and proliferation indices of breast carcinoma molecular classes using immunohistochemical surrogate markers. Int J Clin Exp Pathol 2009; 2: pp. 444-455.
13. Sanchez-Munoz A., Garcia-Tapiador A.M., Martinez-Ortega E., et. al.: Tumor molecular subtyping according to hormone receptors and HER2 status defines different pathological complete response to neoadjuvant chemotherapy in patients with locally advanced breast cancer. Clin Transl Oncol 2008; 10: pp. 646-653.
14. Strehl J.D., Wachter D.L., Fasching P.A., et. al.: Invasive breast cancer: recognition of molecular subtypes. Breast Care (Basel) 2011; 6: pp. 258-264.
15. Boyle P.: Triple-negative breast cancer: epidemiological considerations and recommendations. Ann Oncol 2012; 23: pp. vi7-vi12.
16. Ashraf A.B., Daye D., Gavenonis S., et. al.: Identification of intrinsic imaging phenotypes for breast cancer tumors: preliminary associations with gene expression profiles. Radiology 2014; 272: pp. 374-384.
17. Sarvazyan A.P., Rudenko O.V., Swanson S.D., et. al.: Shear wave elasticity imaging: a new ultrasonic technology of medical diagnosis. Ultrasound Med Biol 1998; 20: pp. 1419-1436.
18. Nightingale K.R., McAleavey S.A., Trachey G.E.: Shear-wave generation using acoustic radiation force: in vivo and ex vivo results. Ultrasound Med Biol 2003; 29: pp. 1715-1723.
19. Bercoff J., Tanter M., Fink M.: Supersonic shear imaging: a new technique for soft tissue elasticity mapping. IEEE Tran Ultrason Ferroelect Freq Control 2004; 51: pp. 396-409.
20. Sarvazyan A.P.: Biophysical bases of elasticity imaging.1995.PlenumNew York, NY:pp. 223-240.
21. Tozaki M., Fukuma E.: Pattern classification of ShearWave Elastography images for differential diagnosis between benign and malignant solid breast masses. Acta Radiol 2011; 52: pp. 1069-1075.
22. Gweon H.M., Youk J.H., Son E.J., et. al.: Clinical application of qualitative assessment for breast masses in shear-wave elastography. Eur J Radiol 2013; 82: pp. e680-e685.
23. Athanasiou A., Tardivon A., Tanter M., et. al.: Breast lesions: quantitative elastography with supersonic shear imaging—preliminary results. Radiology 2010; 256: pp. 297-303.
24. Evans A., Whelehan P., Thomson K., et. al.: Quantitative shear wave ultrasound elastography: initial experience in solid breast masses. Breast Cancer Res 2010; 12: pp. R104.
25. Chang J.M., Moon W.K., Cho N., et. al.: Clinical application of shear wave elastography (SWE) in the diagnosis of benign and malignant breast diseases. Breast Cancer Res Treat 2011; 129: pp. 89-97.
26. Berg W.A., Cosgrove D.O., Dore C.J., et. al.: Shear-wave elastography improves the specificity of breast US: the BE1 multinational study of 939 masses. Radiology 2012; 262: pp. 435-449.
27. Evans A., Whelehan P., Thomson K., et. al.: Invasive breast cancer: relationship between shear-wave elastographic findings and histologic prognostic factors. Radiology 2012; 263: pp. 673-677.
28. Youk J.H., Gweon H.M., Son E.J., et. al.: Shear-wave elastography of invasive breast cancer: correlation between quantitative mean elasticity value and immunohistochemical profile. Breast Cancer Res Treat 2013; 138: pp. 119-126.
29. Evans A., Rauchhaus P., Whelehan P., et. al.: Does shear wave ultrasound independently predict axillary lymph node metastasis in women with invasive breast cancer?. Breast Cancer Res Treat 2014; 143: pp. 153-157.
30. Chang J.M., Park I.A., Lee S.H., et. al.: Stiffness of tumours measured by shear-wave elastography correlated with subtypes of breast cancer. Eur Radiol 2013; 23: pp. 2450-2458.
31. Choi W.J., Kim H.H., Cha J.H., et. al.: Predicting prognostic factors of breast cancer using shear wave elastography. Ultrasound Med Biol 2014; 40: pp. 269-274.
32. Mendelson E.B., Bohm-Velez M., Berg W.A., et. al.: ACR BI-RADS ultrasound.ACR BI-RADS Atlas, Breast imaging reporting and data system.2013.American College of RadiologyReston, VA:
33. Barr R.G.: Sonographic breast elastography: a primer. J Ultrasound Med 2012; 31: pp. 773-783.
34. Yoshihara E., Smeets A., Laenen A., et. al.: Predictors of axillary lymph node metastases in early breast cancer and their applicability in clinical practice. Breast 2013; 22: pp. 357-361.
35. Klevesath M.B., Pantel K., Agbaje O., et. al.: Patterns of metastatic spread in early breast cancer. Breast 2013; 22: pp. 449-454.
36. Gokalp G., Topal U., Yildirim N., et. al.: Malignant spiculated breast masses: dynamic contrast enhanced MR (DCE-MR) imaging enhancement characteristics and histopathological correlation. Eur J Radiol 2012; 81: pp. 203-208.
37. Jin Q., Hemminki K., Enquist K., et. al.: Vascular endothelial growth factor polymorphisms in relation to breast cancer development and prognosis. Clin Cancer Res 2005; 11: pp. 3647-3653.
38. Hashizume H., Baluk P., Morikawa S., et. al.: Openings between defective endothelial cells explain tumor vessel leakiness. Am J Pathol 2000; 156: pp. 1363-1380.
39. Lu P., Weaver V.M., Werb Z.: The extracellular matrix: a dynamic niche in cancer progression. J Cell Biol 2012; 196: pp. 395-406.
40. Haagensen C.D.: Diseases of the breast.3rd ed.1986.SaundersPhiladelphiapp. 798-807.
41. Cosgrove D.O., Berg W.A., Dore C.J., et. al.: Shear wave elastography for breast masses is highly reproducible. Eur Radiol 2012; 22: pp. 1023-1032.
42. Aho M., Irshad A., Ackerman S.J., et. al.: Correlation of sonographic features of invasive ductal mammary carcinoma with age, tumor grade, and hormone-receptor status. J Clin Ultrasound 2013; 41: pp. 10-17.