
Rationale and Objectives
To examine the effects of the number of categories in the rating scale used in an observer experiment on the results of ROC analysis by a simulation study.
Materials and Methods
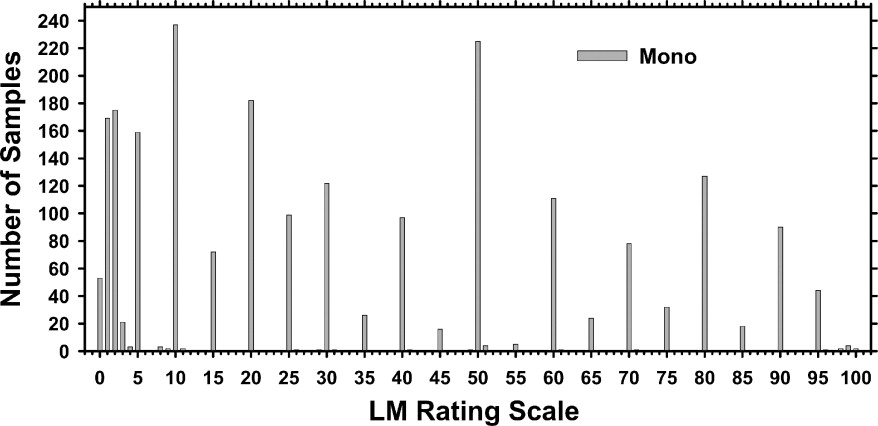
We have previously evaluated the effects of computer-aided diagnosis on radiologists’ characterization of malignant and benign breast masses in serial mammograms. The evaluation of the likelihood of malignancy was performed on a quasi-continuous (0−100 points) confidence rating scale. In this study, we simulated the use of discrete confidence rating scales with fewer number of categories and analyzed the results with receiver operating characteristic (ROC) methodology. The observers’ estimates of the likelihood of malignancy were also mapped to BI-RADS assessments with five and seven categories and ROC analysis was performed. The area under the ROC curve and the partial area index obtained from ROC analysis of the different confidence rating scales were compared.
Results
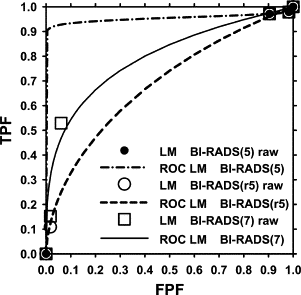
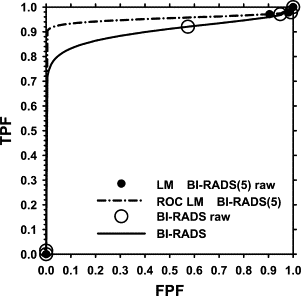
The fitted ROC curves and the performance indices do not change significantly when the confidence rating scales were varied from 6 to 101 points if the estimated operating points obtained directly from the data are distributed relatively evenly over the entire range of true-positive fraction (TPF) and false-positive fraction (FPF). The mapping of the likelihood of malignancy observer data to the seven-category BI-RADS assessment scale allowed reliable ROC analysis, whereas mapping to the five-category BI-RADS scale could cause erratic ROC curve fitting because of the lack of operating points in the mid-range or failure in ROC curve fitting because of data degeneration for some observers.
Conclusion
ROC analysis of discrete confidence rating scales with few but relatively evenly distributed data points over the entire FPF and TPF range is comparable to that of a quasi-continuous rating scale. However, ROC analysis of discrete confidence rating scales with few and unevenly distributed data points may cause unreliable estimations.
The effect of using quasi-continuous or discrete confidence rating scales on the results of receiver operating characteristic (ROC) observer study has been studied by a number of researchers. Rockette et al. ( ) carried out an observer experiment using both a 5-point discrete scale and a quasi-continuous 100-point scale. The results of ROC analysis showed no statistically significant difference between the performance index A z achieved with the two scales. However, they suggested that the use of quasi-continuous scale can be more reliable for ROC analysis because it can avoid the problem of “degenerate” data sets.
King et al. ( ) performed an observer study to estimate the likelihood of the presence of abnormality on chest images using a quasi-continuous scale. Then they mapped the quasi-continuous observer ratings to a 5-point rating scale using two different sets of criteria for determining the range of each category and used ROC methodology to analyze the results. They concluded that the diagnostic accuracy derived from the quasi-continuous rating data are insensitive to the particular way those data are mapped to discrete categories. They also suggested that the use of a quasi-continuous scale is better in observer studies because of the insensitivity of the mapping to discrete categories and the reduced likelihood of “degenerate” data.
Get Radiology Tree app to read full this article<
Get Radiology Tree app to read full this article<
Get Radiology Tree app to read full this article<
Get Radiology Tree app to read full this article<
Materials and methods
Single-View Temporal Pairs Observer Experiment
Get Radiology Tree app to read full this article<
Get Radiology Tree app to read full this article<
Get Radiology Tree app to read full this article<
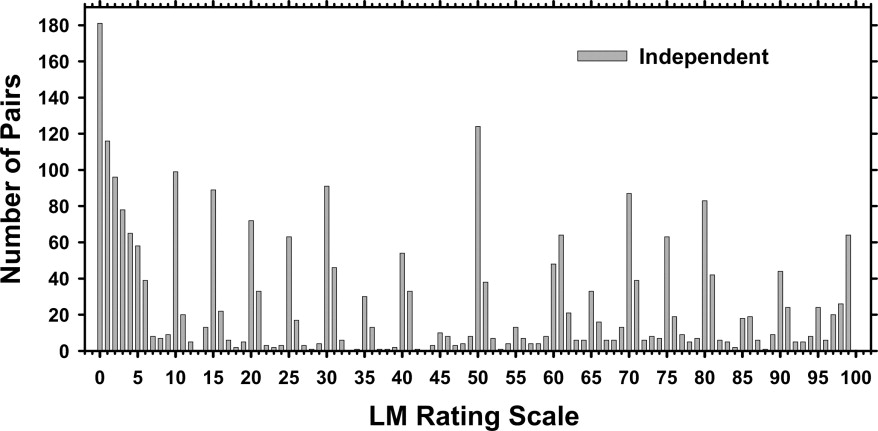
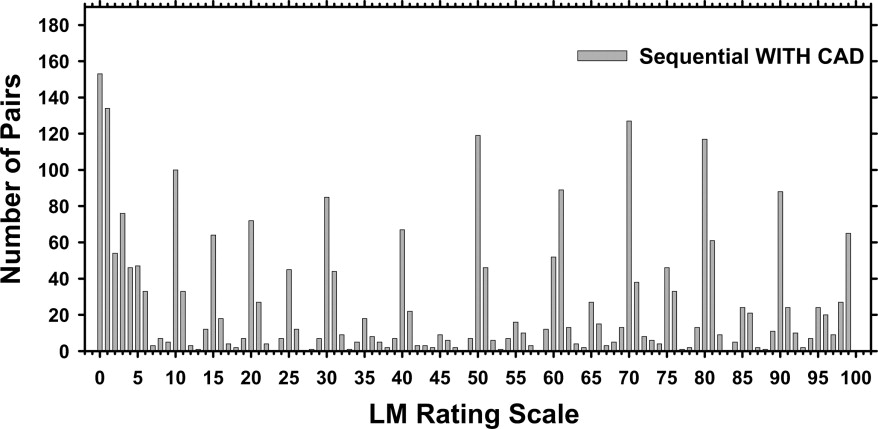
Mapping of Quasi-Continuous LM Ratings to Discrete Confidence Rating Scales
Get Radiology Tree app to read full this article<
ROC Analysis of BI-RADS Assessments
Get Radiology Tree app to read full this article<
Mapping of Quasi-Continuous LM Ratings to BI-RADS Assessment
Get Radiology Tree app to read full this article<
Table 1
Mapping of LM Estimates [the Quasi-Continuous LM Ratings (0−100)] to Simulated BI-RADS Assessments
Mapping 1 LM 0 [1, 2] [3, 70] [71, 100] BI-RADS (r5) 1 2 3 4 5 Mapping 2 LM 0 [1, 2] [3, 94] [95, 100] BI-RADS (5) 1 2 3 4 5 Mapping 3 LM 0 [1, 2] [3, 34] [35, 65] [66, 94] [95, 100] BI-RADS (7) 1 2 3 4 5 6 7
The first mapping [BI-RADS (r5)] is based on the definition given by an experienced MQSA radiologist in our institution. The second mapping [BI-RADS (5)] follows the definition of ACR breast imaging lexicon 2003 for the relation between the LM and the five-category assessments. The third mapping [BI-RADS (7)] also follows the definition of ACR breast imaging lexicon 2003 with the three additional subcategories for category 4.
Get Radiology Tree app to read full this article<
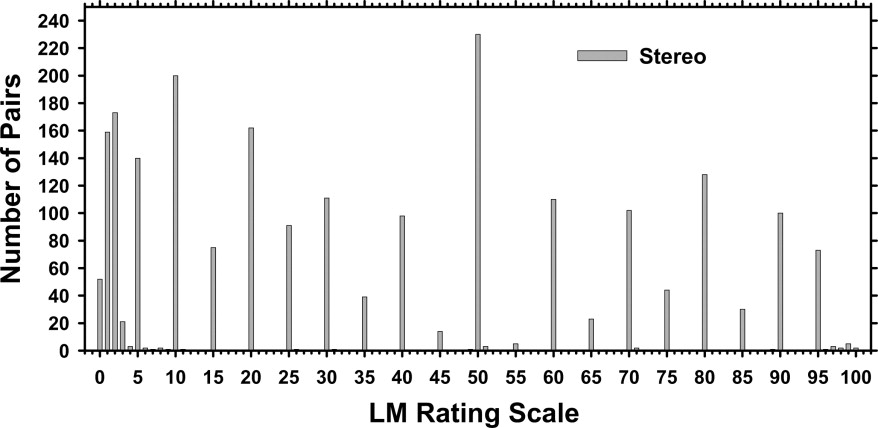
Stereomammography Observer Experiment
Get Radiology Tree app to read full this article<
Statistical Analysis
Get Radiology Tree app to read full this article<
Results
Mapping of Quasi-Continuous LM Ratings to Discrete Confidence-Rating Scales
Get Radiology Tree app to read full this article<
Table 2
Area Under ROC (A z ) Estimated for the Likelihood of Malignancy Based on the 6, 11, 21, and 101 Category Confidence Rating Scales for the Three Reading Modes: Independent (Ind), Sequential Without CAD (No CAD Seq), and Sequential With CAD (With CAD)
Scale Ind No CAD Seq With CAD DBM A B C A-C B-C A-B 6 0.787 0.810 0.847 0.0082 0.0036 0.1436 11 0.786 0.807 0.844 0.0106 0.0017 0.2200 21 0.787 0.808 0.844 0.0076 0.0014 0.2207 101 0.787 0.811 0.843 0.0051 0.0011 0.139
The statistical significance ( P -value) in the differences between pairs of the reading modes was estimated by the DBM method as shown in the last three columns.
Table 3
Standard Deviation for the Corresponding Area Under ROC (A z ) From Table 2 Estimated for the Likelihood of Malignancy Based on the 6, 11, 21, and 101 Category Confidence Rating Scales for the Three Reading Modes: Independent (Ind), Sequential Without CAD (No CAD Seq), and Sequential With CAD (With CAD)
Scale Ind No CAD Seq With CAD A B C 6 0.03096 0.02947 0.02714 11 0.02933 0.02781 0.02545 21 0.02849 0.02699 0.02471 101 0.02829 0.02668 0.02461
Table 4
Partial Area Under ROC Estimated for the Likelihood of Malignancy Based on the 6, 11, 21, and 101 Category Confidence Rating Scales for the Three Reading Modes: Independent (Ind), Sequential Without CAD (No CAD Seq), and Sequential With CAD (With CAD)
Scale Ind No CAD Seq With CAD Paired t -test A B C A−C B−C A−B 6 0.193 0.248 0.388 0.0088 0.013 0.0843 11 0.203 0.247 0.371 0.0055 0.0044 0.0950 21 0.205 0.249 0.371 0.0036 0.0021 0.1097 101 0.206 0.255 0.366 0.0047 0.0012 0.1696
The statistical significance ( P -value) in the differences between pairs of the reading modes was estimated by the paired t -test as shown in the last three columns.
Get Radiology Tree app to read full this article<
Get Radiology Tree app to read full this article<
Get Radiology Tree app to read full this article<
ROC Analysis of BI-RADS Assessments
Get Radiology Tree app to read full this article<
Table 5
Average Area Under ROC, A z , for the Independent (Ind), Sequential Without CAD (No CAD Seq), and Sequential With CAD (With CAD) Modes
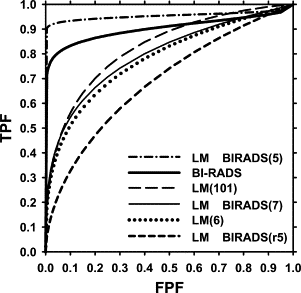
Scale Ind No CAD Seq With CAD DBM A B C A−C B−C A−B LM 0.787 0.811 0.843 0.0051 0.0011 0.1390 BI-RADS 0.770 0.820 0.851 0.0432 0.0522 0.1992 LM-6 Categories 0.787 0.810 0.847 0.0082 0.0036 0.1436 LM→BI-RADS (r5) 0.769 0.789 0.806 0.2303 0.0818 0.8718 LM→BI-RADS (7) 0.782 0.810 0.843 0.0094 0.0013 0.1346
The scales in terms of LM and BI-RADS are the original readings, LM-6 categories is the linear binning from the 101-rating scale to 6 rating scale shown in Table 2 , the mappings LM→BI-RADS (r5) and LM→BI-RADS (7) are described in Table 1 . The average A z values for the mapping LM→BI-RADS (5) are not shown because the MRMC program failed to converge for two of the radiologist readings ( Table 6 ).
Table 6
Area Under ROC (A z ) for the Sequential Mode With CAD
Radiologist LM BI-RADS LM-6 Categories LM→BI-RADS (r5) (5) (7) 1 0.891 0.864 0.896 0.863 0.837 0.891 2 0.863 0.876 0.870 0.815 0.817 0.881 3 0.806 0.785 0.804 0.795 0.792 0.808 4 0.920 0.892 0.919 0.913 0.903 0.929 5 0.797 0.768 0.780 0.814 0.756 0.792 6 0.865 0.847 0.862 0.859 ⁎ 0.880 7 0.831 0.902 0.838 0.789 ⁎ 0.841 8 0.759 0.759 0.761 0.759 0.636 0.744 9 0.828 0.902 0.781 0.689 0.953 0.798 10 0.793 0.828 0.826 0.662 0.736 0.769 Mean 0.835 0.842 0.834 0.796 ⁎ 0.833 Average (a, b) 0.843 0.851 0.847 0.806 ⁎ 0.843
The mapping of the LM (101) scale to the other scales was described in Table 1 . The mean A z was obtained by averaging the individual A z values. The average A z value derived from the average a and b parameters for the individual fitted ROC curves was also included for each condition.
Get Radiology Tree app to read full this article<
Get Radiology Tree app to read full this article<
Mapping of Quasi-Continuous LM Ratings to BI-RADS Assessments
Get Radiology Tree app to read full this article<
Get Radiology Tree app to read full this article<
Get Radiology Tree app to read full this article<
Get Radiology Tree app to read full this article<
Get Radiology Tree app to read full this article<
Get Radiology Tree app to read full this article<
Get Radiology Tree app to read full this article<
Get Radiology Tree app to read full this article<
Get Radiology Tree app to read full this article<
Stereomammography Observer Experiment
Get Radiology Tree app to read full this article<
Get Radiology Tree app to read full this article<
Discussion
Get Radiology Tree app to read full this article<
Get Radiology Tree app to read full this article<
Get Radiology Tree app to read full this article<
Get Radiology Tree app to read full this article<
Get Radiology Tree app to read full this article<
Get Radiology Tree app to read full this article<
Get Radiology Tree app to read full this article<
Get Radiology Tree app to read full this article<
Get Radiology Tree app to read full this article<
Conclusion
Get Radiology Tree app to read full this article<
Acknowledgments
Get Radiology Tree app to read full this article<
Get Radiology Tree app to read full this article<
Get Radiology Tree app to read full this article<
References
1. Rockette H.E., Gur D., Metz C.E.: The use of continuous and discrete confidence judgements in receiver operating characteristic studies of diagnostic imaging techniques. Invest Radiol 1992; 27: pp. 169-172.
2. King J.L., Britton C.A., Gur D., et. al.: On the validity of the continuous and discrete confidence rating scales in receiver operating characteristic studies. Invest Radiol 1993; 28: pp. 962-963.
3. Wagner R.F., Beiden S.V., Metz C.E.: Continuous versus categorical data for ROC analysis: Some quantitative considerations. Acad Radiol 2001; 8: pp. 328-334.
4. Berbaum K.S., Dorfman D.D., Franken E.A., et. al.: An empirical comparison of discrete ratings and subjective probability ratings. Acad Radiol 2002; 9: pp. 756-763.
5. Hadjiiski L.M., Chan H.P., Sahiner B., et. al.: ROC study: Effects of computer-aided diagnosis on radiologists’ characterization of malignant and benign breast masses in temporal pairs of mammograms. Proc SPIE Med Imaging 2003; 5032: pp. 94-101.
6. Hadjiiski L.M., Chan H.P., Sahiner B., et. al.: Improvement of radiologists’ characterization of malignant and benign breast masses in serial mammograms by computer-aided diagnosis: An ROC study. Radiology 2004; 233: pp. 255-265.
7. American College of Radiology: 1998.American College of RadiologyReston, VA
8. Kobayashi T., Xu X.-W., MacMahon H., et. al.: Effect of a computer-aided diagnosis scheme on radiologists’ performance in detection of lung nodules on radiographs. Radiology 1996; 199: pp. 843-848.
9. 2003.American College of RadiologyReston, VA
10. Chan H.P., Goodsitt M.M., Helvie M.A., et. al.: ROC study of the effect of stereoscopic imaging on assessment of breast lesions. Med Physics 2005; 32: pp. 1001-1009.
11. Dorfman D.D., Berbaum K.S., Metz C.E.: ROC rating analysis: Generalization to the population of readers and cases with the jackknife method. Invest Radiol 1992; 27: pp. 723-731.
12. Jiang Y., Metz C.E., Nishikawa R.M.: A receiver operating characteristic partial area index for highly sensitive diagnostic tests. Radiology 1996; 201: pp. 745-750.
13. Metz C.E.: Some practical issues of experimental design and data analysis in radiological ROC studies. Invest Radiol 1989; 24: pp. 234-245.
14. Dorfman D.D., Berbaum K.S., Metz C.E., et. al.: Proper receiver operating characteristic analysis: The bigamma model. Acad Radiol 1997; 4: pp. 138-149.
15. Metz C.E., Pan X.: “Proper” binormal ROC curves: Theory and maximum-likelihood estimation. J Math Psychol 1999; 43: pp. 1-33.