
Rationale and Objectives
Inflammatory reaction surrounding the ablated area is a major confounding factor in the early detection of viable tumor after radiofrequency (RF) ablation. A difference in the responsiveness of normal and tumor blood vessels to vasoactive agents may be used to distinguish these regions in post-ablation follow-up. The goal of this study was to examine longitudinal perfusion changes in untreated viable tumor and the peripheral hyperemic rim of RF-ablated tumor in response to a vasoconstrictor (phenylephrine) or vasodilator (hydralazine) in a subcutaneous rat tumor model.
Materials and Methods
Bilateral subcutaneous shoulder tumors were inoculated in 24 BDIX rats and evenly divided into two groups (phenylephrine and hydralazine groups). One tumor in each animal was completely treated with RF ablation (at 90 ± 2°C for 3 minutes), and the other remained untreated. Computed tomographic perfusion scans before and after phenylephrine (10 μg/kg) or hydralazine (5 mg/kg) administration were performed 2, 7, and 14 days after ablation. Four rats per group were euthanized on each scan day, and pathologic evaluation was performed. The changes of blood flow in the peripheral rim of ablated tumor and untreated viable tumor in response to phenylephrine or hydralazine at each time point were compared. The diagnostic accuracy of viable tumor using the percentage change of blood flow in response to phenylephrine and hydralazine was compared using receiver-operating characteristic analysis.
Results
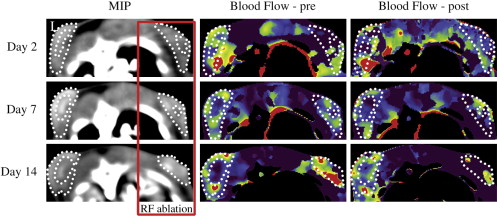
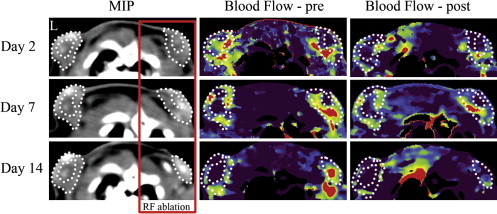
The peripheral rim of ablated tumor presented with a hyperemic reaction with dilated vessels and congestion on day 2 after ablation, numerous inflammatory vessels on day 7, and granulation tissue formation on day 14. Phenylephrine significantly decreased the blood flow in the peripheral hyperemic rim of ablated tumor on days 2, 7, and 14 by 16.3 ± 9.7% ( P = .001), 24.0 ± 22.6% ( P = .007), and 31.1 ± 25.4% ( P = .045), respectively. In untreated viable tumor, the change in blood flow after phenylephrine was irregular and insignificant. Hydralazine decreased the blood flow in the peripheral rim of both ablated tumor and untreated viable tumor. Receiver-operating characteristic analysis showed that reliable tumor diagnosis using the percentage change of blood flow in response to phenylephrine was noted on days 2 and 7, for which the areas under the curve were 0.82 (95% confidence interval, 0.64–1.00) and 0.81 (95% confidence interval, 0.56–1.00), respectively. However, tumor diagnosis using the blood flow change in response to hydralazine was unreliable.
Conclusion
Phenylephrine markedly decreased blood flow in the peripheral hyperemic rim of ablated tumor but had little effect on the untreated viable tumor. Computed tomographic perfusion with phenylephrine may be useful in the long-term treatment assessment of RF ablation.
Interventional oncologic procedures such as chemical ablation, laser ablation, radiofrequency (RF) ablation, and microwave ablation have been widely used in unresectable solid tumor treatment. These techniques can provide efficacious, cost-effective management of localized cancer sites . However, local recurrence due to factors such as large tumor size (>3 cm), irregular contours, and affluent blood supply continues to be a main cause of treatment failure . The early detection of residual or locally recurrent tumor after interventional treatment is critical and can facilitate successful retreatment at an early stage.
Contrast-enhanced computed tomography and magnetic resonance (MR) are currently used to evaluate RF ablation efficacy. However, an inflammatory peripheral rim induced by ablation, which presents as enhancement surrounding the coagulated zone, can obscure viable residual tumor. The histologic examination of ablated tumors has shown that the sensitivity of computed tomography or MR for the detection of viable tumor after ablation ranges from 36% to 86% . Recent reports that positron emission tomography/computed tomography can increase the sensitivity and accuracy for the detection of residual tumor are promising , but this modality may not be sufficiently cost effective to become a routine follow-up method. New imaging methods are needed for the successful and accurate follow-up of local tumor ablation therapy.
Get Radiology Tree app to read full this article<
Get Radiology Tree app to read full this article<
Materials and methods
Overall Experimental Design
Get Radiology Tree app to read full this article<
Animal Model
Get Radiology Tree app to read full this article<
RF Ablation
Get Radiology Tree app to read full this article<
CT Perfusion
Get Radiology Tree app to read full this article<
Image Analysis
Get Radiology Tree app to read full this article<
Get Radiology Tree app to read full this article<
Histopathologic Examination
Get Radiology Tree app to read full this article<
Statistical Analysis
Get Radiology Tree app to read full this article<
Get Radiology Tree app to read full this article<
Results
CT Perfusion Findings and Corresponding Histologic Correlation
Get Radiology Tree app to read full this article<
![Figure 1, Correlation of perfusion images ( [a] maximum-intensity projection, [b] blood flow) with histology ( [c] 4×, [d] 200× [hematoxylin and eosin]) in an untreated tumor. The central zone ( asterisks ) of the tumor presents hyperdense on the maximum-intensity projection image (a) , shows no perfusion (b) , and appears necrotic on the corresponding histologic image (c) . The tumor rim consists of densely packed viable tumor cells encased by a hypervascular fibrous capsule (d) .](https://storage.googleapis.com/dl.dentistrykey.com/clinical/RadiofrequencyAblation/0_1s20S1076633208005394.jpg)
Get Radiology Tree app to read full this article<
Get Radiology Tree app to read full this article<
![Figure 2, Representative hematoxylin and eosin histology ( [a,c,e] 4×, [b,d,f] 200×) of tumor progression after radiofrequency ablation on days 2 (a,b) , 7 (c,d) , and 14 (e,f) . (a) On day 2, coagulative necrosis was seen in the ablation zone. In the peripheral rim (b) (white square) , a hyperemic reaction zone with dilated vessels and red blood cell infiltration is present. (c) On day 7, numerous blood vessels were found in the peripheral rim of the ablation zone (d) (white square) . The lumen of these vessels shrank to normal. (e) On day 14, granulation tissue formed in the margin of the ablation zone (f) (white square) , and the quantity of blood vessels decreased.](https://storage.googleapis.com/dl.dentistrykey.com/clinical/RadiofrequencyAblation/1_1s20S1076633208005394.jpg)
Get Radiology Tree app to read full this article<
Get Radiology Tree app to read full this article<
Get Radiology Tree app to read full this article<
Blood Flow Changes in the Peripheral Rim of Ablated Tumor and Untreated Viable Tumor in Response to Phenylephrine
Get Radiology Tree app to read full this article<
Table 1
Changes in Blood Flow (mL/100 mL/min) in the Peripheral Rim of Ablated Tumor, Untreated Viable Tumor, and Muscle in Response to Phenylephrine
Peripheral Rim of Ablated Tumor Untreated Viable Tumor Muscle Day_n_ Pre Post % Change Pre Post % Change Pre Post % Change 2 12 52.8 ± 19.5 44.1 ± 18.2 ∗ −16.3 ± 9.7 46.9 ± 12.9 52.2 ± 24.0 11.0 ± 32.7 4.7 ± 3.3 2.9 ± 2.3 −36.8 ± 54.7 7 8 69.2 ± 26.3 52.2 ± 25.1 ∗ −24.0 ± 22.6 51.4 ± 8.2 49.0 ± 8.4 −4.5 ± 9.0 4.8 ± 4.7 3.7 ± 3.7 −1.6 ± 56.8 14 4 73.5 ± 14.5 49.5 ± 17.3 † −31.1 ± 25.4 46.9 ± 10.0 46.5 ± 16.9 1.8 ± 35.0 5.1 ± 5.3 2.1 ± 1.9 −61.2 ± 17.8
Get Radiology Tree app to read full this article<
Get Radiology Tree app to read full this article<
Get Radiology Tree app to read full this article<
Perfusion Changes in the Peripheral Rim of Ablated Tumor and Untreated Viable Tumor in Response to Hydralazine
Get Radiology Tree app to read full this article<
Table 2
Changes in Blood Flow (mL/100 mL/min) in the Peripheral Rim of Ablated Tumor, Untreated Viable Tumor, and Muscle in Response to Hydralazine
Peripheral Rim of Ablated Tumor Untreated Viable Tumor Muscle Day_n_ Pre Post % Change Pre Post % Change Pre Post % Change 2 12 47.2 ± 20.1 38.1 ± 12.8 ∗ −15.0 ± 25.9 40.9 ± 11.1 28.8 ± 9.1 † −27.5 ± 19.1 5.6 ± 2.3 3.6 ± 2.0 † −23.3 ± 52.7 7 8 71.6 ± 17.0 58.1 ± 14.5 ∗ −17.7 ± 16.8 50.6 ± 13.4 36.2 ± 10.5 ∗ −24.4 ± 32.1 3.4 ± 1.9 2.5 ± 1.7 −16.9 ± 58.5 14 4 64.4 ± 20.6 58.3 ± 31.2 −10.3 ± 30.7 43.7 ± 8.9 30.6 ± 8.7 † −30.6 ± 5.1 6.6 ± 3.1 2.5 ± 2.1 † −66.2 ± 15.7
Get Radiology Tree app to read full this article<
Get Radiology Tree app to read full this article<
Get Radiology Tree app to read full this article<
ROC Analysis
Get Radiology Tree app to read full this article<
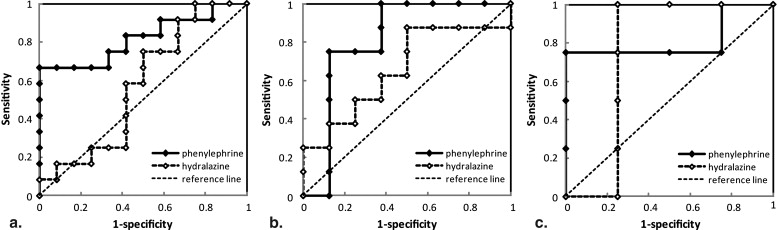
Table 3
AUCs and 95% CIs of the Receiver-operating Characteristic Curves of Percentage Changes of Blood Flow in Response to Phenylephrine and Hydralazine
Phenylephrine Hydralazine AUC 95% CI AUC 95% CI Day 2 0.82 0.64–1.00 0.58 0.33–0.82 Day 7 0.81 0.56–1.00 0.66 0.37–0.95 Day 14 0.81 0.46–1.00 0.75 0.26–1.00 Pooled data 0.83 0.71–0.95 0.63 0.46–0.80
AUC, area under the curve; CI, confidence interval.
Get Radiology Tree app to read full this article<
Discussion
Get Radiology Tree app to read full this article<
Get Radiology Tree app to read full this article<
Get Radiology Tree app to read full this article<
Get Radiology Tree app to read full this article<
Get Radiology Tree app to read full this article<
Get Radiology Tree app to read full this article<
Get Radiology Tree app to read full this article<
Get Radiology Tree app to read full this article<
Get Radiology Tree app to read full this article<
Get Radiology Tree app to read full this article<
Get Radiology Tree app to read full this article<
Get Radiology Tree app to read full this article<
Get Radiology Tree app to read full this article<
Conclusion
Get Radiology Tree app to read full this article<
References
1. Hong K., Georgiades C.S., Geschwind J.F.: Technology insight: Image-guided therapies for hepatocellular carcinoma—intra-arterial and ablative techniques. Nat Clin Pract Oncol 2006; 3: pp. 315-324.
2. Gazelle G.S., McMahon P.M., Beinfeld M.T., Halpern E.F., Weinstein M.C.: Metastatic colorectal carcinoma: cost-effectiveness of percutaneous radiofrequency ablation versus that of hepatic resection. Radiology 2004; 233: pp. 729-739.
3. Harrison L.E., Koneru B., Baramipour P., et. al.: Locoregional recurrences are frequent after radiofrequency ablation for hepatocellular carcinoma. J Am Coll Surg 2003; 197: pp. 759-764.
4. Curley S.A.: Radiofrequency ablation versus resection for resectable colorectal liver metastases: time for a randomized trial?. Ann Surg Oncol 2008; 15: pp. 11-13.
5. Lim H.K., Choi D., Lee W.J., et. al.: Hepatocellular carcinoma treated with percutaneous radio-frequency ablation: evaluation with follow-up multiphase helical CT. Radiology 2001; 221: pp. 447-454.
6. Lu D.S., Yu N.C., Raman S.S., et. al.: Radiofrequency ablation of hepatocellular carcinoma: treatment success as defined by histologic examination of the explanted liver. Radiology 2005; 234: pp. 954-960.
7. Lencioni R., Cioni D., Bartolozzi C.: Percutaneous radiofrequency thermal ablation of liver malignancies: techniques, indications, imaging findings, and clinical results. Abdom Imaging 2001; 26: pp. 345-360.
8. Veit P., Antoch G., Stergar H., Bockisch A., Forsting M., Kuehl H.: Detection of residual tumor after radiofrequency ablation of liver metastasis with dual-modality PET/CT: initial results. Eur Radiol 2006; 16: pp. 80-87.
9. Okuma T., Okamura T., Matsuoka T., et. al.: Fluorine-18-fluorodeoxyglucose positron emission tomography for assessment of patients with unresectable recurrent or metastatic lung cancers after CT-guided radiofrequency ablation: preliminary results. Ann Nucl Med 2006; 20: pp. 115-121.
10. Morikawa S., Baluk P., Kaidoh T., Haskell A., Jain R.K., McDonald D.M.: Abnormalities in pericytes on blood vessels and endothelial sprouts in tumors. Am J Pathol 2002; 160: pp. 985-1000.
11. Baluk P., Morikawa S., Haskell A., Mancuso M., McDonald D.M.: Abnormalities of basement membrane on blood vessels and endothelial sprouts in tumors. Am J Pathol 2003; 163: pp. 1801-1815.
12. Ekelund L.: Pharmacoangiography of the kidney: an overview. Urol Radiol 1980; 2: pp. 9-15.
13. Miles K.A., Griffiths M.R., Perfusion C.T.: a worthwhile enhancement?. Br J Radiol 2003; 76: pp. 220-231.
14. Zima A., Carlos R., Gandhi D., Case I., Teknos T., Mukherji S.K.: Can pretreatment CT perfusion predict response of advanced squamous cell carcinoma of the upper aerodigestive tract treated with induction chemotherapy?. AJNR Am J Neuroradiol 2007; 28: pp. 328-334.
15. Cuenod C.A., Leconte I., Siauve N., et. al.: Deconvolution technique for measuring tissue perfusion by dynamic CT: application to normal and metastatic liver. Acad Radiol 2002; 9: pp. S205-S211.
16. Krupka T.M., Weinberg B.D., Wu H., Ziats N.P., Exner A.A.: Effect of intratumoral injection of carboplatin combined with pluronic P85 or L61 on experimental colorectal carcinoma in rats. Exp Biol Med (Maywood) 2007; 232: pp. 950-957.
17. Tozer G.M., Maxwell R.J., Griffiths J.R., Pham P.: Modification of the 31P magnetic resonance spectra of a rat tumour using vasodilators and its relationship to hypotension. Br J Cancer 1990; 62: pp. 553-560.
18. Ohyama N., Yamaguchi S.: Effects of phenylephrine and prazosin on axial movement of the rat incisor and arterial blood pressure. Jpn J Pharmacol 1999; 80: pp. 271-274.
19. Goldberg S.N., Gazelle G.S., Compton C.C., Mueller P.R., Tanabe K.K.: Treatment of intrahepatic malignancy with radiofrequency ablation: radiologic-pathologic correlation. Cancer 2000; 88: pp. 2452-2463.
20. Hsu C.P., Razavi M.K., So S.K., Parachikov I.H., Benaron D.A.: Liver tumor gross margin identification and ablation monitoring during liver radiofrequency treatment. J Vasc Interv Radiol 2005; 16: pp. 1473-1478.
21. Dromain C., de Baere T., Elias D., et. al.: Hepatic tumors treated with percutaneous radio-frequency ablation: CT and MR imaging follow-up. Radiology 2002; 223: pp. 255-262.
22. Chaplin D.J., Acker B.D., Horsman M.R.: Reduction of tumour blood flow by vasoactive drugs: a role in cancer therapy. Biomed Biochim Acta 1989; 48: pp. S264-S268.
23. Chan R.C., Babbs C.F., Vetter R.J., Lamar C.H.: Abnormal response of tumor vasculature to vasoactive drugs. J Natl Cancer Inst 1984; 72: pp. 145-150.
24. Bradley J.G.: Nonprescription drugs and hypertension. Which ones affect blood pressure?. Postgrad Med 1991; 89: pp. 195-197.
25. Arce C., Segura-Pacheco B., Perez-Cardenas E., Taja-Chayeb L., Candelaria M., Duennas-Gonzalez A.: Hydralazine target: from blood vessels to the epigenome. J Transl Med 2006; 4: pp. 10.
26. Nielsen F.U., Topp S., Horsman M.R., Overgaard J., Stodkilde-Jorgensen H., Maxwell R.J.: Localized in vivo 1H NMR spectroscopy of murine tumours: effect of blood flow reduction. NMR Biomed 1999; 12: pp. 175-183.
27. Phongkitkarun S., Kobayashi S., Kan Z., Lee T.Y., Charnsangavej C.: Quantification of angiogenesis by functional computed tomography in a Matrigel model in rats. Acad Radiol 2004; 11: pp. 573-582.
28. Lassau N., Chami L., Benatsou B., Peronneau P., Roche A.: Dynamic contrast-enhanced ultrasonography (DCE-US) with quantification of tumor perfusion: a new diagnostic tool to evaluate the early effects of antiangiogenic treatment. Eur Radiol 2007; 17: pp. F89-F98.
29. Bisdas S., Medov L., Baghi M., et. al.: A comparison of tumour perfusion assessed by deconvolution-based analysis of dynamic contrast-enhanced CT and MR imaging in patients with squamous cell carcinoma of the upper aerodigestive tract. Eur Radiol 2008; 18: pp. 843-850.