
Rationale and Objectives
Periprosthetic osteolysis is a disease attributed to the body’s reaction to fine polyethylene wear debris shed from total hip replacements. The purpose of this preliminary study was to investigate the ability of radiographic texture analysis (RTA) to characterize the trabecular texture patterns on pelvic images for osteolysis and normal total hip arthroplasty (THA) cases.
Materials and Methods
Fourier-based and fractal-based texture features were calculated for a database of digitized radiographs from 202 THA cases, 70 of which developed osteolysis. The features were calculated from regions of interest selected at two time points: less than 1 month after surgery, and at the first clinical indication of osteolysis (or randomly selected follow-up time for normal cases). Receiver operating characteristic (ROC) analysis was used to compare feature performance at baseline and follow-up for osteolysis and normal cases.
Results
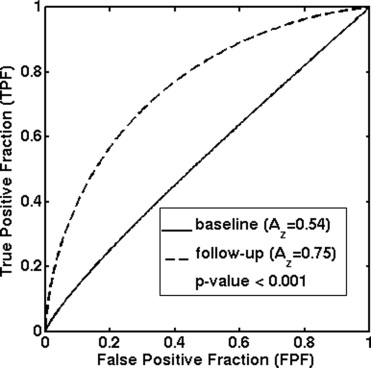
Separation between the RTA features for osteolysis and normal cases was negligible at baseline and increased substantially for the follow-up images. The directional Fourier-based feature provided the best separation with an A z value from ROC analysis of 0.75 for the follow-up images, in the task of distinguishing between normal and osteolytic cases.
Conclusions
The results from this preliminary analysis indicate that qualitative changes in trabecular patterns from immediately after surgery to the eventual detection of osteolysis correspond to quantitative changes in RTA features. It therefore appears that RTA provides information that could potentially be useful to aid in the detection of this disease.
Periprosthetic osteolysis is a common long-term complication in total hip replacement surgeries. It is a man-made disease attributed to the body’s reaction to fine polyethylene wear debris shed by the artificial hip articulation ( ). The process begins when macrophages ingest submicron polyethylene debris particles, leading to the stimulation of osteoclasts and resorption of adjacent bone ( ). The disease strongly contributes to weakening of the surrounding bone and disappearance of its trabecular pattern. This continual destruction of bone and consequent bone weakening can eventually lead to severe fractures and bone destruction, often necessitating complex revision surgeries.
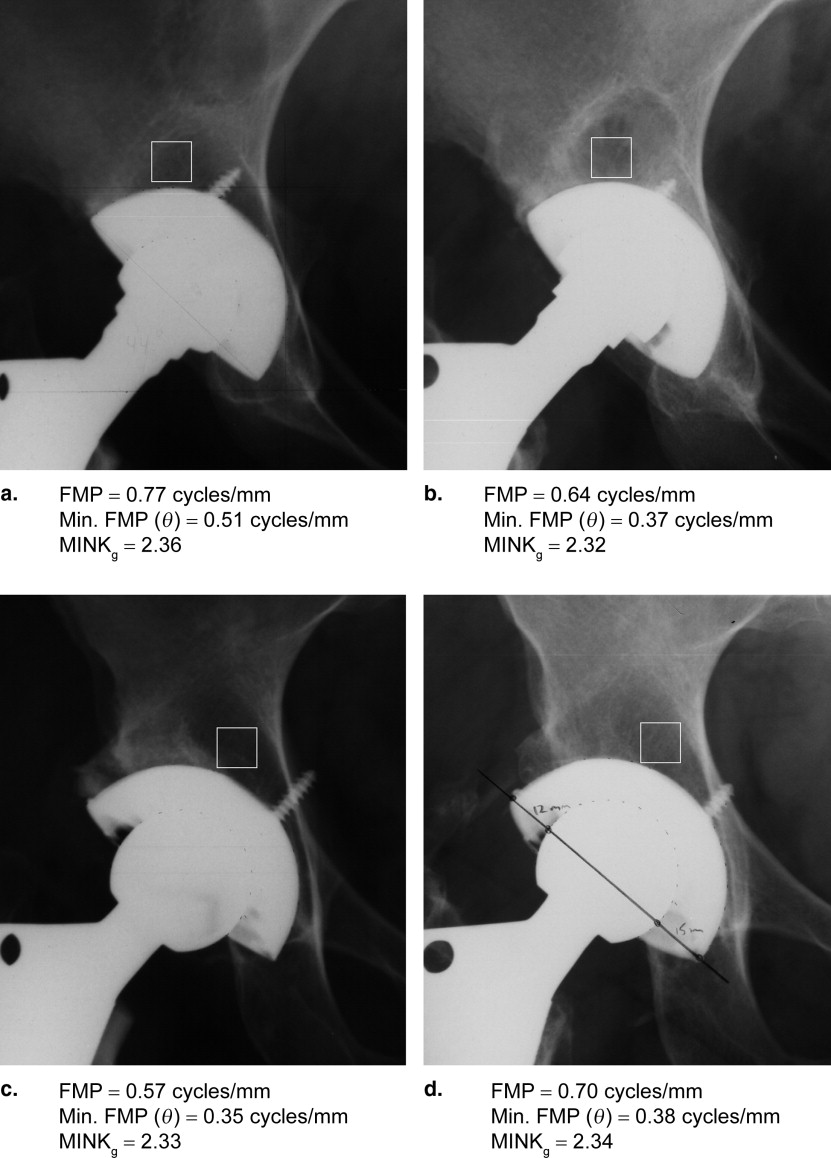
The biologic process causing osteolysis is initially asymptomatic, with major bone destruction often occurring in the early stages before any loosening of the components of the replacement ( ). As a result, the disease is typically diagnosed when a region of localized trabecular bone loss is visible radiographically ( ). However, osteolytic lesions tend to evolve in a slow process and radiographic evidence is not usually visually apparent on earlier postoperative radiographs ( Fig 1 ). Moreover, trabecular texture patterns are difficult for even experts to quantify radiographically. The disease, therefore, commonly goes unnoticed until severe bone loss and loosening of the hip replacement or fracture has occurred, making surgical reconstruction difficult and clinical outcomes poor.
 Open full size image
Figure 1
Radiographic example of osteolysis. The baseline image (a) and the 4-year follow-up image (b) show no signs of the disease. The 14-year follow-up image (c) contains a large region of osteolysis indicated by the arrows.
Get Radiology Tree app to read full this article<
Get Radiology Tree app to read full this article<
Get Radiology Tree app to read full this article<
Materials and methods
Database
Get Radiology Tree app to read full this article<
Table 1
Database Summary for the Osteolysis ( n = 70 cases) and Normal ( n = 132 cases) Total Hip Arthroplasty Populations
Patient Age at Surgery (Years) Follow-up Time (Years) Osteolysis Normal Osteolysis Normal Mean 49.3 57.7 10.3 10.3 Range 23–78 26–83 2–17 2–17
Get Radiology Tree app to read full this article<
Region of Interest Selection
Get Radiology Tree app to read full this article<
Feature Calculation
Get Radiology Tree app to read full this article<
FMP=∑m∑nm2+n2√|Fm,n|2∑m∑n|Fm,n|2. FMP
=
∑
m
∑
n
m
2
+
n
2
|
F
m
,
n
|
2
∑
m
∑
n
|
F
m
,
n
|
2
.
Get Radiology Tree app to read full this article<
Get Radiology Tree app to read full this article<
FMP(i≤<i+1)=∑m∑nm2+n2√|Fm,n|2∑m∑n|Fm,n|2fori≤arctan(nm)<i+1, FMP
(
i
≤
<
i
+
1
)
=
∑
m
∑
n
m
2
+
n
2
|
F
m
,
n
|
2
∑
m
∑
n
|
F
m
,
n
|
2
for
i
≤
arctan
(
n
m
)
<
i
+
1
,
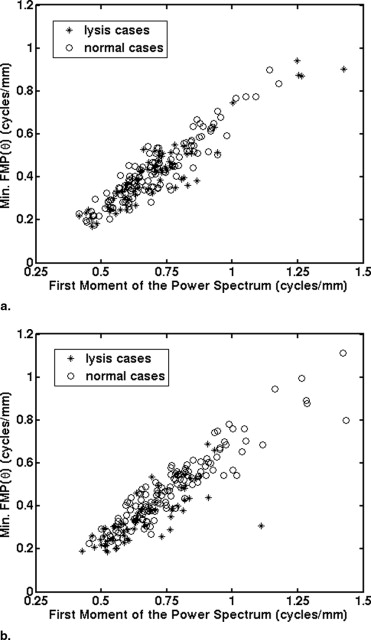
where θ i was incremented in 15° intervals. The minimum of the angular FMP values (Min. FMP(θ)) was taken as the minimum of these 24 angular FMP values.
Get Radiology Tree app to read full this article<
Get Radiology Tree app to read full this article<
Vg(r)=∑Ni=1∑Nj=1{(f⊕rg)−(f⊗rg)}, V
g
(
r
)
=
∑
i
=
1
N
∑
j
=
1
N
{
(
f
⊕
r
g
)
−
(
f
⊗
r
g
)
}
,
where N is the ROI size, and ( f ⊕ rg ) and ( f ⊗ rg ) are the respective dilated and eroded versions of the ROI f , obtained with a 3 × 3 pixel square structuring element g , at a scale r . The slope of the logarithmic plot of V g ( r )/ r 3 versus 1/ r was then used to calculate the fractal dimension:
MINKg=limr→0log[Vg(r)/r3]log[1/r]. M
I
N
K
g
=
lim
r
→
0
log
[
V
g
(
r
)
/
r
3
]
log
[
1
/
r
]
.
Get Radiology Tree app to read full this article<
Data Analysis
Get Radiology Tree app to read full this article<
Results
Get Radiology Tree app to read full this article<
Get Radiology Tree app to read full this article<
Get Radiology Tree app to read full this article<
Nondirectional RTA Features
Get Radiology Tree app to read full this article<
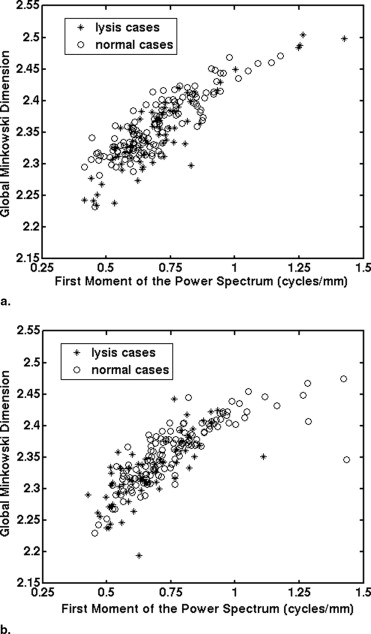
Table 2
Results from ROC Analysis of the Three Features for Baseline and Follow-up Images in the Task of Distinguishing Between Normal and Osteolysis Cases
Baseline A z Follow-up A z ΔA z P Value FMP 0.52 0.69 0.08–0.27 <.001 Minimum FMP( θ ) 0.54 0.75 0.13–0.30 <.001 MINK g 0.59 0.67 0–0.17 .05
The 95% confidence intervals for the difference in A z values between follow-up and baseline are also listed, along with the P values for this difference.
FMP = first moment of the power spectrum; MINK g = global Minkowski dimension.
Get Radiology Tree app to read full this article<
Get Radiology Tree app to read full this article<
Table 3
Average Feature Values for the Three Features from (a) Baseline and (b) Follow-up Images
(a) Baseline Osteolysis Average (95% CI) Normal Average (95% CI)P Value FMP (cycles/mm) 0.71 (0.66–0.75) 0.70 (0.67–0.72) .75 Min. FMP(θ) (cycles/mm) 0.41 (0.38–0.45) 0.42 (0.40–0.45) .70 MINK g 2.349 (2.335–2.363) 2.361 (2.354–2.369) .11
(b) Follow-up Osteolysis Average (95% CI) Normal Average (95% CI)P Value FMP (cycles/mm) 0.66 (0.63–0.69) 0.77 (0.74–0.80) <.001 Min. FMP(θ) (cycles/mm) 0.35 (0.32–0.38) 0.48 (0.45–0.51) <.001 MINK g 2.327 (2.316–2.339) 2.360 (2.351–2.368) <.001
Student’s t -tests were performed to determine the significance of the feature differences between osteolysis and normal cases. Corresponding P values are also shown.
See Table 2 for abbreviations.
Get Radiology Tree app to read full this article<
Directional RTA Feature
Get Radiology Tree app to read full this article<
Get Radiology Tree app to read full this article<
Get Radiology Tree app to read full this article<
Discussion
Get Radiology Tree app to read full this article<
Get Radiology Tree app to read full this article<
Get Radiology Tree app to read full this article<
Table 4
Average Values and 95% Confidence Intervals for the Three Features from Baseline Images and Follow-up Images for (a) Osteolysis and (b) Normal Cases
(a) Osteolysis Baseline Average (95% CI) Follow-up Average (95% CI)P Value FMP (cycles/mm) 0.71 (0.66, 0.75) 0.66 (0.63, 0.69) .08 Min. FMP(θ) (cycles/mm) 0.41 (0.38, 0.45) 0.35 (0.32, 0.38) .003 MINK g 2.349 (2.335, 2.363) 2.327 (2.316, 2.339) .002
(b) Normal Baseline Average (95% CI) Follow-up Average (95% CI)P Value FMP (cycles/mm) 0.70 (0.67, 0.72) 0.77 (0.74, 0.80) <.001 Min. FMP(θ) (cycles/mm) 0.42 (0.40, 0.45) 0.48 (0.45, 0.51) <.001 MINK g 2.361 (2.354, 2.369) 2.360 (2.351, 2.368) .61
Paired Student’s t -tests were performed to determine the significance of the feature differences between baseline and follow-up images and the resulting P values are shown in the table.
See Table 2 for abbreviations.
Get Radiology Tree app to read full this article<
Get Radiology Tree app to read full this article<
Get Radiology Tree app to read full this article<
Get Radiology Tree app to read full this article<
Acknowledgments
Get Radiology Tree app to read full this article<
Get Radiology Tree app to read full this article<
References
1. Harris W.H.: Osteolysis and particle disease in hip replacement. Acta Orthop Scand 1994; 65: pp. 113-123.
2. Harris W.H.: Wear and periprosthetic osteolysis: the problem. Clin Orthop 2001; 393: pp. 66-70.
3. Engh C.A., Claus A.M., Hopper R.H., et. al.: Long-term results using the anatomic medullary locking hip prosthesis. Clin Orthop 2001; 393: pp. 137-146.
4. Maloney W.J., Galante J.O., Anderson M., et. al.: Fixation, polyethylene wear, and pelvic osteolysis in primary total hip replacement. Clin Orthop 1999; 369: pp. 157-164.
5. Rubash H.E., Sinha R.K., Paprosky W., et. al.: A new classification system for the management of acetabular osteolysis after total hip arthroplasty. Instr Course Lect 1999; 48: pp. 37-42.
6. Orishimo K.F., Claus A.M., Sychterz C.J., et. al.: Relationship between polyethylene wear and osteolysis in hips with a second-generation porous-coated cementless cup after seven years of follow-up. J Bone Joint Surg Am 2003; 85-A: pp. 1095-1099.
7. Fidouh F., Harba R., Jacquet G., et. al.: Long-term reproducibility optimization of an x-ray process for bone architectural evaluation during osteoporosis. Phys Med Biol 1999; 44: pp. N1-N8.
8. Lespessailles E., Gadois C., Lemineur G., et. al.: Bone texture analysis on direct digital radiographic images: precision study and relationship with bone mineral density at the os calcis. Calcif Tissue Int 2007; 80: pp. 97-102.
9. Lespessailles E., Jullien A., Eynard E., et. al.: Biomechanical properties of human os calcanei: relationships with bone density and fractal evaluation of bone microarchitecture. J Biomech 1998; 31: pp. 817-824.
10. Link T.M., Majumdar S., Grampp S., et. al.: Imaging of trabecular bone structure in osteoporosis. Eur Radiol 1999; 9: pp. 1781-1788.
11. Link T.M., Majumdar S., Lin J.C., et. al.: A comparative study of trabecular bone properties in the spine and femur using high resolution MRI and CT. J Bone Miner Res 1998; 13: pp. 122-132.
12. Veenland J.F., Link T.M., Konermann W., et. al.: Unraveling the role of structure and density in determining vertebral bone strength. Calcif Tissue Int 1997; 61: pp. 474-479.
13. Lynch J.A., Hawkes D.J., Buckland-Wright J.C.: Analysis of texture in macroradiographs of osteoarthritic knees using the fractal signature. Phys Med Biol 1991; 36: pp. 709-722.
14. Lee R.L., Dacre J.E., Hart D.J., et. al.: Femoral neck trabecular patterns predict osteoporotic fractures. Med Phys 2002; 29: pp. 1391-1396.
15. Beaupied H., Chappard C., Basillais A., et. al.: Effect of specimen conditioning on the microarchitectural parameters of trabecular bone assessed by micro-computed tomography. Phys Med Biol 2006; 51: pp. 4621-4634.
16. Benhamou C.L., Poupon S., Lespessailles E., et. al.: Fractal analysis of radiographic trabecular bone texture and bone mineral density: two complementary parameters related to osteoporotic fractures. J Bone Miner Res 2001; 16: pp. 697-704.
17. Bonnet N., Gadois C., McCloskey E., et. al.: Protective effect of beta blockers in postmenopausal women: Influence on fractures, bone density, micro and macroarchitecture. Bone 2007; 40: pp. 1209-1216.
18. Lespessailles E., Poupon S., Niamane R., et. al.: Fractal analysis of trabecular bone texture on calcaneus radiographs: effects of age, time since menopause and hormone replacement therapy. Osteoporosis Int 2002; 13: pp. 366-372.
19. Lespessailles E., Siroux V., Poupon S., et. al.: Long-term corticosteroid therapy induces mild changes in trabecular bone texture. J Bone Miner Res 2000; 15: pp. 747-753.
20. Pothuaud L., Benhamou C.L., Porion P., et. al.: Fractal dimension of trabecular bone projection texture is related to three-dimensional microarchitecture. J Bone Miner Res 2000; 15: pp. 691-699.
21. Pothuaud L., Lespessailles E., Harba R., et. al.: Fractal analysis of trabecular bone texture on radiographs: discriminant value in postmenopausal osteoporosis. Osteoporosis Int 1998; 8: pp. 618-625.
22. Caligiuri P., Giger M.L., Favus M.J., et. al.: Computerized radiographic analysis of osteoporosis: preliminary evaluation. Radiology 1993; 186: pp. 471-474.
23. Caligiuri P., Giger M.L., Favus M.: Multifractal radiographic analysis of osteoporosis. Med Phys 1994; 21: pp. 503-508.
24. Chinander M.R., Giger M.L., Martell J.M., et. al.: Computerized radiographic texture measures for characterizing bone strength: a simulated clinical setup using femoral neck specimens. Med Phys 1999; 26: pp. 2295-2300.
25. Chinander M.R., Giger M.L., Martell J.M., et. al.: Computerized analysis of radiographic bone patterns: effect of imaging conditions on performance. Med Phys 2000; 27: pp. 75-85.
26. Jiang C., Giger M.L., Chinander M.R., et. al.: Characterization of bone quality using computer-extracted radiographic features. Med Phys 1999; 26: pp. 872-879.
27. Wilkie J.R., Giger M.L., Chinander M.R., et. al.: Comparison of radiographic texture analysis from computed radiography and bone densitometry systems. Med Phys 2004; 31: pp. 882-891.
28. Vokes T., Giger M., Chinander M., et. al.: Radiographic texture analysis of densitometer-generated calcaneus images differentiates postmenopausal women with and without fractures. Osteoporosis Int 2006; 17: pp. 1472-1482.
29. Metz C.E.: ROC methodology in radiologic imaging. Invest Radiol 1986; 21: pp. 720-733.
30. Metz C.E., Herman B.A., Roe C.A.: Statistical comparison of two ROC-curve estimates obtained from partially-paired datasets. Med Decis Making 1998; 18: pp. 110-121.