
Rationale and Objectives
The authors of this study used the perspectives of residency program directors (PDs) nationally to explore whether trainees are adequately prepared to utilize and interpret medical imaging as interns, to identify the types of imaging skills most important for residency, and to begin to address current shortcomings in radiology education.
Materials and Methods
The authors created a survey using a modified version of Accreditation Council for Graduate Medical Education radiology milestones and sent it to 100 randomly selected PDs each in pediatrics, internal medicine, obstetrics and gynecology, and general surgery. The survey asked PDs to assess the actual and desired imaging skills of their incoming interns, the incoming interns’ variability of skill level upon matriculation, and which imaging skills were most important from the PDs’ perspective.
Results
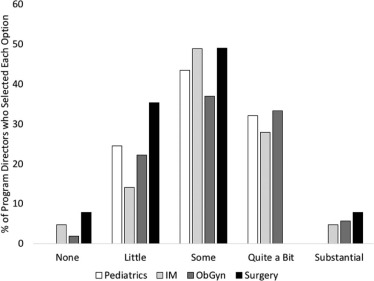
PDs from all specialties identified a significant shortcoming relative to their expectations for both image interpretation and utilization skills. Additionally, PDs identified a significant variability in imaging skills, and described that variability as a hindrance to their programs. All of the potential imaging skills were rated as highly important with little clinically relevant difference between them.
Discussion
This multidisciplinary national survey found a deficiency in imaging education among interns across specialties and substantiates calls for formalized and improved radiology education in undergraduate medical education. Additionally, PDs had difficulty distinguishing which skills were most important, suggesting an unclear understanding of imaging ability needs for interns in respective specialties. More specific needs assessments are warranted on a national level.
Introduction
Medical imaging has become increasingly integral to the practice of medicine and, accordingly, increasingly emphasized in undergraduate medical education (UME) . However, there are variations in how much is taught in medical school, ranging from no formal imaging education to required radiology clerkships . Additionally, there are large variations in what is taught to medical students , despite the existence of published curriculum recommendations . Prior studies report that graduate medical education (GME) trainees, medical school deans, and radiology chairs desire a concerted effort to strengthen imaging skills in the UME curriculum . Importantly, some major specialties, such as internal medicine, fail to include even one imaging milestone in their standardized assessments , currently leaving formal development and assessment of imaging skills solely to the UME curriculum.
Considering these existing shortcomings, it seems unlikely that current UME in the United States is sufficiently providing the imaging skills most useful for intern year. In fact, a national study of interns recently reported a lack of confidence in a variety of important imaging skills, including determining normal from abnormal in basic imaging modalities, indications for various imaging tests, and when to consult radiologists . A convenience sample survey of program directors (PDs) from a variety of specialties identified that interns were generally adequately prepared ; however, this early study had a limited sampling frame and did not account for variation between specialties. Thus, the question remains whether UME is sufficiently preparing students for clinical practice as interns.
Get Radiology Tree app to read full this article<
Materials and Methods
Questionnaire
Get Radiology Tree app to read full this article<
Get Radiology Tree app to read full this article<
TABLE 1
(a) Current Diagnostic Radiology Milestones for Imaging Interpretation (“Medical Knowledge 2: Interpretation of Examinations”). (b) Modified \* Milestone Tool to Assess Interpretation Skills Below Level 1
(a) Level 1 Level 2 Level 3 Level 4 Level 5 Makes core observations, formulates differential diagnosis, and recognizes critical findings Makes secondary observations, narrows the differential diagnosis, and describes management options Provides accurate, focused, and efficient interpretations Makes subtle observations Demonstrates expertise and efficiency at a level expected of a subspecialist Prioritizes differential diagnoses and recommends management Suggests a single diagnosis when appropriate Advances the art and science of image interpretation Differentiates normal from abnormal Integrates current research and literature with guidelines to recommend management
(b) Level 1 Level 2 Level 3 Level 4 Unable to consistently recognize major anatomical landmarks Recognizes normal from abnormal Makes core observations, formulates differential diagnosis, and recognizes critical findings Makes secondary observations and narrows the differential diagnosis
Part (a) is the Milestone language pulled directly from published Accreditation Council for Graduate Medical Education residency milestones regarding image interpretation skills. Part (b) is the modified Milestone language used in the survey. Language was simplified and shortened to increase clarity, and additional levels below the original level 1 were added to provide better representation of the imaging skills of recent medical school graduates.
Get Radiology Tree app to read full this article<
TABLE 2
(a) Current Diagnostic Radiology Milestones for Imaging Utilization (“Patient Care and Technical Skills 1: Consultant”). (b) Modified \* Milestone Tool to Assess Utilization Skills Below Level 1
(a) Level 1 Level 2 Level 3 Level 4 Level 5 Uses established evidence-based imaging guidelines such as American College of Radiology (ACR) Appropriateness Criteria Recommends appropriate imaging of common conditions independently Recommends appropriate imaging of uncommon conditions independently Integrates current research and literature with guidelines, taking into consideration cost-effectiveness and risk-benefit analysis, to recommend imaging Participates in research, development, and implementation of imaging guidelines Appropriately uses the Electronic Health Record to obtain relevant clinical information
(b) Level 1 Level 2 Level 3 Level 4 “Shotgun” order imaging Uses evidence-based imaging guidelines (such as the American College of Radiology Appropriateness Criteria) Uses appropriate imaging of common conditions without need of guidelines or senior staff Uses appropriate imaging of uncommon conditions without need of guidelines or senior staff
Part (a) is the Milestone language pulled directly from published Accreditation Council for Graduate Medical Education residency milestones regarding imaging utilization skills. Part (b) is the modified Milestone language used in the survey. Language was simplified and shortened to increase clarity, and an additional level below the original level 2 was added to provide better representation of the imaging skills of recent medical school graduates.
Get Radiology Tree app to read full this article<
Get Radiology Tree app to read full this article<
Get Radiology Tree app to read full this article<
Questionnaire Paradata
National Data
Get Radiology Tree app to read full this article<
Get Radiology Tree app to read full this article<
Analyses
Get Radiology Tree app to read full this article<
Get Radiology Tree app to read full this article<
Get Radiology Tree app to read full this article<
Get Radiology Tree app to read full this article<
Get Radiology Tree app to read full this article<
Institutional Review Board (IRB) Approval
Get Radiology Tree app to read full this article<
Funding
Get Radiology Tree app to read full this article<
Results
Reliability and Validity Evidence
Get Radiology Tree app to read full this article<
Respondents and Demographics
Get Radiology Tree app to read full this article<
Get Radiology Tree app to read full this article<
TABLE 3
Demographics of Responding Program Directors (PD), 2016–2017
National Pediatrics Internal Medicine Obstetrics and Gynecology General Surgery PD Age [y] M (SD) 49.6 (9.1) 47.9 (8.8) 50.3 (8.3) 49.5 (8.1) 50.7 (10.9) PD Male N (%) 134 (62.9) 28 (52.8) 29 (59.2) 35 (62.5) 42 (76.4) PD Tenure [y] M (SD) 6.26 (6.02) 7.4 (6.2) 6.8 (5.8) 6.8 (7.3) 4.1 (3.7) Program size [total residents] M (SD) 35.8 (28.2) 39.6 (25.9) 59.9 (36.6) 17.7 (8.3) 29.3 (17.3) Geography West n (%) 33 (15.3) 8 (15.1) 12 (24.5) 8 (14.0) 5 (9.1) Midwest n (%) 68 (31.5) 17 (32.1) 7 (14.3) 16 (28.1) 27 (49.1) South n (%) 63 (29.2) 15 (28.3) 20 (40.8) 17 (29.8) 12 (21.8) Northeast n (%) 50 (23.1) 13 (24.5) 10 (20.4) 16 (28.1) 11 (20.0)
M, mean; n , number; SD, standard deviation.
Get Radiology Tree app to read full this article<
Instructional Resources
Get Radiology Tree app to read full this article<
Get Radiology Tree app to read full this article<
Get Radiology Tree app to read full this article<
Get Radiology Tree app to read full this article<
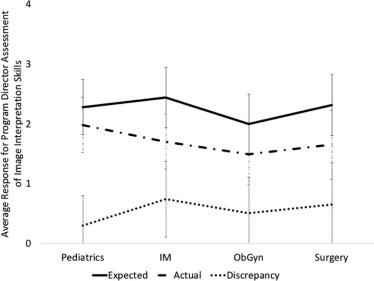
Interpretation Ability: Expected and Actual
Get Radiology Tree app to read full this article<
Get Radiology Tree app to read full this article<
TABLE 4
Survey Responses of Program Directors, Both Nationally and by Specialty, 2016–1017
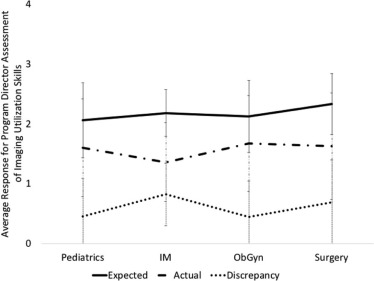
National Pediatrics Internal Medicine Obstetrics and Gynecology General Surgery Actual interpretation ability M (SD) 1.70 (0.53) 1.98 (0.46) 1.70 (0.46) 1.49 (0.50) 1.65 (0.58) Expected interpretation ability M (SD) 2.25 (0.35) 2.28 (0.46) 2.44 (0.50) 2.00 (0.50) 2.31 (0.51) Interpretation discrepancy (expected-actual) M (SD) 0.55 (0.63) .30 (0.50) 0.74 (0.63) 0.51 (0.60) 0.66 (0.70) Actual utilization ability M (SD) 1.57 (0.80) 1.60 (0.82) 1.36 (0.66) 1.67 (0.80) 1.63 (0.89) Expected utilization ability M (SD) 2.17 (0.55) 2.06 (0.63) 2.18 (0.39) 2.12 (0.60) 2.33 (0.51) Utilization discrepancy (expected-actual) M (SD) 0.60 (0.64) .45 (0.64) 0.82 (0.52) 0.44 (0.60) 0.69 (0.70) When to order imaging tests M (SD) 3.76 (0.64) 3.67 (0.55) 3.79 (0.68) 3.80 (0.68) 3.79 (0.67) What imaging tests to order M (SD) 3.77 (0.75) 3.67 (0.68) 3.72 (0.80) 3.75 (0.78) 3.92 (0.74) Communication of imaging results with physicians M (SD) 4.08 (0.81) 4.04 (0.77) 4.05 (0.72) 4.04 (0.94) 4.19 (0.77) Communication of imaging results with patients/caregivers M (SD) 4.01 (0.76) 4.08 (0.62) 4.02 (0.72) 3.85 (0.98) 4.08 (0.68) Optimal to teach imaging in residency, yes, n (%) 130 (65.0) 32 (60.4) 26 (60.5) 40 (74.1) 32 (64.0) Amount of formal imaging instruction M (SD) 3.01 (0.89) 3.08 (0.76) 3.14 (0.89) 3.19 (0.91) 2.65 (0.93) Variability in imaging skills M (SD) 3.25 (0.85) 3.17 (0.75) 3.60 (0.73) 3.08 (0.90) 3.24 (0.92) Expected improvement from uniform imaging skills M (SD) 3.36 (0.93) 3.30 (0.85) 3.50 (0.67) 3.24 (1.12) 3.42 (1.00) Expected improvement from uniform medical skills M (SD) 3.54 (0.99) 3.53 (0.99) 3.88 (0.77) 3.37 (0.90) 3.46 (1.18)
M, mean; n , number; SD, standard deviation.
Get Radiology Tree app to read full this article<
Get Radiology Tree app to read full this article<
Interpretation Ability: Discrepancies
Get Radiology Tree app to read full this article<
Get Radiology Tree app to read full this article<
TABLE 5
Ranked Comparison by Residency Program Directors of the Mean Interpretation Discrepancy, by Specialty, 2016–2017 \* , †
Mean Interpretation Discrepancy Ordinal Rank 1 2 3 4 IM 0.74 1 1.00 0.59 0.07 <.001 Surgery 0.66 2 1.00 0.22 0.002 ObGyn 0.51 3 1.00 0.04 Pediatrics 0.30 4 1.00
IM, internal medicine; ObGyn, obstetrics and gynecology; Surgery, general surgery.
Get Radiology Tree app to read full this article<
Get Radiology Tree app to read full this article<
Get Radiology Tree app to read full this article<
Get Radiology Tree app to read full this article<
Utilization Ability: Expected and Actual
Get Radiology Tree app to read full this article<
Get Radiology Tree app to read full this article<
Get Radiology Tree app to read full this article<
Utilization Ability: Discrepancies
Get Radiology Tree app to read full this article<
Get Radiology Tree app to read full this article<
TABLE 6
Ranked Comparison by Residency Program Directors of the Mean Utilization Discrepancy, by Specialty, 2016–2017 \* , †
Mean Utilization Discrepancy Ordinal Rank 1 2 3 4 IM 0.82 1 1.00 0.31 0.002 0.001 Surgery 0.69 2 1.00 0.06 0.04 Pediatrics 0.45 3 1.00 0.88 ObGyn 0.44 4 1.00
IM, internal medicine; ObGyn, obstetrics and gynecology; Surgery, general surgery.
Get Radiology Tree app to read full this article<
Get Radiology Tree app to read full this article<
Get Radiology Tree app to read full this article<
Get Radiology Tree app to read full this article<
Imaging Education Variability
Get Radiology Tree app to read full this article<
TABLE 7
Ranked Comparison by Residency Program Directors of the Mean Variability Among Incoming Trainees, by Specialty, 2016–2017 \* , †
Mean Variability Among Incoming Trainees Ordinal Rank 1 2 3 4 IM 3.60 1 1.00 0.04 0.007 0.005 Surgery 3.24 2 1.00 0.65 0.38 Pediatrics 3.17 3 1.00 0.62 ObGyn 3.08 4 1.00
IM, internal medicine; ObGyn, obstetrics and gynecology; Surgery, general surgery.
Get Radiology Tree app to read full this article<
Get Radiology Tree app to read full this article<
Get Radiology Tree app to read full this article<
Get Radiology Tree app to read full this article<
Specific Skills
Get Radiology Tree app to read full this article<
TABLE 8
Responses for the Importance of Specific Imaging Skills
Not at All Important Of Little Importance Of Average Importance Very Important Absolutely Essential Communication of imaging results with physicians, n (%) 0 (0.0) 6 (3.0) 41 (20.5) 87 (43.5) 66 (33.0) Communication of imaging results with patients/caregivers, n (%) 1 (0.5) 5 (2.5) 39 (19.6) 103 (51.8) 51 (25.6) What imaging tests to order, n (%) 0 (0.0) 10 (5.0) 54 (27.0) 108 (54.0) 28 (14.0) When to order imaging tests, n (%) 0 (0.0) 3 (1.5) 62 (30.9) 116 (57.7) 20 (10.0)
n , number.
TABLE 9
Ranked Comparison by Residency Program Directors of Specific Imaging Skills, 2016–2017 \* , †
Mean Importance of Skill Ordinal Rank 1 2 3 4 Communication of imaging results with physicians 4.08 1 1.00 0.28 <.001 <.001 Communication of imaging results with patients/caregivers 4.01 2 1.00 0.002 <.001 What imaging tests to order 3.77 3 1.00 0.67 When to order imaging tests 3.76 4 1.00
Get Radiology Tree app to read full this article<
Get Radiology Tree app to read full this article<
Get Radiology Tree app to read full this article<
Nonresponse Bias Analysis
Get Radiology Tree app to read full this article<
Get Radiology Tree app to read full this article<
Discussion
Get Radiology Tree app to read full this article<
Get Radiology Tree app to read full this article<
Get Radiology Tree app to read full this article<
Shortcomings in Medical School Imaging Education
Get Radiology Tree app to read full this article<
Get Radiology Tree app to read full this article<
Get Radiology Tree app to read full this article<
Specific Skills
Get Radiology Tree app to read full this article<
Get Radiology Tree app to read full this article<
Future Implications
Get Radiology Tree app to read full this article<
Get Radiology Tree app to read full this article<
Get Radiology Tree app to read full this article<
Get Radiology Tree app to read full this article<
Get Radiology Tree app to read full this article<
Get Radiology Tree app to read full this article<
Limitations
Get Radiology Tree app to read full this article<
Conclusion
Get Radiology Tree app to read full this article<
Acknowledgments
Get Radiology Tree app to read full this article<
Supplementary Data
Get Radiology Tree app to read full this article<
Appendix S1
Get Radiology Tree app to read full this article<
Get Radiology Tree app to read full this article<
Get Radiology Tree app to read full this article<
Get Radiology Tree app to read full this article<
Get Radiology Tree app to read full this article<
References
1. Straus C.M., Webb E.M., Kondo K.L., et. al.: Medical student radiology education: summary and recommendations from a national survey of medical school and radiology department leadership. J Am Coll Radiol 2014; 11: pp. 606-610. https://doi.org/10.1016/j.jacr.2014.01.012
2. Webb E.M., Naeger D.M., McNulty N.J., et. al.: Needs assessment for standardized medical student imaging education. Acad Radiol 2015; 22: pp. 1214-1220. https://doi.org/10.1016/j.acra.2015.03.020
3. Smith-Bindman R., Miglioretti D.L., Johnson E., et. al.: Use of diagnostic imaging studies and associated radiation exposure for patients enrolled in large integrated health care systems, 1996–2010. JAMA 2012; 307: pp. 2400-2409.
4. Poot J.D., Hartman M.S., Daffner R.H.: Understanding the US medical school requirements and medical students’ attitudes about radiology rotations. Acad Radiol 2012; 19: pp. 369-373. https://doi.org/10.1016/j.acra.2011.11.005
5. Linaker K.L.: Radiology undergraduate and resident curricula: a narrative review of the literature. J Chiropr Humanit 2015; 22: pp. 1-8. https://doi.org/10.1016/j.echu.2015.09.004
6. Lewis P., Shaffer K.: AMSER National Medical Student Curriculum in Radiology (out of print). MedEdPORTAL Publ 2010; https://doi.org/10.15766/mep_2374-8265.7897
7. Saha A., Roland R.A., Hartman M.S., et. al.: Radiology medical student education. Acad Radiol 2013; 20: pp. 284-289. https://doi.org/10.1016/j.acra.2012.10.006
8. Internal Medicine Milestone Group. Iobst W, Aagaard E, Bazari H, et al.; Available at https://www.acgme.org/Portals/0/PDFs/Milestones/InternalMedicineMilestones.pdf
9. Kondo K.L., Swerdlow M.: Medical student radiology curriculum. Acad Radiol 2013; 20: pp. 263-271. https://doi.org/10.1016/j.acra.2012.12.003
10. Corbett E.C., Danoff D., Fortin A.H., et. al.: AAMC Project on the Clinical Education of Medical Students—Initiatives-AAMC. n.d.; Available at https://www.aamc.org/initiatives/clinicalskills/
11. Lewis P., Donovan A.: AUR Online. n.d.; Available at https://www.aur.org/Secondary-Alliances.aspx?id=141
12. Eisen L.A., Berger J.S., Hegde A., et. al.: Competency in chest radiography: a comparison of medical students, residents, and fellows. J Gen Intern Med 2006; 21: pp. 460-465. https://doi.org/10.1111/j.1525-1497.2006.00427.x
13. Gunderman R.B., Siddiqui A.R., Heitkamp D.E., et. al.: The vital role of radiology in the medical school curriculum. AJR Am J Roentgenol 2003; 180: pp. 1239-1242.
14. Gunderman R.B., Stephens C.D.: Teaching medical students about imaging techniques. AJR Am J Roentgenol 2009; 192: pp. 859-861. https://doi.org/10.2214/AJR.08.1738
15. Lewis P.J., Shaffer K.: Developing a national medical student curriculum in radiology. J Am Coll Radiol 2005; 2: pp. 8-11. https://doi.org/10.1016/j.jacr.2004.07.016
16. Mullins M.E., Lieberman G., Shaffer K., et. al.: Factors to consider in the revision of educational objectives for medical students in radiology clerkships. J Am Coll Radiol 2005; 2: pp. 55-60. https://doi.org/10.1016/j.jacr.2004.07.004
17. Subramaniam R.M., Beckley V., Chan M., et. al.: Radiology curriculum topics for medical students. Acad Radiol 2006; 13: pp. 880-884. https://doi.org/10.1016/j.acra.2006.02.034
18. Subramaniam R.M., Kim C., Scally P., et. al.: Medical student radiology training: What are the objectives for contemporary medical practice?. Acad Radiol 2003; 10: pp. 295-300.
19. Subramaniam R., Sherriff J., Holmes K., et. al.: Radiology curriculum for medical students: Clinicians’ perspectives. Australas Radiol 2006; 50: pp. 442-446. https://doi.org/10.1111/j.1440-1673.2006.01620.x
20. Vydareny K.H., Amis E.S., Becker G.J., et. al.: Diagnostic radiology milestones. J Grad Med Educ 2013; 5: pp. 74-78. https://doi.org/10.4300/JGME-05-01s1-01
21. Artino A.R., Gehlbach H., Durning S.J.: AM last page: avoiding five common pitfalls of survey design. Acad Med 2011; 86: pp. 1327. https://doi.org/10.1097/ACM.0b013e31822f77cc
22. Artino A.R., La Rochelle J.S., Dezee K.J., et. al.: Developing questionnaires for educational research: AMEE Guide No. 87. Med Teach 2014; 36: pp. 463-474. https://doi.org/10.3109/0142159X.2014.889814
23. De Winter J.C., Dodou D.: Five-point Likert items: t test versus Mann-Whitney-Wilcoxon. Practical Assessment. Res Eval 2010; 15: pp. 1-12.
24. Jamieson S.: Likert scales: how to (ab)use them. Med Educ 2004; 38: pp. 1217-1218. https://doi.org/10.1111/j.1365-2929.2004.02012.x
25. Magee C., Rickards G., A Byars L., et. al.: Tracing the steps of survey design: a graduate medical education research example. J Grad Med Educ 2013; 5: pp. 1-5. https://doi.org/10.4300/JGME-D-12-00364.1
26. Norman G.: Likert scales, levels of measurement and the “laws” of statistics. Adv Health Sci Educ Theory Pract 2010; 15: pp. 625-632. https://doi.org/10.1007/s10459-010-9222-y
27. Vydareny K., Amis E.S., Becker G., et. al.: Milestones. n.d.; Available at http://www.acgme.org/What-We-Do/Accreditation/Milestones/Overview
28. ACGME : Accreditation Data System (ADS). n.d.; Available at: https://apps.acgme.org/ads/Public/Programs/Search
29. Cook D.A., Kuper A., Hatala R., et. al.: When assessment data are words: validity evidence for qualitative educational assessments. Acad Med 2016; 91: pp. 1359-1369. https://doi.org/10.1097/ACM.0000000000001175
30. Weir J.P.: Quantifying test-retest reliability using the intraclass correlation coefficient and the SEM. J Strength Cond Res 2005; 19: pp. 231-240.
31. Tavakol M., Dennick R.: Making sense of Cronbach’s alpha. Int J Med Educ 2011; 2: pp. 53-55. https://doi.org/10.5116/ijme.4dfb.8dfd
32. Carmines E.G., Zeller R.A.: Reliability and validity assessment.1979.Sage PublicationsBeverly Hills, CA Available at: http://www.uky.edu/~clthyn2/PS671/carmines_zeller_671.pdf
33. The American Association for Public Opinion Research : Standard definitions: final dispositions of case codes and outcome rates for surveys. 8th ed. AAPOR; Available at: https://www.aapor.org/AAPOR_Main/media/MainSiteFiles/Standard-Definitions2015_8thEd.pdf
34. Groves R.M., Peytcheva E.: The impact of nonresponse rates on nonresponse bias: a meta-analysis. Public Opin Q 2008; 72: pp. 167-189. https://doi.org/10.1093/poq/nfn011
35. Halbesleben J.R.B., Whitman M.V.: Evaluating survey quality in health services research: a decision framework for assessing nonresponse bias. Health Serv Res 2013; 48: pp. 913-930. https://doi.org/10.1111/1475-6773.12002
36. Phillips A.W., Reddy S., Durning S.J.: Improving response rates and evaluating nonresponse bias in survey: AMEE Guide No. 102. Med Teach 2016; 38: pp. 217-228.
37. Hallgren K.A.: Computing inter-rater reliability for observational data: an overview and tutorial. Tutor Quant Methods Psychol 2012; 8: pp. 23.
38. Accreditation Council for Graduate Medical Education : Number of Accredited Programs (2015–2016). This is a “database” published by the ACGME, and has no specified author. Available at https://apps.acgme.org/ads/Public/Reports/ReportRun?ReportId=3&CurrentYear=2015&AcademicYearId=2015
39. Liaison Committee on Medical Education : Functions and structure of a medical school: standards for accreditation of medical education programs leading to the M.D. degree. Available at: https://members/aamc.org/eweb/upload/Functions%20and%20Structure%20of%20a%20Medial%20School.pdf