
Rationale and Objectives
The Electronic Resident Application Service (ERAS) publishes monthly statistics before the match and the National Resident Matching Program publishes the match outcomes. We sought to determine whether early ERAS data influences applicant behavior and correlates with match outcomes.
Materials and Methods
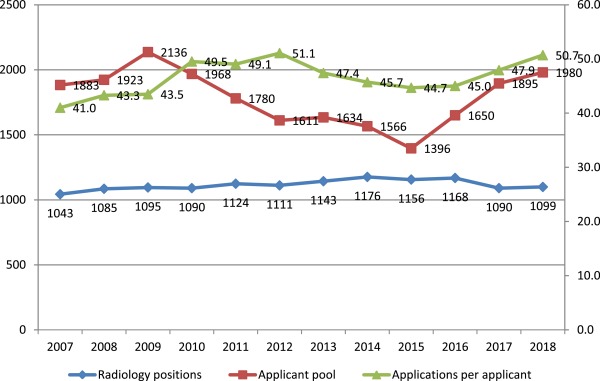
We searched the 2007–2017 ERAS archives for the applicant pool size (PS), the average number of applications per program (AP), and the average number of applications per applicant (AA) in November, before radiology match, and the 2007–2017 National Resident Matching Program archives for the average number of ranked applicants needed to fill each position (ANRA) and the number of unfilled positions (UP) in radiology match. Correlation coefficients were calculated for each pair.
Results
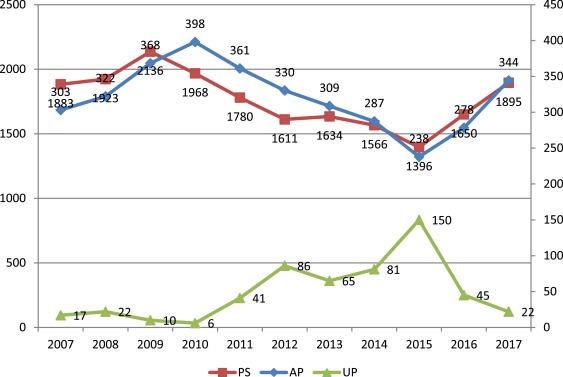
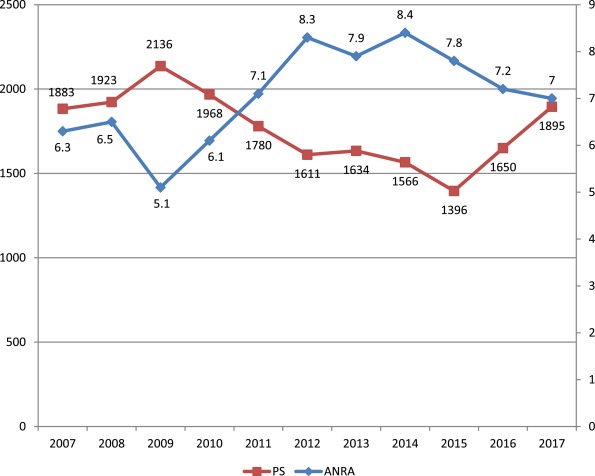
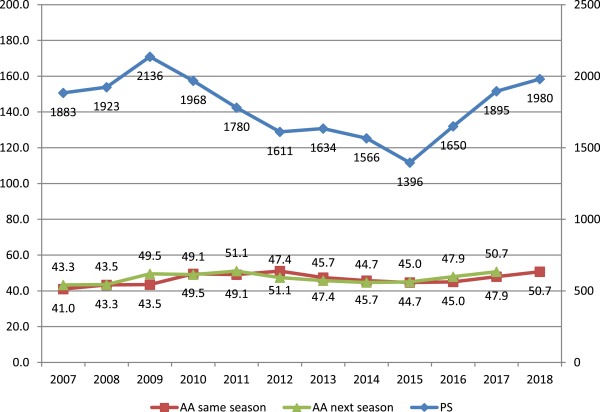
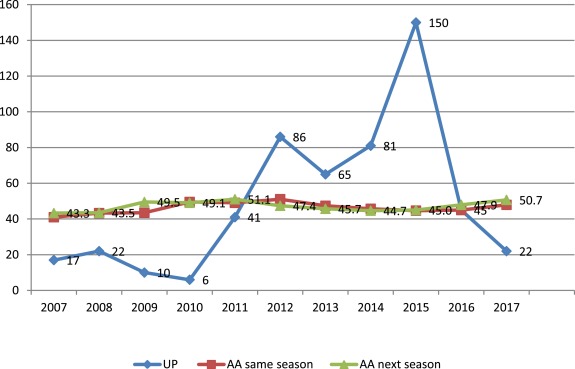
PS correlated very strongly with AP ( r = 0.80, p = 0.001708), UP ( r = −0.92, p = 0.000063) and ANRA ( r = −0.90, p = 0.000164). UP correlated strongly with ANRA ( r = 0.76, p = 0.006349) and AP ( r = −0.77, p = 0.005339). A trend to moderate correlation between AP and ANRA ( r = 0.58, p = 0.062686) and AA ( r = 0.53, p = 0.074395) did not reach statistical significance. There was no correlation between AA and PS in the same ( r = −0.05, p = 0.878585) or the following year ( r = 0.35, p = 0.297166), and AA and UP in the same ( r = 0.13, p = 0.701983) or the following year ( r = 0.32, p = 0.336136).
Conclusion
The real-time data reported by ERAS in November, before match, is a predictor of radiology match outcomes and can be used by all participants to limit their application and recruitment costs. Medical students applying to radiology do not consider either the real-time or historic data when submitting ERAS applications.
INTRODUCTION
Residency match is an expensive endeavor. While there is no specific radiology data on the estimated cost of resident recruitment, Brummond et al. ( ) found the average cost to be $9,000 per internal medicine training position. Applicant expenses are also high. The 2015 Cost of Applying to Residency Questionnaire Report ( ) shows that the average medical student interviewing for radiology residency spends $4,555, with a third needing to take an additional federal loan for the purpose.
In the competitive matching market, radiology programs and applicants tread a thin line between misallocating resources by over-interviewing and risking match failure by underinterviewing. Existing evidence suggests that medical students apply to too many programs. In February 2018, US medical school seniors sent out on average 50 radiology applications. This is a problem because excessive applications sap resources of applicants and programs alike. To aid all stakeholders, the National Resident Matching Program (NRMP) and the Electronic Resident Application Service (ERAS) make available historical and real-time data. The NRMP publishes yearly match outcomes, such as the number of unfilled radiology positions and the minimum average length of successful program, and applicant rank order lists ( ), while ERAS provides monthly applicant and program data during the recruitment season, such as the total number of applicants, as well as the average number of applications per program and per applicant ( ). The purpose of this research is to determine whether the real-time ERAS data published in November of the match season predict the following match outcomes and whether real-time and historical data influence US medical student behavior.
MATERIALS AND METHODS
Get Radiology Tree app to read full this article<
RESULTS
Get Radiology Tree app to read full this article<
Get Radiology Tree app to read full this article<
Get Radiology Tree app to read full this article<
Get Radiology Tree app to read full this article<
DISCUSSION
Get Radiology Tree app to read full this article<
Get Radiology Tree app to read full this article<
Get Radiology Tree app to read full this article<
Get Radiology Tree app to read full this article<
Get Radiology Tree app to read full this article<
Get Radiology Tree app to read full this article<
Get Radiology Tree app to read full this article<
Get Radiology Tree app to read full this article<
Get Radiology Tree app to read full this article<
Get Radiology Tree app to read full this article<
Get Radiology Tree app to read full this article<
Get Radiology Tree app to read full this article<
ACKNOWLEDGMENTS
Get Radiology Tree app to read full this article<
References
1. Brummond A., Sefcik S., Halvorsen A.J., et. al.: Resident recruitment costs: a national survey of internal medicine program directors. Am J Med 2013; 126: pp. 646-653.
2. Available at: https://www.aamc.org/download/430902/data/costofapplyingtoresidency.pdf . Accessed March 21, 2018.
3. Available at: http://www.nrmp.org/report-archives/ . Accessed March 21, 2018.
4. Available at: https://www.aamc.org/services/eras/stats/359278/stats.html . Accessed March 21, 2018.
5. Pearson K.: Notes on regression and inheritance in the case of two parents. Proc R Soc London 20 June 1895; 58: pp. 240-242.
6. AAMC Apply smart: new data to consider. Available at: https://students-residents.aamc.org/applying-residency/article/apply-smart-data-consider/ . Accessed March 21, 2018.
7. Charting outcomes in the Match 2016: USMLE Step 1 Scores of US allopathic seniors/ Diagnostic Radiology (p.49) Available at: http://www.nrmp.org/wp-content/uploads/2016/09/Charting-Outcomes-US-Allopathic-Seniors-2016.pdf . Accessed March 21, 2018.
8. AAMC Organization of student representatives. Available at: https://www.aamc.org/download/300722/data/adviceonapplyingtoresidencyprograms.pdf . Accessed March 21, 2018.
9. Available at: https://students-residents.aamc.org/applying-residency/article/fees-eras-residency-applications . Accessed March 21, 2018.
10. Charting outcomes in the Match 2016: Number of continuous ranks of US allopathic seniors/ Diagnostic Radiology (p.47). Available at: http://www.nrmp.org/wp-content/uploads/2016/09/Charting-Outcomes-US-Allopathic-Seniors-2016.pdf . Accessed March 21, 2018.
11. AAMC AAMC tuition and student fees for the first year medical students. Available at: https://www.aamc.org/data/tuitionandstudentfees/ . Accessed March 21, 2018.
12. NRMP Results of 2017 NRMP applicant survey by preferred specialty and applicant type. Available at: https://mk0nrmpcikgb8jxyd19h.kinstacdn.com/wp-content/uploads/2017/09/Applicant-Survey-Report-2017.pdf . Accessed March 21, 2018.
13. Available at: http://www.nrmp.org/wp-content/uploads/2016/09/NRMP-2016-Program-Director-Survey.pdf . Accessed March 21, 2018.
14. Edmond M.B., Deschenes J.L., Eckler M., et. al.: Racial bias in using USMLE step I scores to grant internal medicine residency interviews. Acad Med 2001; 76: pp. 1253-1256.
15. Council on graduate medical education 17th report. Minorities in medicine: an ethnic and cultural challenge for physician training. Available at: https://www.hrsa.gov/advisorycommittees/bhpradvisory/cogme/Reports/seventeenthrpt.pdf . Accessed March 21, 2018.
16. Lerner R., Nagai A.K.. Racial and ethnic preferences and consequences at the University of Maryland School of Medicine. Available at: http://www.ceousa.org/attachments/article/653/MDMED.pdf . Accessed March 21, 2018.
17. Wayne State University School of Medicine Career Planning: Match Planning Strategies. Available at: https://careerplanning.med.wayne.edu/match-planning . Accessed March 21, 2018.
18. Family Medicine Interest Group: Tips on Residency Selection. Available at: http://www.aafp.org/dam/AAFP/documents/medical_education_residency/fmig/tips_resselection.pdf . Accessed March 21, 2018.
19. Available at: http://www.nrmp.org/wp-content/uploads/2015/09/Applicant-Survey-Report-2015.pdf . Accessed March 21, 2018.
20. The Economist What is information asymmetry? How greater transparency makes markets work better. Available at: https://www.economist.com/blogs/economist-explains/2016/09/economist-explains-economics-1 . Accessed March 21, 2018.
21. NRMP Impact of length of rank order list on match results: 2002-2018 main residency match. Available at: http://www.nrmp.org/wp-content/uploads/2018/03/Impact-of-Length-of-Rank-Order-List-on-Match-Results-2018-Main-Match.pdf . Accessed March 21, 2018.