
Rationale and Objectives
To determine the incidence of radiology resident preliminary interpretation errors for plain film, body computed tomography, and neuroradiology (neuro)computed tomographic examinations read on call.
Materials and Methods
We retrospectively reviewed the data in a prospectively acquired resident quality assurance (QA) database dating between January 2000 and March 2007. The database comprises all imaging studies initially interpreted by an on-call resident and later reviewed by a board-certified attending radiologist who determined the level of discrepancy between the two interpretations according to a graded scale from 0 (no discrepancy) to 3 (major discrepancy). We reviewed the data with respect to resident training level, imaging modality, and variance level. Statistical analysis was performed with χ 2 test, α = 0.05. We compared our results with other published series studying resident and attending accuracy.
Results
A total of 141,381 cases were entered into the database during the review period. Of all examinations, 95.7% had zero variance, 3.3% minor variance, and 1.0% major variance. There was a slight, statistically significant increase in overall accuracy with increased resident year from 95.4% of examinations read by first-year residents (R1s) to 96.1% by fourth-year resident (R4s) ( P < .0001). Overall percentages of exams with major discrepancies were 1.0% for R1s, 1.1% for second-year residents, 1.0% for third-year residents, and 0.98% for R4s.
Conclusions
The majority of preliminary resident interpretations are highly accurate. The incidence of major discrepancies is extremely low and similar, even with R1s, to that of attending radiologists published in other studies. A slight, statistically significant decrease in the error rate is detectable as residents gain experience throughout the 4 years of residency.
It has been shown that in an emergency department setting, radiologist coverage, including that by residents, is more accurate than having imaging studies interpreted by the emergency medicine physicians ( ). Many institutions struggle to provide around-the-clock attending radiologist coverage, either with in-house coverage or using teleradiology. Academic institutions frequently cover the hours with on-call residents. Although some consider resident call an excellent opportunity for trainees to gain valuable experience making independent interpretations, others question the accuracy and safety of this practice. The Radiology Resident Review Committee of the Accreditation Council for Graduate Medical Education recently began requiring 12 months of residency training before allowing a resident to take independent call ( ). Previous studies have assessed the discrepancy rates of resident and attending radiologist interpretations. Most institutions found a slight increase in resident accuracy with an increase in training level, but with error rates quite similar to those of attending radiologists ( ) ( Tables 1–3 ).
Table 1
A Comparison to Previous Reviews of Resident Discrepancy Rates
n Major Discrepancy Rate Minor Discrepancy Rate Head CT Roszler et al ( ) 289 2% 2% Erly et al ( ) 1,324 2% 7% Wysoki et al ( ) 419 1.7% 2.6% Current study 30,973 1.4% (var 2+3) 4.9% (var 1) Body CT Tieng et al ( ) 203 10% 20% Carney et al ( ) 928 1% 5.4% Wechsler et al ( ) 598 1.2% 6.5% Current study 17,276 2.5% (var 2+3) 7.3% (var 1) All Ruchman et al ( ) 11,908 2.6% 21.4% Current study 141,381 1.0% (var 2+3) 3.3% (var 1)
CT, computed tomography; var, variance.
Table 2
A Comparison to Reviews of Attending Radiologist Discrepancy Rates
n Total Discrepancy Rate Major Discrepancy Rate Minor Discrepancy Rate Head CT Erly et al ( ) 531 5% 2% 3% Current study 30,973 6.3% (var 1–3) 1.4% (var 2+3) 4.9% (var 1) Body CT Yoon et al ( ) 203 29.9% 27.5% ⁎ 2.3% ⁎ Pomerantz et al ( ) 1,810 5% — — Current study 17,276 9.8% (var 1–3) 2.5% (var 2+3) 7.3% (var 1)
CT, computed tomography; var, variance.
⁎ These numbers were not published in the report; instead, they were calculated from the statistics provided assuming a change in patient care constitutes a major discrepancy.
Table 3
A Comparison to a RADPEER-based Review of Attending Radiologist Discrepancy Rates
RADPEER Borgstede et al ( ) Current Study_n_ = 20,286n = 141,381 % Misinterpreted (Level 3 or 4) % with Significant Discrepancy (Level 2 or 3) Computed tomography 1.7% 1.79% Plain film 0.65% 0.65% All 0.8% 1.04%
Get Radiology Tree app to read full this article<
Get Radiology Tree app to read full this article<
Materials and methods
Get Radiology Tree app to read full this article<
Get Radiology Tree app to read full this article<
Get Radiology Tree app to read full this article<
Get Radiology Tree app to read full this article<
Get Radiology Tree app to read full this article<
Get Radiology Tree app to read full this article<
Results
Proportions of Examinations by Modality and Resident Year
Get Radiology Tree app to read full this article<
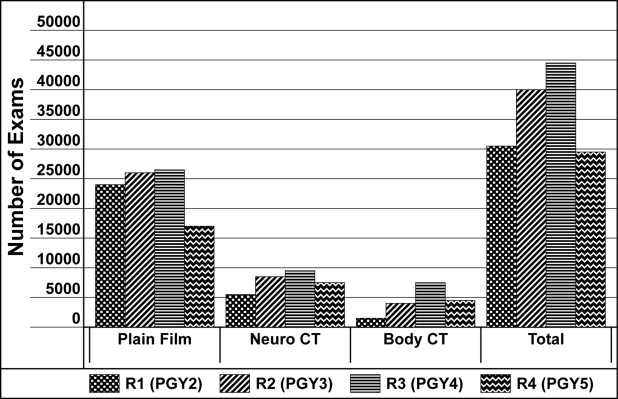
Get Radiology Tree app to read full this article<
Overall Variance by Modality
Get Radiology Tree app to read full this article<
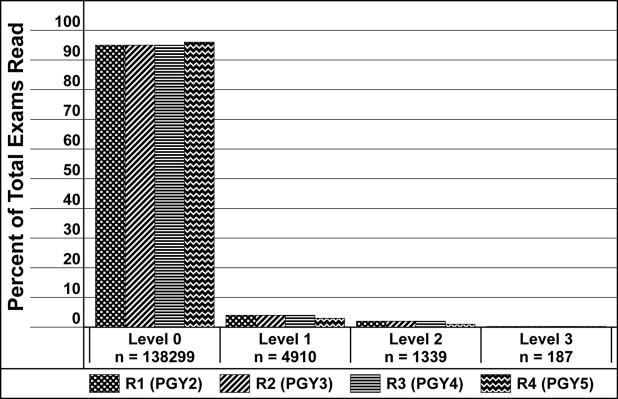
Table 4
Variation Percentage by Modality
% with Variance 0 % with Variance 1 % with Variance 2 % with Variance 3 Plain film 97.37 1.98 0.59 0.06 Body CT 90.22 7.31 2.13 0.34 Neuro CT 93.66 4.93 1.20 0.21 Overall 95.67 3.28 0.91 0.13
CT, computed tomography; Neuro, neuroradiology.
Get Radiology Tree app to read full this article<
Overall Variance by Resident Year
Get Radiology Tree app to read full this article<
Table 5
Variation Percentage by Training Level
% with Variance 0 % with Variance 1 % with Variance 2 % with Variance 3 R1 95.38 3.62 0.91 0.09 R2 95.56 3.30 1.01 0.13 R3 95.69 3.28 0.87 0.16 R4 96.13 2.90 0.85 0.13
% with Variance 0 or 1 % with Variance 2 or 3 R1 99.00 1.00 R2 98.86 1.14 R3 98.97 1.03 R4 99.02 0.98
R1, first-year resident; R2, second-year resident; R3, third-year resident; R4, fourth-year resident.
Get Radiology Tree app to read full this article<
Resident Year Variance by Modality
Get Radiology Tree app to read full this article<
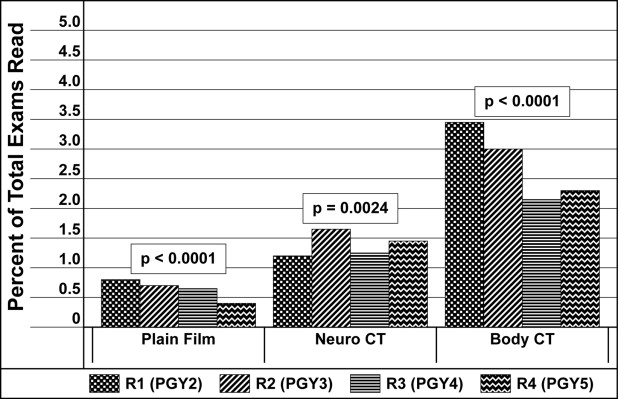
Get Radiology Tree app to read full this article<
Discussion
Get Radiology Tree app to read full this article<
Get Radiology Tree app to read full this article<
Get Radiology Tree app to read full this article<
Get Radiology Tree app to read full this article<
Get Radiology Tree app to read full this article<
Get Radiology Tree app to read full this article<
Get Radiology Tree app to read full this article<
Conclusion
Get Radiology Tree app to read full this article<
Acknowledgment
Get Radiology Tree app to read full this article<
References
1. Eng J., Mysko W.K., Weller G.E., et. al.: Interpretation of emergency department radiographs: a comparison of emergency medicine physicians with radiologists, residents with faculty, and film with digital display. AJR Am J Roentgenol 2000; 175: pp. 1233-1238.
2. ACGME Program Requirements for Graduate Medical Education in Diagnostic Radiology. Section VI.B.2. Effective July 1, 2008 http://www.acgme.org/acWebsite/downloads/RRC_progReq/420_dr_07012008.pdf Accessed April 4, 2007
3. Roszler M.H., McCarroll K.A., Rashid T., et. al.: Resident interpretation of emergency computed tomographic scans. Invest Radiol 1991; 26: pp. 374-376.
4. Erly W.K., Berger W.G., Krupinski E., et. al.: Radiology resident evaluation of head CT scan orders in the emergency department. Am J Neuroradiol 2002; 23: pp. 103-107.
5. Wysoki M.G., Nassar C.J., Koenigsberg R.A., et. al.: Head trauma: CT scan interpretation by radiology residents versus staff radiologists. Radiology 1998; 208: pp. 125-128.
6. Carney E., Kempf J., DeCarvalho V., et. al.: Preliminary interpretations of after-hours CT and sonography by radiology residents versus final interpretations by body imaging radiologists at a level I trauma center. AJR Am J Roentgenol 2003; 181: pp. 367-373.
7. Wechsler R.J., Spettell C.M., Kurtz A.B., et. al.: Effects of training and experience in interpretation of emergency body CT scans. Radiology 1996; 199: pp. 717-720.
8. Tieng N., Grinberg D., Li S.F.: Discrepancies in interpretations of ED body computed tomographic scans by radiology residents. Am J Emerg Med 2007; 25: pp. 45-48.
9. Ruchman R.B., Jaeger J., Wiggins E.F., et. al.: Preliminary radiology resident interpretations versus final attending radiologist interpretations and the impact on patient care in a community hospital. AJR Am J Roentgenol 2007; 189: pp. 523-526.
10. Ahmed N., Guo A., Elhassan H., et. al.: Residents managed trauma adequately using their own radiological interpretation as compared with “nighthawk” radiologists. J Trauma 2006; 61: pp. 555-556.
11. Erly W.K., Ashdown B.C., Lucio R.W., et. al.: Evaluation of emergency CT scans of the head: is there a community standard?. AJR Am J Roentgenol 2003; 180: pp. 1727-1730.
12. Yoon L.S., Haims A.H., Brink J.A., et. al.: Evaluation of an emergency radiology quality assurance program at a level I trauma center: abdominal and pelvic CT studies. Radiology 2002; 224: pp. 42-46.
13. Pomerantz S.M., Daly B., Krebs T.L., et. al.: Quality assurance for abdominal CT: a rapid, computer-assisted technique. AJR Am J Roentgenol 1996; 167: pp. 1141-1145.
14. Borgstede J.P., Lewis R.S., Bhargavan M., et. al.: RADPEER quality assurance program: a multifacility study of interpretive disagreement rates. J Am Coll Radiol 2004; 1: pp. 59-65.