
Rationale and Objectives
The purpose of this study was to better understand the concept of mammography difficulty and how it affects radiology resident performance.
Materials and Methods
Seven radiology residents and three expert breast imagers reviewed 100 mammograms, consisting of bilateral medial lateral oblique and craniocaudal views, using a research workstation. The cases consisted of normal, benign, and malignant findings. Participants identified abnormalities and scored the difficulty and malignant potential for each case. Resident performance (sensitivity, specificity, and area under the receiver operating characteristic curve [AUC]) was calculated for self- and expert-assessed high and low difficulties.
Results
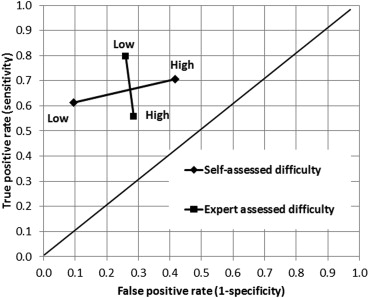
For cases classified by self-assessed difficulty, the resident AUCs were 0.667 for high difficulty and 0.771 for low difficulty cases ( P = .010). Resident sensitivities were 0.707 for high and 0.614 for low difficulty cases ( P = .113). Resident specificities were 0.583 for high and 0.905 for low difficulty cases ( P < .001). For cases classified by expert-assessed difficulty, the resident AUCs were 0.583 for high and 0.783 for low difficulty cases ( P = .001). Resident sensitivities were 0.558 for high and 0.796 for low difficulty cases ( P < .001). Resident specificities were 0.714 for high and 0.740 for low difficulty cases ( P = .807).
Conclusions
Increased self- and expert-assessed difficulty is associated with a decrease in resident performance in mammography. However, while this lower performance is due to a decrease in specificity for self-assessed difficulty, it is due to a decrease in sensitivity for expert-assessed difficulty. These trends suggest that educators should provide a mix of self- and expert-assessed difficult cases in educational materials to maximize the effect of training on resident performance and confidence.
The ability to accurately interpret mammograms is a critical skill to develop for radiology residents during training and one clearly emphasized by the American College of Radiology and the Society of Breast Imaging education guidelines . Despite these stated goals, survey data from the past 10 years demonstrate that although residents are spending more dedicated time on breast imaging rotations, they are not developing sufficient confidence in their abilities and feel that only radiologists with fellowship training should routinely interpret mammograms . Reinforcing the sense of inadequacy, performance data of new radiology residency graduates demonstrate that those without subspecialty training in breast imaging learn at a high rate during their first few years of practice . However, their learning rate quickly decreases and non–fellowship-trained radiologists take close to 20 years before their recall rates, false-positive rates, sensitivity targets, and the positive predictive value of their recall rates reach the approved levels. In contrast, fellowship-trained radiologists show minimal changes over time as they meet expectations for recall rates, false-positive rates, and the positive predictive value of their recall rates within the first year and sensitivity targets within 3 years . These data imply that performance is more than just years of practice and speak to the importance of concentrated education. Because residents are expected to be both confident and competent in the interpretation of mammograms on graduation from a general diagnostic residency program, there is a strong need for improved residency training in the interpretation of mammograms.
Radiology residents have reported that they find that interpreting mammograms is more stressful than interpreting other imaging studies because of fears of missing potentially important findings, misinterpreting the clinical significance of findings, and the risk of malpractice . This lack of comfort indicates that a more comprehensive understanding of the challenges facing radiology residents is needed. Prior work by multiple investigators has demonstrated several trends. Specifically, residents with less experience struggle to discriminate between benign and malignant abnormalities, resulting in a greater percentage of false-positive results . Residents are also less efficient in their visual search patterns as they cover more image area and struggle to differentiate true breast masses from artifacts and normal breast parenchyma . This results in a delay in detection time and an overall increase in the time spent per mammogram . Despite the longer interpretation time, residents quickly reach a time threshold beyond which they make few meaningful additional discoveries but instead make more errors .
Get Radiology Tree app to read full this article<
Get Radiology Tree app to read full this article<
Get Radiology Tree app to read full this article<
Materials and methods
Reader Study
Get Radiology Tree app to read full this article<
Get Radiology Tree app to read full this article<
Get Radiology Tree app to read full this article<
Data Analysis
Get Radiology Tree app to read full this article<
Get Radiology Tree app to read full this article<
Get Radiology Tree app to read full this article<
Get Radiology Tree app to read full this article<
Results
Get Radiology Tree app to read full this article<
Table 1
Distribution of Resident and Attending Interpretations
Resident interpretations Attending Interpretations Positive, N (%) Negative, N (%) Total, N (%) Positive 383 (54.7) 42 (6) 425 (60.7) Negative 163 (23.2) 112 (16) 275 (39.3) Total 546 (78) 154 (22) 700 (100)
Table 2
Distribution of Resident and Attending Difficulty Assessments
Resident difficulty Attending Difficulty Low, N (%) High, N (%) Total, N (%) Low 183 (26.1) 58 (8.3) 241 (34.4) High 272 (38.9) 187 (26.7) 459 (65.6) Total 455 (65) 245 (35) 700 (100)
Get Radiology Tree app to read full this article<
Get Radiology Tree app to read full this article<
Table 3
Resident Sensitivity, Specificity, and Area Under the Receiver Operating Characteristic Curve (AUC) Analysis by Self -assessed Difficulty
Analysis High Difficulty (95% CI) Low Difficulty (95% CI)P Value Sensitivity 0.707 (0.641–0.773) 0.614 (0.507–0.723) .113 Specificity 0.583 (0.456–0.709) 0.905 (0.850–0.960) <.001 ∗ AUC 0.667 (0.600–0.735) 0.771 (0.713–0.829) .010 ∗
CI, confidence interval.
Get Radiology Tree app to read full this article<
Table 4
Resident Sensitivity, Specificity, and Area Under the Receiver Operating Characteristic Curve (AUC) Analysis by Expert -assessed Difficulty
Analysis High Difficulty (95% CI) Low Difficulty (95% CI)P Value Sensitivity 0.558 (0.463–0.651) 0.796 (0.729–0.864) <.001 ∗ Specificity 0.714 (0.545–0.884) 0.740 (0.615–0.865) .807 AUC 0.583 (0.498–0.668) 0.783 (0.710–0.855) .001 ∗
CI, confidence interval.
Get Radiology Tree app to read full this article<
Get Radiology Tree app to read full this article<
Get Radiology Tree app to read full this article<
Discussion
Get Radiology Tree app to read full this article<
Get Radiology Tree app to read full this article<
Get Radiology Tree app to read full this article<
Get Radiology Tree app to read full this article<
Get Radiology Tree app to read full this article<
Get Radiology Tree app to read full this article<
Conclusions
Get Radiology Tree app to read full this article<
Acknowledgments
Get Radiology Tree app to read full this article<
References
1. Monticciolo D.L., Rebner M., Appleton C.M., et. al.: The ACR/Society of Breast Imaging Resident and Fellowship Training Curriculum for Breast Imaging, updated. J Am Coll Radiol 2013; 10: pp. 207-210 e4.
2. Bassett L.W., Bent C., Sayre J.W., et. al.: Breast imaging training and attitudes: update survey of senior radiology residents. AJR 2011; 197: pp. 263-269.
3. Bassett L.W., Monsees B.S., Smith R.A., et. al.: Survey of radiology residents: breast imaging training and attitudes. Radiology 2003; 227: pp. 862-869.
4. Miglioretti D.L., Gard C.C., Carney P.A., et. al.: When radiologists perform best: the learning curve in screening mammogram interpretation. Radiology 2009; 253: pp. 632-640.
5. Nodine C.F., Kundel H.L., Mello-Thoms C., et. al.: How experience and training influence mammography expertise. Acad Radiol 1999; 6: pp. 575-585.
6. Nodine C.F., Kundel H.L., Lauver S.C., et. al.: Nature of expertise in searching mammograms for breast masses. Acad Radiol 1996; 3: pp. 1000-1006.
7. Krupinski E.A.: Visual scanning patterns of radiologists searching mammograms. Acad Radiol 1996; 3: pp. 137-144.
8. Nodine C.F., Mello-Thoms C., Kundel H.L., et. al.: Time course of perception and decision making during mammographic interpretation. AJR 2002; 179: pp. 917-923.
9. Kundel H.L., Nodine C.F., Conant E.F., et. al.: Holistic component of image perception in mammogram interpretation: gaze-tracking study. Radiology 2007; 242: pp. 396-402.
10. Baxi S.S., Snow J.G., Liberman L., et. al.: The future of mammography: radiology residents’ experiences, attitudes, and opinions. AJR 2010; 194: pp. 1680-1686.
11. Azevedo R, Faremo S, Lajoie S. Expert-novice differences in mammogram interpretation. Proceedings of the 29th annual cognitive science society. 2007.
12. Mazurowski M.A., Baker J.A., Barnhart H.X., et. al.: Individualized computer-aided education in mammography based on user modeling: concept and preliminary experiments. Med Phys 2010; 37: pp. 1152-1160.
13. Mazurowski M.A., Barnhart H.X., Baker J.A., et. al.: Identifying error-making patterns in assessment of mammographic BI-RADS descriptors among radiology residents using statistical pattern recognition. Acad Radiol 2012; 19: pp. 865-871.
14. Tourassi G., Voisin S., Paquit V., et. al.: Investigating the link between radiologists’ gaze, diagnostic decision, and image content. J Am Med Inform Assoc 2013; [Epub ahead of print]
15. Sun S, Taylor P, Wilkinson L, et al. Individualised training to address variability of radiologists’ performance. Proc SPIE 6917, Medical Imaging 2008: Image Perception, Observer Performance, and Technology Assessment. 2008.
16. Robin X., Turck N., Hainard A., et. al.: pROC: an open-source package for R and S+ to analyze and compare ROC curves. BMC Bioinformatics 2011; 12: pp. 77.
17. Efron B., Tibshirani R.J.: An introduction to the bootstrap.1st ed.1994.Chapman and Hall/CRCBoca Raton, FL
18. Mazurowski MA. Difficulty of mammographic cases in the context of resident training: preliminary experimental data. Medical Imaging 2013: Image Perception, Observer Performance, and Technology Assessment. 2013.
19. Kundel H.L., Nodine C.F., Krupinski E.A., et. al.: Using gaze-tracking data and mixture distribution analysis to support a holistic model for the detection of cancers on mammograms. Acad Radiol 2008; 15: pp. 881-886.
20. Mazurowski MA. Difficulty of mammographic cases in the context of resident training: preliminary experimental data Proc SPIE 8673, Medical Imaging 2013: Image Perception, Observer Performance, and Technology Assessment. 2013.