
Rationale and Objectives
Contrast-enhanced angiographic evaluation by magnetic resonance imaging (MRI) and computed tomography (CT) is the reference standard for assessing peripheral artery disease (PAD). However, because PAD and diabetes often coexist, the prevalence of renal insufficiency is a major challenge to contrast-based angiography. The objective of this work is to describe and demonstrate a new application of three-dimensional double-echo steady-state (3D DESS) as a noncontrast vascular MRI method for evaluating peripheral atherosclerosis at 3 Tesla (3T).
Materials and Methods
A water-selective 3D DESS pulse sequence was designed to simultaneously collect two steady-state free-precession signals (free induction decay and Echo) yielding “black blood” (BB) and “gray blood” (GB) images. For completeness Bloch equation, simulations were performed to characterize DESS signals of various tissues including blood at different velocities and to assess two healthy subjects for the purpose of pulse sequence optimization. Exploratory studies were performed as an add-on protocol to an existing study involving patients with PAD. To evaluate the method’s specificity for detecting calcification, images from select patients were compared against CT angiography.
Results
Simulations agreed qualitatively with in vivo images supporting DESS’ potential for generating distinct lumen contrast (GB vs BB). Lesions representing calcium were easily identifiable on the basis of signal void occurring on both image types and were confirmed by CT angiography. Further, BB allowed visualization of stent restenosis, and data suggest its ability to visualize acute thrombus by virtue of T2 weighting.
Conclusion
Preliminary investigation and results suggest noncontrast 3D DESS to have the potential to improve diagnosis of PAD patients by providing detailed structural assessment of vessel-wall architecture.
Introduction
Peripheral artery disease (PAD) is a common manifestation of systemic atherosclerosis affecting 8–12 million individuals in the United States. Patients with PAD have a fivefold and a two- to threefold greater risk of heart attack and stroke, respectively, and higher mortality rate relative to those without PAD . Among subjects aged 50 years and older with diabetes mellitus and a history of smoking, the prevalence of PAD can be as high as 30% . The most common clinical symptom is intermittent claudication or cramp-like pain in the legs and buttocks induced by exercise, which contributes to a poor quality of life and a high rate of depression . The progression of the disease can lead to critical limb ischemia where blood flow is severely impaired to the lower limbs due to stenosis.
Maximum intensity projections of contrast-based angiography can rapidly provide a “roadmap” of large vascular segments for the assessment of severity and extent of PAD. Typical spatial resolution of contrast-enhanced magnetic resonance angiography (CE-MRA) is limited to 1 mm, and the luminal images cannot provide tissue information such as vessel-wall thickening and calcification. Computed tomographic angiography (CTA) is often preferred for speed and high-isotropic resolution, allowing reformation in any direction. However, diffuse calcification can confound diagnosis, particularly in smaller infrapopliteal arteries, which are common sites of PAD in diabetics . The gold standard for evaluating vascular diseases is catheter-based digital subtraction angiography (DSA), often utilized for planning surgical revascularization and angioplasty. Both CTA and DSA expose patients to ionization radiation. The greatest challenge of contrast-based angiography occurs in patients with compromised renal function, where prevalence is estimated at 27–36% because PAD and diabetes often coexist . Paradoxically, this is the patient population most indicated for angiographic examination, but these patients have a greater risk of contrast-induced acute renal failure, a source of significant morbidity and mortality.
Get Radiology Tree app to read full this article<
Get Radiology Tree app to read full this article<
Get Radiology Tree app to read full this article<
Methods
Blood Signal Attenuation in 3D DESS
Get Radiology Tree app to read full this article<
Get Radiology Tree app to read full this article<
Get Radiology Tree app to read full this article<
Numerical Simulation
Get Radiology Tree app to read full this article<
In Vivo Study
Get Radiology Tree app to read full this article<
SNR, CNR, and Fat Attenuation Level
Get Radiology Tree app to read full this article<
Results
Numerical Simulations
Get Radiology Tree app to read full this article<
Get Radiology Tree app to read full this article<
In Vivo Study
Get Radiology Tree app to read full this article<
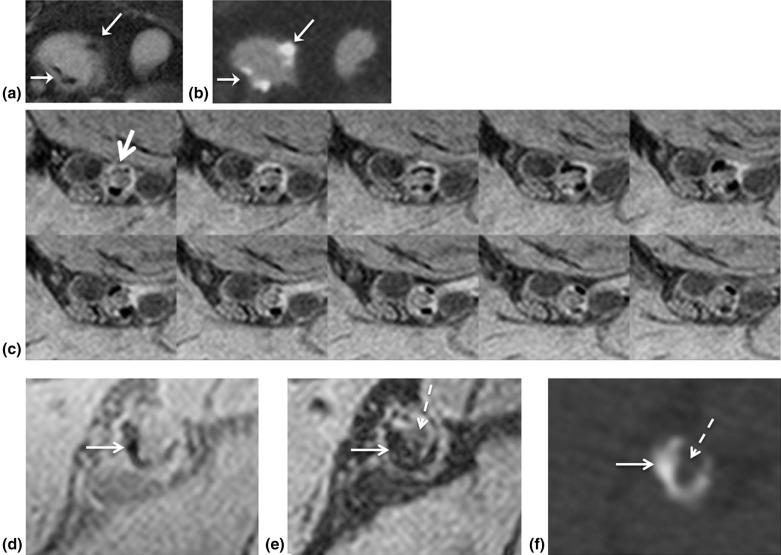
![Figure 3, Dual lumen contrast of DESS images. The images of ( a ) SSFP-free induction decay (FID), and ( b ) SSFP-Echo, clearly demonstrate distinct lumen contrast in the superficial femoral artery, i.e. moderate (gray blood [GB], black arrow ) signal in the lumen ( a ) versus full suppression (black blood [BB], white arrow ) of the blood signal ( b ). White circles highlight variation of fat attenuation due to spatially dependent static field inhomogeneity. From left to right, the fat signal reduction is 54%, 67%, and 75%, respectively, compared to the ( c ) GB image acquired without fat attenuation. At the same ROIs in ( b ) the fat signal reduction is 70%, 88%, and 92% compared to ( d ), collected simultaneously with ( c ). Magnified view of femoral and popliteal arteries ( dashed box ) of ( e ) SSFP-FID and ( f ) SSFP-Echo from proximal to the distal edge of the slab (seven slices out of 240, each separated by 45 mm). The signal in ( e ) is strongly location dependent, being highest in the most proximal location due to inflow enhancement, getting gradually lower in the more distal slices.](https://storage.googleapis.com/dl.dentistrykey.com/clinical/RapidHighresolutionSelfregisteredDualLumencontrastMRIMethodforVesselwallAssessmentinPeripheralArteryDisease/2_1s20S1076633216000192.jpg)
Table 1
SNR and CNR Measured from Black-blood Images
Lumen and Vessel-wall SNR and CNR \*
(SNR l /SNR w ) Subject Common Fem. Superficial Fem. Popliteal 1 4.7/15.4 5.0/23.7 7.3/27.3 2 8.5/15.4 9.5/30.8 6.0/20.1 3 10.9/19 11.7/36.7 8.6/31.8 4 8.5/20.1 10.1/27.3 8.8/29.6 5 5.7/13.0 6.9/17.8 5.6/21.3 6 10.7/34.4 15.4/39.1 13.0/55.7 7 5.8/16.6 6.3/23.7 8.1/17.8 8 5.5/17.8 7.3/28.4 6.8/19.0 9 7.9/15.4 7.1/35.5 6.6/24.9 10 6.6/17.8 6.3/21.3 5.1/13.0 11 7.7/28.4 7.9/37.9 7.2/27.3 12 6.4/19.0 6.9/22.5 6.9/27.3 13 8.9/17.8 7.5/23.7 8.5/37.9 14 8.6/21.3 8.3/28.4 8.2/23.7 15 10.5/29.6 8.6/23.7 9.5/33.2 16 9.1/23.7 9.4/30.8 9.5/36.7 17 6.6/14.2 7.1/21.3 6.3/36.7 18 11.3/34.4 8.5/16.6 9.5/32.0 19 11.8/32.0 13.0/35.5 9.7/32.0 20 10.4/26.1 9.5/29.6 8.9/29.6 Average
SNR w (SD)/
SNR l (SD)
8.3 (2.2)/
21.6 (6.9)
8.6 (2.5)/
27.7 (6.7)
8.0 (1.8)/
28.8 (9.3) Average:
CNR (SD)
13.2 (5.4)
19.1 (5.4)
20.8 (7.9)
SNR w , SNR of vessel-wall; SNR l , SNR of vessel lumen; SD, standard deviation; Fem., femoral.
Get Radiology Tree app to read full this article<
Table 2
SNR and CNR Measured from Gray-blood Images
Lumen and Vessel-wall SNR and CNR \*
(SNR l /SNR w ) Subject Common Fem. Superficial Fem. Popliteal 1 51.3/38.0 50.7/39.3 22.0/32.0 2 16.7/19.3 20.0/28.7 15.3/24.0 3 38.0/26.7 34.0/55.3 32.0/44.7 4 50.0/32.7 28.0/34.7 30.0/44.0 5 24.7/27.3 25.3/29.3 20.0/28.0 6 57.9/46.7 59.6/45.8 24.2/33.3 7 29.3/21.3 33.3/38.0 16.0/22.0 8 21.3/22.0 53.3/42.7 26.0/29.3 9 37.3/33.3 44.0/44.0 26.7/34.0 10 30.7/20.0 19.3/32.0 21.3/29.3 11 32.7/41.3 35.3/41.3 33.3/44.0 12 54.0/28.7 51.3/40.0 26.7/36.0 13 68.0/46.0 37.3/32.0 35.3/50.5 14 48.0/45.3 18.7/28.7 16.0/26.7 15 36.0/32.7 15.3/28.0 20.0/34.7 16 47.3/45.3 42.7/42.7 28.7/40.7 17 16.7/21.3 15.3/26.7 21.3/38.0 18 30.7/45.3 53.3/52.7 34.7/38.0 19 21.3/30.0 35.3/38.7 50.0/45.3 20 22.0/28.0 16.7/28.0 36.7/42.7 Average
SNR w (SD)/
SNR l (SD)
32.6 (9.7)/
36.7 (14.8)
37.4 (8.4)/
34.4 (14.4)
35.8 (7.8)/
26.8 (8.6) Average:
CNR (SD)
−4.1 (10.7)
3.0 (9.6)
9.0 (4.9)
SNR w , SNR of vessel-wall; SNR l , SNR of vessel lumen; SD, standard deviation; Fem., femoral.
Get Radiology Tree app to read full this article<
Get Radiology Tree app to read full this article<
Get Radiology Tree app to read full this article<
Get Radiology Tree app to read full this article<
Get Radiology Tree app to read full this article<
Get Radiology Tree app to read full this article<
Get Radiology Tree app to read full this article<
Get Radiology Tree app to read full this article<
Get Radiology Tree app to read full this article<
Discussion
Get Radiology Tree app to read full this article<
Get Radiology Tree app to read full this article<
Get Radiology Tree app to read full this article<
Get Radiology Tree app to read full this article<
Get Radiology Tree app to read full this article<
Get Radiology Tree app to read full this article<
Get Radiology Tree app to read full this article<
Conclusion
Get Radiology Tree app to read full this article<
Acknowledgment
Get Radiology Tree app to read full this article<
References
1. Criqui M.H., Langer R.D., Fronek A., et. al.: Mortality over a period of 10 years in patients with peripheral arterial disease. N Engl J Med 1992; 326: pp. 381-386.
2. Hirsch A.T., Haskal Z.J., Hertzer N.R., et. al.: ACC/AHA 2005 Practice Guidelines for the management of patients with peripheral arterial disease (lower extremity, renal, mesenteric, and abdominal aortic): a collaborative report from the American Association for Vascular Surgery/Society for Vascular Surgery, Society for Cardiovascular Angiography and Interventions, Society for Vascular Medicine and Biology, Society of Interventional Radiology, and the ACC/AHA Task Force on Practice Guidelines (Writing Committee to Develop Guidelines for the Management of Patients with Peripheral Arterial Disease): endorsed by the American Association of Cardiovascular and Pulmonary Rehabilitation; National Heart, Lung, and Blood Institute; Society for Vascular Nursing; TransAtlantic Inter-society Consensus; and Vascular Disease Foundation. Circulation 2006; 113: pp. e463-e654.
3. McDermott M.M., Greenland P., Guralnik J.M., et. al.: Depressive symptoms and lower extremity functioning in men and women with peripheral arterial disease. J Gen Intern Med 2003; 18: pp. 461-467.
4. Regensteiner J.G., Hiatt W.R., Coll J.R., et. al.: The impact of peripheral arterial disease on health-related quality of life in the peripheral arterial disease awareness, risk, and treatment: new resources for survival (PARTNERS) Program. Vasc Med 2008; 13: pp. 15-24.
5. American Diabetes A : Peripheral arterial disease in people with diabetes. Diabetes Care 2003; 26: pp. 3333-3341.
6. Strandness D.E., Priest R.E., Gibbons G.E.: Combined clinical and pathologic study of diabetic and nondiabetic peripheral arterial disease. Diabetes 1964; 13: pp. 366-372.
7. Paraskevas K.I., Giannoukas A.D., Mikhailidis D.P.: Renal function impairment in peripheral arterial disease: an important parameter that should not be neglected. Ann Vasc Surg 2009; 23: pp. 690-699.
8. Murabito J.M., D’Agostino R.B., Silbershatz H., et. al.: Intermittent claudication. a risk profile from the framingham heart study. Circulation 1997; 96: pp. 44-49.
9. Edelman R.R., Sheehan J.J., Dunkle E., et. al.: Quiescent-interval single-shot unenhanced magnetic resonance angiography of peripheral vascular disease: technical considerations and clinical feasibility. Magn Reson Med 2010; 63: pp. 951-958.
10. Meaney J.F.: Magnetic resonance angiography of the peripheral arteries: current status. Eur Radiol 2003; 13: pp. 836-852.
11. Hodnett P.A., Ward E.V., Davarpanah A.H., et. al.: Peripheral arterial disease in a symptomatic diabetic population: prospective comparison of rapid unenhanced MR angiography (MRA) with contrast-enhanced MRA. AJR Am J Roentgenol 2011; 197: pp. 1466-1473.
12. Storey P., Lee V.S., Sodickson D.K., et. al.: B1 inhomogeneity in the thigh at 3T and implications for peripheral vascular imaging. Hawaii2009.
13. Rocha-Singh K.J., Zeller T., Jaff M.R.: Peripheral arterial calcification: prevalence, mechanism, detection, and clinical implications. Catheter Cardiovasc Interv 2014; 83: pp. E212-E220.
14. Schillinger M., Sabeti S., Loewe C., et. al.: Balloon angioplasty versus implantation of nitinol stents in the superficial femoral artery. N Engl J Med 2006; 354: pp. 1879-1888.
15. Koktzoglou I.: Gray blood magnetic resonance for carotid wall imaging and visualization of deep-seated and superficial vascular calcifications. Magn Reson Med 2013; 70: pp. 75-85.
16. Du J., Corbeil J., Znamirowski R., et. al.: Direct imaging and quantification of carotid plaque calcification. Magn Reson Med 2011; 65: pp. 1013-1020.
17. Hardy P.A., Recht M.P., Piraino D., et. al.: Optimization of a dual echo in the steady state (DESS) free-precession sequence for imaging cartilage. J Magn Reson Imaging 1996; 6: pp. 329-335.
18. Bieri O., Ganter C., Scheffler K.: Quantitative in vivo diffusion imaging of cartilage using double echo steady-state free precession. Magn Reson Med 2012; 68: pp. 720-729.
19. Bernstein M.A., King K.F., Zhou J.X.: Handbook of MRI pulse sequences.2004.Elsevier Academic PressBurlington, MApp. 589-592.
20. Hennig J.: Multiecho imaging sequences with low refocusing flip angles. J Magn Reson 1988; 78: pp. 397-407.
21. Zur Y., Wood M.L., Neuringer L.J.: Motion-insensitive, steady-state free precession imaging. Magn Reson Med 1990; 16: pp. 444-459.
22. Englund E.K., Langham M.C., Ratcliffe S.J., et. al.: Multiparametric assessment of vascular function in peripheral artery disease: dynamic measurement of skeletal muscle perfusion, blood-oxygen-level dependent signal, and venous oxygen saturation. Circ Cardiovasc Imaging 2015; 8:
23. Magland J.F., Li C., Langham M.C., et. al.: Pulse sequence programming in a dynamic visual environment: sequencetree. Magn Reson Med 2015;
24. Balu N., Yarnykh V.L., Chu B., et. al.: Carotid plaque assessment using fast 3D isotropic resolution black-blood MRI. Magn Reson Med 2011; 65: pp. 627-637.
25. Lindley M.D., Kim D., Morrell G., et. al.: High-permittivity thin dielectric pad improves peripheral non-contrast MRA at 3T.2014.ISMRM 2014Milan
26. Webb A.G.: Dielectric materials in magnetic resonance. Concepts Magn Reson Part A 2011; 38: pp. 148-184.
27. Corti R., Osende J.I., Fayad Z.A., et. al.: In vivo noninvasive detection and age definition of arterial thrombus by MRI. J Am Coll Cardiol 2002; 39: pp. 1366-1373.
28. Pomposelli F.: Arterial imaging in patients with lower extremity ischemia and diabetes mellitus. J Vasc Surg 2010; 52: pp. 81S-91S.
29. Ohtake T., Oka M., Ikee R., et. al.: Impact of lower limbs’ arterial calcification on the prevalence and severity of PAD in patients on hemodialysis. J Vasc Surg 2011; 53: pp. 676-683.
30. Liabeuf S., Olivier B., Vemeer C., et. al.: Vascular calcification in patients with type 2 diabetes: the involvement of matrix Gla protein. Cardiovasc Diabetol 2014; 13: pp. 85.
31. Balu N., Wang J., Zhao X., et. al.: Targeted multi-contrast vessel-wall imaging of bilateral peripheral artery disease. Proceedings of the 18th Annual Meeting of ISMRM Stockholm, Sweden2010.pp. 3685.
32. Edelman R.R., Flanagan O., Grodzki D., et. al.: Projection MR imaging of peripheral arterial calcifications. Magn Reson Med 2015; 73: pp. 1939-1945.
33. Grodzki D.M., Jakob P.M., Heismann B.: Ultrashort echo time imaging using pointwise encoding time reduction with radial acquisition (PETRA). Magn Reson Med 2012; 67: pp. 510-518.
34. Fayad Z.A.: MR imaging for the noninvasive assessment of atherothrombotic plaques. Magn Reson Imaging Clin N Am 2003; 11: pp. 101-113.
35. Underhill H.R., Hatsukami T.S., Fayad Z.A., et. al.: MRI of carotid atherosclerosis: clinical implications and future directions. Nat Rev Cardiol 2010; 7: pp. 165-173.
36. Chi J., Chiu B., Cao Y., et. al.: Assessment of femoral artery atherosclerosis at the adductor canal using 3D black-blood MRI. Clin Radiol 2013; 68: pp. e213-e221.
37. Isbell D.C., Meyer C.H., Rogers W.J., et. al.: Reproducibility and reliability of atherosclerotic plaque volume measurements in peripheral arterial disease with cardiovascular magnetic resonance. J Cardiovasc Magn Reson 2007; 9: pp. 71-76.
38. Naghavi M., Libby P., Falk E., et. al.: From vulnerable plaque to vulnerable patient: a call for new definitions and risk assessment strategies: part II. Circulation 2003; 108: pp. 1772-1778.
39. Saam T., Hatsukami T.S., Takaya N., et. al.: The vulnerable, or high-risk, atherosclerotic plaque: noninvasive MR imaging for characterization and assessment. Radiology 2007; 244: pp. 64-77.
40. Polonsky T.S., Liu K., Tian L., et. al.: High-risk plaque in the superficial femoral artery of people with peripheral artery disease: prevalence and associated clinical characteristics. Atherosclerosis 2014; 237: pp. 169-176.
41. Okura H., Asawa K., Kubo T., et. al.: Incidence and predictors of plaque rupture in the peripheral arteries. Circ Cardiovasc Interv 2010; 3: pp. 63-70.