
Rationale and Objectives
Mammographic breast density, a strong risk factor for breast cancer, may be measured as either a relative percentage of dense (ie, radiopaque) breast tissue or as an absolute area from either raw (ie, “for processing”) or vendor postprocessed (ie, “for presentation”) digital mammograms. Given the increasing interest in the incorporation of mammographic density in breast cancer risk assessment, the purpose of this study is to determine the inherent reader variability in breast density assessment from raw and vendor-processed digital mammograms, because inconsistent estimates could to lead to misclassification of an individual woman’s risk for breast cancer.
Materials and Methods
Bilateral, mediolateral-oblique view, raw, and processed digital mammograms of 81 women were retrospectively collected for this study (N = 324 images). Mammographic percent density and absolute dense tissue area estimates for each image were obtained from two radiologists using a validated, interactive software tool.
Results
The variability of interreader agreement was not found to be affected by the image presentation style (ie, raw or processed, F-test: P > .5). Interreader estimates of relative and absolute breast density are strongly correlated (Pearson r > 0.84, P < .001) but systematically different ( t -test, P < .001) between the two readers.
Conclusion
Our results show that mammographic density may be assessed with equal reliability from either raw or vendor postprocessed images. Furthermore, our results suggest that the primary source of density variability comes from the subjectivity of the individual reader in assessing the absolute amount of dense tissue present in the breast, indicating the need to use standardized tools to mitigate this effect.
Breast cancer is currently the most commonly diagnosed cancer in women and is projected to account for 29% of all new cancer cases in women in the United States this year . Although it is expected that one in eight women will develop breast cancer over the course of their life , previous studies have identified multiple demographic and lifestyle risk factors that are associated with an increased risk for developing breast cancer, such as age, weight, ethnicity, parity, and family history . Comprehensive assessment of an individual woman’s risk for breast cancer could lead to personalized screening regimens using complementary or alternative imaging modalities to mammography such as ultrasound or magnetic resonance imaging .
In addition to demographic risk factors, several studies have also identified that mammographic breast density, commonly measured as the relative amount of radiopaque fibroglandular breast tissue, is a strong, independent risk factor for breast cancer . Clinically, breast density is most commonly estimated by radiologists via visual assessment as the amount of mammographically dense tissue, or “white areas,” and then categorized using the American College of Radiology four-class breast-imaging reporting and data system (BIRADS) or the Boyd six-category scale . In addition, continuous measures of breast percent density (PD%), acquired using interactive image thresholding software , have also been widely used, primarily in the research setting, as a more precise, quantitative measures in the effort to better estimate the risk for breast cancer associated with increasing amounts of fibroglandular tissue.
Get Radiology Tree app to read full this article<
 Open full size image
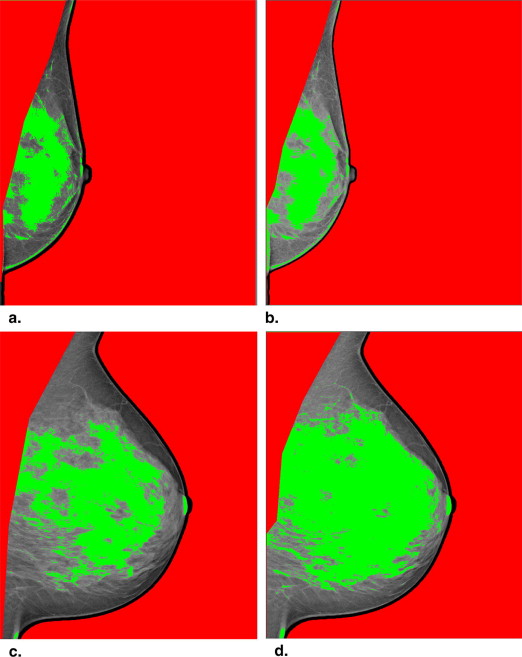
Figure 1
Examples of raw (a) and processed (b) mediolateral-oblique view mammograms of a breast-imaging reporting and data system category II breast with scattered densities from a 53-year-old woman. In general, improved tissue contrast and a more pronounced skin line can be seen in the processed image when compared to the raw digital mammogram.
Get Radiology Tree app to read full this article<
Get Radiology Tree app to read full this article<
Materials and methods
Study Population and DM Image Acquisition
Get Radiology Tree app to read full this article<
Radiologist Estimation of PD%
Get Radiology Tree app to read full this article<
PD%=DABA PD%
=
D
A
B
A
Get Radiology Tree app to read full this article<
Get Radiology Tree app to read full this article<
Statistical Analysis
Get Radiology Tree app to read full this article<
Per-woman, Inter-breast Repeatability of Density Estimates
Get Radiology Tree app to read full this article<
Reader Agreement in Density Estimates from Raw and Processed DM Images
Get Radiology Tree app to read full this article<
Interreader Agreement of Continuous Breast Density Estimates
Get Radiology Tree app to read full this article<
Intra- and interreader Agreement of Categorical BIRADS Density Estimates
Get Radiology Tree app to read full this article<
Results
Per-woman, Inter-breast Repeatability of Density Estimates
Get Radiology Tree app to read full this article<
Table 1
Intrareader Agreement between Individual Women’s Left and Right Breast Density Estimates as Measured by Pearson Correlation and Bland-Altman Statistics
Breast Percent Density (%) Reader 1 Reader 2 Raw Processed Raw Processed Pearson r 0.99 0.99 0.99 0.99 Mean difference 0.03 −0.22 0.02 −0.13 95% limits of agreement (−4.6, +4.7) (−5.6, +5.1) (−1.0, +1.0) (−3.7, +3.4)
Dense Tissue Area (cm 2 ) Reader 1 Reader 2 Raw Processed Raw Processed Pearson r 0.98 0.97 0.99 0.98 Mean difference 0.61 0.25 0.54 0.50 95% limits of agreement (−8.7, +9.9) (−10.1, +10.6) (−5.1, +6.1) (−6.2, +7.2)
Top, breast percent density; bottom, dense tissue area. All correlations are statistically significant ( P < .001).
Get Radiology Tree app to read full this article<
Reader Agreement in Density Estimates from Raw and Processed DM Images
Get Radiology Tree app to read full this article<
Table 2
Intrareader Agreement between Individual Readers’ Raw and Processed Breast Percent Density and Absolute Dense Tissue Area Estimates as Measured by Pearson Correlation and Bland-Altman Statistics
Reader 1 Reader 2 Breast Percent Density (%) Dense Tissue Area (cm 2 ) Breast Percent Density (%) Dense Tissue Area (cm 2 ) Pearson r 0.97 0.97 0.99 0.99 Mean difference −1.24 −0.81 −0.05 0.96 95% limits of agreement (−9.5, +7.0) (−12.2, +10.6) (−1.8, +1.7) (−2.5, +4.4)
All correlations are statistically significant ( P < .001).
Get Radiology Tree app to read full this article<
Interreader Agreement of Continuous Breast Density Estimates
Get Radiology Tree app to read full this article<
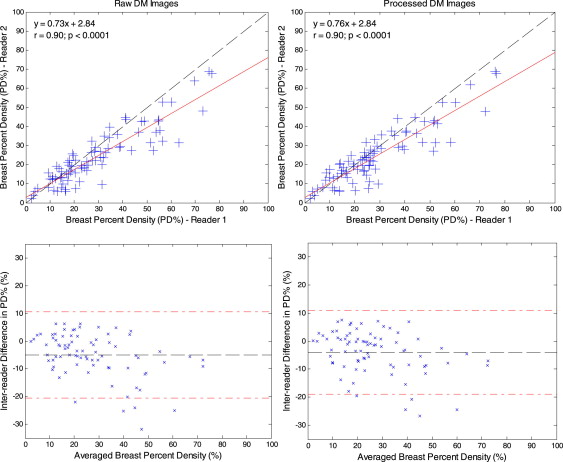
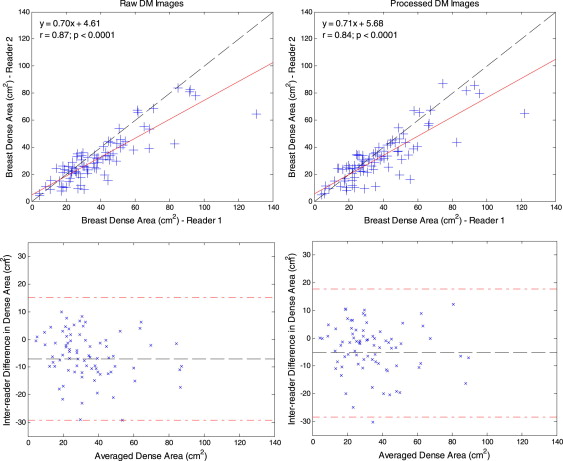
Table 3
Interreader Agreement between Readers’ Per-woman Density Estimates as Measured by Pearson Correlation and Bland-Altman Statistics
Breast Percent Density (%) Dense Tissue Area (cm 2 ) Raw Processed Raw Processed Pearson r 0.90 0.89 0.87 0.85 Mean difference −5.05 −3.94 −7.05 −5.28 95% limits of agreement (−20.6, +10.5) (−18.8, +11.0) (−29.2, +15.1) (−28.3, +17.7)
All correlations are statistically significant ( P < .001).
Get Radiology Tree app to read full this article<
Interreader Agreement of Categorical BIRADS Density Estimates
Get Radiology Tree app to read full this article<
Table 4
Categorical BIRADS Density Assignment by Reader Made on Raw (Left) and Processed (Right) DM Images
Reader 1 (D.N.) Reader 1 (D.N.) I II III IV I II III IV Reader 2 (S.G.) I 38 9 0 0 Reader 2 (S.G.) I 39 9 0 0 II 1 19 9 0 II 2 19 7 0 III 0 0 3 2 III 0 0 3 2 IV 0 0 0 0 IV 0 0 0 0
Get Radiology Tree app to read full this article<
Discussion
Get Radiology Tree app to read full this article<
Get Radiology Tree app to read full this article<
Get Radiology Tree app to read full this article<
Get Radiology Tree app to read full this article<
Get Radiology Tree app to read full this article<
Get Radiology Tree app to read full this article<
Get Radiology Tree app to read full this article<
Get Radiology Tree app to read full this article<
Acknowledgments
Get Radiology Tree app to read full this article<
References
1. Siegel R., Naishadham D., Jemal A.: Cancer statistics, 2012. CA Cancer J Clin 2012; 62: pp. 10-29.
2. Hayat M.J., Howlader N., Reichman M.E., et. al.: Cancer statistics, trends, and multiple primary cancer analyses from the Surveillance, Epidemiology, and End Results (SEER) Program. Oncologist 2007; 12: pp. 20-37.
3. Gail M.H., Brinton L.A., Byar D.P., et. al.: Projecting individualized probabilities of developing breast cancer for white females who are being examined annually. J Natl Cancer Inst 1989; 81: pp. 1879-1886.
4. McPherson K., Steel C.M., Dixon J.M.: ABC of breast diseases. Breast cancer-epidemiology, risk factors, and genetics. BMJ 2000; 321: pp. 624-628.
5. Lee C.H., Dershaw D.D., Kopans D., et. al.: Breast cancer screening with imaging: recommendations from the Society of Breast Imaging and the ACR on the use of mammography, breast MRI, breast ultrasound, and other technologies for the detection of clinically occult breast cancer. J Am Coll Radiol 2010; 7: pp. 18-27.
6. Tice J.A., Cummings S.R., Ziv E., et. al.: Mammographic breast density and the Gail model for breast cancer risk prediction in a screening population. Breast Cancer Res Treat 2005; 94: pp. 115-122.
7. McCormack V.A., dos Santos Silva I.: Breast density and parenchymal patterns as markers of breast cancer risk: a meta-analysis. Cancer Epidemiol Biomarkers Prev 2006; 15: pp. 1159-1169.
8. Boyd N.F., Guo H., Martin L.J., et. al.: Mammographic density and the risk and detection of breast cancer. N Engl J Med 2007; 356: pp. 227-236.
9. D’Orsi C.J., Bassett L.W., Berg W.A., et. al.: Breast imaging reporting and data system: ACR BI-RADS, Mammography.4th ed.2003.American College of RadiologyReston, VA
10. Byng J.W., Boyd N.F., Fishell E., et. al.: The quantitative analysis of mammographic densities. Phys Med Biol 1994; 39: pp. 1629-1638.
11. Mandelblatt J.S., Stout N., Trentham-Dietz A.: To screen or not to screen women in their 40s for breast cancer: is personalized risk-based screening the answer?. Ann Intern Med 2011; 155: pp. 58-60.
12. Spayne M.C., Gard C.C., Skelly J., et. al.: Reproducibility of BI-RADS Breast Density Measures Among Community Radiologists: a prospective cohort study. Breast J 2012; 18: pp. 326-333.
13. Harvey J.A.: Quantitative assessment of percent breast density: analog versus digital acquisition. Technol Cancer Res Treat 2004; 3: pp. 611-616.
14. Yaffe M.J.: Mammographic density. Measurement of mammographic density. Breast Cancer Res 2008; 10: pp. 209-218.
15. Conant E., Li D., Gavenonis S., et. al.: A comparative study of the inter-reader variability of breast percent density estimation in digital mammography: potential effect of reader’s training and clinical experience. Dig Mammogr 2010; pp. 114-120.
16. Chen J., Pee D., Ayyagari R., et. al.: Projecting absolute invasive breast cancer risk in white women with a model that includes mammographic density. J Natl Cancer Inst 2006; 98: pp. 1215-1226.
17. Stone J., Ding J., Warren R.M., et. al.: Predicting breast cancer risk using mammographic density measurements from both mammogram sides and views. Breast Cancer Res Treat 2010; 124: pp. 551-554.
18. Perez-Gomez B., Ruiz F., Martinez I., et. al.: Women’s features and inter-/intra-rater agreement on mammographic density assessment in full-field digital mammograms (DDM-SPAIN). Breast Cancer Res Treat 2012; 132: pp. 287-295.
19. Ooms E.A., Zonderland H.M., Eijkemans M.J., et. al.: Mammography: interobserver variability in breast density assessment. Breast 2007; 16: pp. 568-576.
20. Gao J., Warren R., Warren-Forward H., et. al.: Reproducibility of visual assessment on mammographic density. Breast Cancer Res Treat 2008; 108: pp. 121-127.
21. Ciatto S., Houssami N., Apruzzese A., et. al.: Categorizing breast mammographic density: intra- and interobserver reproducibility of BI-RADS density categories. Breast 2005; 14: pp. 269-275.
22. Li D., Gavenonis S., Conant E., Kontos D.: Comparison of breast percent density estimation from raw versus processed digital mammograms. Proc SPIE 2011; 7963: pp. 79631X.
23. Stone J., Warren R.M., Pinney E., et. al.: Determinants of percentage and area measures of mammographic density. Am J Epidemiol 2009; 170: pp. 1571-1578.
24. Kontos D., Ikejimba L.C., Bakic P.R., Troxel A.B., Conant E.F., Maidment A.D.: Analysis of parenchymal texture with digital breast tomosynthesis: comparison with digital mammography and implications for cancer risk assessment. Radiology 2011; 261: pp. 80-91.
25. Bakic P.R., Carton A.K., Kontos D., et. al.: Breast percent density: estimation on digital mammograms and central tomosynthesis projections. Radiology 2009; 252: pp. 40-49.
26. Pearson K. Mathematical contributions to the theory of evolution. III. Regression, heredity, and panmixia. Philosophical Transactions of the Royal Society of London Series A, Containing Papers of a Mathematical or Physical Character 1896; 187:253–318.
27. Bland J.M., Altman D.G.: Statistical methods for assessing agreement between two methods of clinical measurement. Lancet 1986; 1: pp. 307-310.
28. Cohen J.: Weighted kappa: nominal scale agreement provision for scaled disagreement or partial credit. Psychol Bull 1968; 70: pp. 213.
29. Martin K.E., Helvie M.A., Zhou C., et. al.: Mammographic density measured with quantitative computer-aided method: comparison with radiologists’ estimates and BI-RADS categories. Radiology 2006; 240: pp. 656-665.
30. Heine J.J., Cao K., Rollison D.E., et. al.: A quantitative description of the percentage of breast density measurement using full-field digital mammography. Acad Radiol 2011; 18: pp. 556-564.
31. Shepherd J.A., Kerlikowske K., Ma L., et. al.: Volume of mammographic density and risk of breast cancer. Cancer Epidemiol Biomarkers Prev 2011; 20: pp. 1473-1482.
32. Keller B.M., Nathan D.L., Wang Y., et. al.: Estimation of breast percent density in raw and processed full field digital mammography images via adaptive fuzzy c-means clustering and support vector machine segmentation. Med Phys 2012; 39: pp. 4903-4917.
33. Keller B.M., Nathan D.L., Conant E.F., et. al.: Model-based estimation of breast percent density in raw and processed full-field digital mammography images from image-acquisition physics and patient-image characteristics. SPIE Proc 2012; pp. 8313.
34. Byng J.W., Yaffe M.J., Jong R.A., et. al.: Analysis of mammographic density and breast cancer risk from digitized mammograms. Radiographics 1998; 18: pp. 1587-1598.
35. Lobbes M.B., Cleutjens J.P., Lima Passos V., et. al.: Density is in the eye of the beholder: visual versus semi-automated assessment of breast density on standard mammograms. Insights Imaging 2012; 3: pp. 91-99.