
Rationale and Objectives
Search patterns are important for radiologists because they enable systematic case review. Because radiology residents are exposed to so many imaging modalities and anatomic regions, and they rotate on-and-off service so frequently, they may have difficulty establishing effective search patterns. We developed Real View Radiology (RVR), an educational system founded on guided magnetic resonance imaging (MRI) case review and evaluated its impact on search patterns and interpretative confidence of junior radiology residents.
Materials and Methods
RVR guides learners through unknown examinations by sequentially prompting learners to certain aspects of a case via a comprehensive question set and then providing immediate feedback. Junior residents first completed a brief evaluation regarding their level of confidence when interpreting certain joint MRI cases and frequency of search pattern use. They spent four half-days interpreting cases using RVR. Once finished, they repeated the evaluations. The junior resident results were compared to third-year residents who had not used RVR. The data were analyzed for change in confidence, use of search patterns, and number of cases completed.
Results
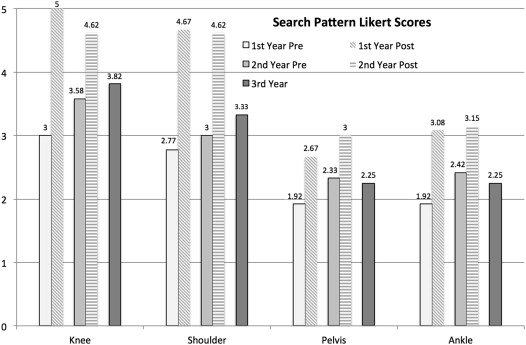
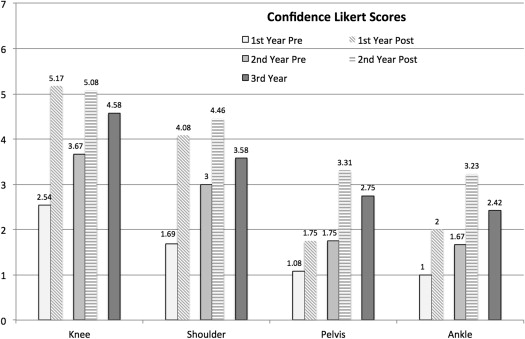
Twelve first-year and thirteen second-year residents (trained cohort) were enrolled in the study. During their 4-week musculoskeletal rotations, they completed on average 29.3 MRI knee (standard deviation [SD], 1.6) and 17.4 shoulder (SD, 1.2) cases using RVR. Overall search pattern scores of the trained cohort increased significantly both from pretraining to posttraining (knee P < .01, shoulder P < .01) and compared to the untrained third-year residents (knee ( P < .01, and shoulder P < .01). The trained cohort confidence scores also increased significantly from pre to post for all joints (knee P < .01, shoulder P < .01, pelvis P < .01, and ankle P < .01).
Conclusions
Radiology residents can increase their MRI case interpretation confidence and improve the consistency of search pattern use by training with a question-based sequential reveal educational program. RVR could be used to supplement training and assist with search pattern creation in areas in which residents often do not acquire adequate clinical exposure.
Historically, effective learning for diagnostic radiology residents has been achieved via traditional educational pathways, such as the interpretation of daily cases at the clinical workstation, the review of departmental or online radiology teaching files, attendance at departmental didactic lectures, and/or case conferences, and the completion of assigned readings in radiology textbooks. Although individual learners ultimately choose styles that are best suited to them, case-based format remains at the core of radiology education. The advantages of the case-based approach are that it efficiently allows learners to see images, formulate differential diagnoses, and assimilate digestible amounts of information related to the disease processes.
Case-based learning is based on repetition where a trainee interprets a given study, reviews the correct interpretation, and mentally notes the discrepancies between the two interpretations. It is thought that the accumulation of such experiences leads imagers to form their own search patterns. Search patterns are important to radiologists because they allow each case to be reviewed with a systematic approach, such that all pertinent findings, whether the absence of normal findings or the presence of abnormalities can be identified. It has been shown that search patterns are conducted in a two-step fashion using both nonselective and selective processing . Although oversimplified, radiologists often refer to nonselective search as the “gestalt” of an image. Selective search then follows the gestalt interpretation where trained radiologists use cues from their gestalt and review a study using a more formal search pattern, thereby increasing their interpretation accuracy . Many factors influencing search patterns have been studied including the ability to detect additional abnormalities after an initial discovery, a concept well known as “satisfaction of search” .
Get Radiology Tree app to read full this article<
Get Radiology Tree app to read full this article<
Materials and methods
Get Radiology Tree app to read full this article<
Creating the Content
Get Radiology Tree app to read full this article<
Trainee Using Real View Radiology
Get Radiology Tree app to read full this article<
Get Radiology Tree app to read full this article<
Evaluation of Trainee
Get Radiology Tree app to read full this article<
Get Radiology Tree app to read full this article<
Statistical Analysis
Get Radiology Tree app to read full this article<
Results
Get Radiology Tree app to read full this article<
Get Radiology Tree app to read full this article<
Table 1
Number of Cases Completed by Cohort for Each Joint
Joint First Year ( n = 12) Second Year ( n = 13) First/Second Year Combined ( n = 25) Knee 27.6 (2.2), [16–37] 30.92 (2.3), [15–38] 29.32 (1.6), [15–38] Shoulder 17.3 (1.7), [2–23] 17.46 (1.9), [5–24] 17.40 (1.2), [2–24] Pelvis 1.33 (0.6), [0–6] 3.85 (1.2), [0–10] 2.64 (0.7), [0–10] Ankle 2.00 (0.9), [0–9] 3.23 (1.0), [0–9] 2.64 (0.7), [0–9]
The values are represented as mean (standard deviation), [range].
Get Radiology Tree app to read full this article<
Search Pattern
Get Radiology Tree app to read full this article<
Get Radiology Tree app to read full this article<
Get Radiology Tree app to read full this article<
Get Radiology Tree app to read full this article<
Table 2
Pretraining and Posttraining Search Pattern Likert Scores for Each Cohort and Each Joint
Location Response First Year Second Year Third Year Pre Post Pre Post Knee Never (1) 4 (31%) 1 (9%) 1%–39% (2) 3 (23%) 3 (25%) 1 (9%) 40%–59% (3) 3 (25%) 1 (9%) 60%–79% (4) 1 (8%) 2 (17%) 5 (38%) 4 (36%) 80%–100% (5) 5 (38%) 12 (100%) 4 (33%) 8 (62%) 4 (36%) Shoulder Never (1) 4 (31%) 2 (17%) 1 (8%) 1%–39% (2) 3 (23%) 3 (25%) 1 (8%) 40%–59% (3) 1 (8%) 1 (8%) 2 (17%) 4 (33%) 60%–79% (4) 2 (15%) 2 (17%) 3 (25%) 5 (38%) 5 (42%) 80%–100% (5) 3 (23%) 9 (75%) 2 (17%) 8 (62%) 1 (8%) Pelvis Never (1) 7 (58%) 5 (42%) 4 (33%) 1 (8%) 3 (25%) 1%–39% (2) 2 (17%) 1 (8%) 3 (25%) 5 (38%) 4 (33%) 40%–59% (3) 1 (8%) 1 (8%) 3 (25%) 2 (15%) 4 (33%) 60%–79% (4) 1 (8%) 3 (25%) 1 (8%) 3 (23%) 1 (8%) 80%–100% (5) 1 (8%) 2 (17%) 1 (8%) 2 (15%) Ankle Never (1) 7 (58%) 4 (33%) 4 (33%) 2 (15%) 3 (25%) 1%–39% (2) 2 (17%) 1 (8%) 3 (25%) 2 (15%) 5 (42%) 40%–59% (3) 1 (8%) 1 (8%) 2 (17%) 2 (15%) 3 (25%) 60%–79% (4) 1 (8%) 2 (17%) 2 (17%) 6 (46%) 80%–100% (5) 1 (8%) 4 (33%) 1 (8%) 1 (8%) 1 (8%)
Values represent the number of residents in each cohort reporting Likert scores listed in the first column in parenthesis ranging from 1 to 5 with 5 representing search pattern use 80%–100% of the time.
Get Radiology Tree app to read full this article<
Confidence Scores
Get Radiology Tree app to read full this article<
Get Radiology Tree app to read full this article<
Table 3
Pretraining and Posttraining Confidence Likert Scores for each Class and each Joint
Location Response First Year Second Year Third Year Pre Post Pre Post Knee 1 6 (46%) 1 (8%) 1 (8%) 2 1 (8%) 1 (8%) 1 (8%) 3 1 (8%) 3 (25%) 1 (8%) 4 3 (23%) 3 (25%) 4 (33%) 4 (33%) 5 2 (15%) 5 (42%) 2 (17%) 8 (62%) 3 (25%) 6 3 (25%) 1 (8%) 4 (31%) 1 (8%) 7 1 (8%) 2 (17%) Shoulder 1 9 (69%) 1 (8%) 1 (8%) 1 (8%) 2 1 (8%) 3 (25%) 1 (8%) 1 (8%) 3 1 (8%) 2 (17%) 5 (42%) 2 (17%) 4 2 (15%) 5 (42%) 1 (8%) 6 (46%) 7 (58%) 5 2 (17%) 2 (17%) 4 (31%) 6 2 (17%) 2 (15%) 1 (8%) 7 Pelvis 1 12 (92%) 6 (50%) 6 (50%) 1 (8%) 4 (33%) 2 1 (8%) 4 (33%) 4 (33%) 2 (15%) 1 (8%) 3 1 (8%) 1 (8%) 5 (38%) 3 (25%) 4 1 (8%) 1 (8%) 2 (15%) 2 (17%) 5 3 (23%) 2 (17%) 6 7 Ankle 1 13 (100%) 6 (50%) 5 (42%) 1 (8%) 3 (25%) 2 4 (33%) 6 (50%) 3 (23%) 4 (33%) 3 1 (8%) 4 (31%) 3 (25%) 4 1 (8%) 2 (15%) 1 (8%) 5 3 (23%) 1 (8%) 6 1 (8%) 7
Values represent the number of residents in each cohort reporting Likert scores ranging from 1 to 7 with 7 representing the highest degree of confidence at interpreting the examination.
Get Radiology Tree app to read full this article<
Case Completion Correlation
Get Radiology Tree app to read full this article<
Learning Preference
Get Radiology Tree app to read full this article<
Table 4
Training Cohort Learning Style Preference
Learning Preference First Year Second Year First/Second Year Combined RVR workstation 11 (92%) 9 (69%) 20 (80%) Static image teaching files 1 (8%) 0 (0%) 1 (4%) Whatever I get on PACS 0 (0%) 4 (31%) 4 (16%)
PACS, picture archiving and communication system; RVR, Real View Radiology.
Values represent the number and percentage of residents in each cohort who favored each type of learning.
Get Radiology Tree app to read full this article<
Discussion
Get Radiology Tree app to read full this article<
Get Radiology Tree app to read full this article<
Get Radiology Tree app to read full this article<
Get Radiology Tree app to read full this article<
Get Radiology Tree app to read full this article<
Appendix A
Knee template
Get Radiology Tree app to read full this article<
Get Radiology Tree app to read full this article<
Get Radiology Tree app to read full this article<
Get Radiology Tree app to read full this article<
Get Radiology Tree app to read full this article<
Get Radiology Tree app to read full this article<
Get Radiology Tree app to read full this article<
Get Radiology Tree app to read full this article<
Get Radiology Tree app to read full this article<
Get Radiology Tree app to read full this article<
Get Radiology Tree app to read full this article<
Get Radiology Tree app to read full this article<
Get Radiology Tree app to read full this article<
Get Radiology Tree app to read full this article<
Get Radiology Tree app to read full this article<
Get Radiology Tree app to read full this article<
Get Radiology Tree app to read full this article<
Get Radiology Tree app to read full this article<
Get Radiology Tree app to read full this article<
Get Radiology Tree app to read full this article<
Get Radiology Tree app to read full this article<
Get Radiology Tree app to read full this article<
Get Radiology Tree app to read full this article<
Get Radiology Tree app to read full this article<
Get Radiology Tree app to read full this article<
1
2
3
4
5
6
7
8
9
10
11
12
13
14
15
- ii.
  [Get Radiology Tree app to read full this article<](https://clinicalpub.com/app)


  - 1.
    [Get Radiology Tree app to read full this article<](https://clinicalpub.com/app)

  - 2.
    [Get Radiology Tree app to read full this article<](https://clinicalpub.com/app)

  - 3.
    [Get Radiology Tree app to read full this article<](https://clinicalpub.com/app)

  - 4.
    [Get Radiology Tree app to read full this article<](https://clinicalpub.com/app)
Get Radiology Tree app to read full this article<
1
2
3
4
5
6
7
8
9
10
11
12
13
14
15
- iii.
  [Get Radiology Tree app to read full this article<](https://clinicalpub.com/app)


  - 1.
    [Get Radiology Tree app to read full this article<](https://clinicalpub.com/app)

  - 2.
    [Get Radiology Tree app to read full this article<](https://clinicalpub.com/app)

  - 3.
    [Get Radiology Tree app to read full this article<](https://clinicalpub.com/app)

  - 4.
    [Get Radiology Tree app to read full this article<](https://clinicalpub.com/app)
Get Radiology Tree app to read full this article<
1
2
3
4
5
6
7
8
9
10
11
12
- iv.
  [Get Radiology Tree app to read full this article<](https://clinicalpub.com/app)


  - 1.
    [Get Radiology Tree app to read full this article<](https://clinicalpub.com/app)

  - 2.
    [Get Radiology Tree app to read full this article<](https://clinicalpub.com/app)

  - 3.
    [Get Radiology Tree app to read full this article<](https://clinicalpub.com/app)
Get Radiology Tree app to read full this article<
Get Radiology Tree app to read full this article<
Get Radiology Tree app to read full this article<
Get Radiology Tree app to read full this article<
Get Radiology Tree app to read full this article<
Get Radiology Tree app to read full this article<
Get Radiology Tree app to read full this article<
Get Radiology Tree app to read full this article<
References
1. Wolfe J.M., Võ M.L.-H., Evans K.K., et. al.: Visual search in scenes involves selective and nonselective pathways. Trends Cogn Sci 2011 Feb; 15: pp. 77-84.
2. Oestmann J.W., Greene R., Kushner D.C., et. al.: Lung lesions: correlation between viewing time and detection. Radiology 1988 Feb; 166: pp. 451-453.
3. Drew T., Evans K., Võ M.L.-H., et. al.: Informatics in radiology: what can you see in a single glance and how might this guide visual search in medical images?. Radiogr Rev Publ Radiol Soc North Am Inc 2013 Feb; 33: pp. 263-274.
4. Berbaum K.S., Franken E.A., Caldwell R.T., et. al.: Satisfaction of search in traditional radiographic imaging. Handb Med Image Percept Tech.2010.Cambridge University PressCambridge, Englandpp. 107-138.
5. Krupinski E.A., Graham A.R., Weinstein R.S.: Characterizing the development of visual search expertise in pathology residents viewing whole slide images. Hum Pathol 2013 Mar; 44: pp. 357-364.
6. Nodine C.F., Kundel H.L., Lauver S.C., et. al.: Nature of expertise in searching mammograms for breast masses. Acad Radiol 1996 Dec; 3: pp. 1000-1006.
7. Elmore J.G., Wells C.K., Howard D.H.: Does diagnostic accuracy in mammography depend on radiologists’ experience?. J Womens Health 1998 May; 7: pp. 443-449.
8. Krupinski E.A.: Visual scanning patterns of radiologists searching mammograms. Acad Radiol 1996 Feb; 3: pp. 137-144.
9. Nodine C.F., Kundel H.L., Mello-Thoms C., Weinstein S.P., Orel S.G., Sullivan D.C., et. al.: How experience and training influence mammography expertise. Acad Radiol 1999 Oct; 6: pp. 575-585.
10. Sowden P.T., Davies I.R., Roling P.: Perceptual learning of the detection of features in X-ray images: a functional role for improvements in adults’ visual sensitivity?. J Exp Psychol Hum Percept Perform 2000 Feb; 26: pp. 379-390.
11. Kundel H.L., Nodine C.F.: Interpreting Chest Radiographs without Visual Search. Radiology 1975 Sep 1; 116: pp. 527-532.
12. Pauli R., Sowden P.T.: The role of feedback in learning screening mammography. Proc SPIE 1997; pp. 205-211.
13. Berbaum K.S., Franken E.A., Dorfman D.D., Caldwell R.T., Krupinski E.A.: Role of faulty decision making in the satisfaction of search effect in chest radiography. Acad Radiol 2000 Dec; 7: pp. 1098-1106.
14. Berbaum K.S., Franken E.A., Anderson K.L., Dorfman D.D., Erkonen W.E., Farrar G.P., et. al.: The influence of clinical history on visual search with single and multiple abnormalities. Invest Radiol 1993 Mar; 28: pp. 191-201.
15. Berbaum K., Franken E.A., Caldwell R.T., Schartz K.M.: Can a checklist reduce SOS errors in chest radiography?. Acad Radiol 2006 Mar; 13: pp. 296-304.
16. Drew T., Vo M.L.-H., Olwal A., Jacobson F., Seltzer S.E., Wolfe J.M.: Scanners and drillers: characterizing expert visual search through volumetric images. J Vis 2013; 13: