
Rationale and Objectives
Xenon-enhanced computed tomography (Xe-CT) measures regional ventilation from changes in lung parenchymal CT density during the multibreath washin/washout of inhaled Xe gas. Because Xe is moderately soluble, vascular uptake and redistribution has been proposed as a confounding phenomenon. We propose that the redistribution of Xe via the circulation is negligible, and correction is unwarranted.
Materials and Methods
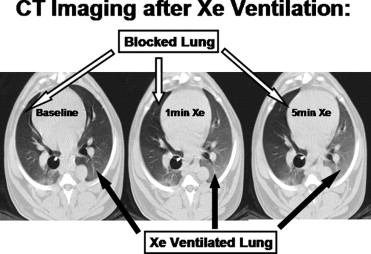
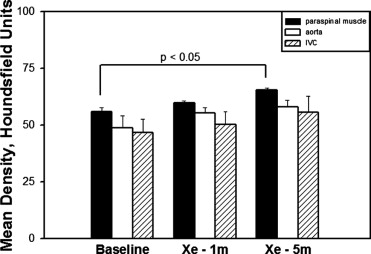
Unilateral ventilation with 60% Xe was performed in intubated canines. Whole-lung CT images were obtained at baseline and after 1 and 5 minutes of unilateral Xe ventilation. Comparisons between blocked (B) and Xe ventilated (V) whole lung densities were made. Density of paraspinous muscle and blood (aorta, inferior vena cava) were also compared.
Results
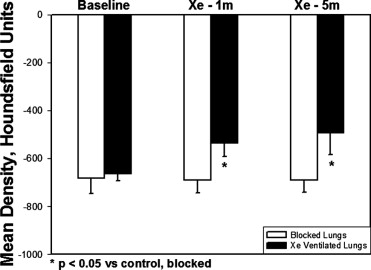
The density of lung tissue in the V lungs increased significantly compared to B lungs after 1 minute (B −688.5 ± 54.3 Hounsfield units [HU] vs. V –535.4 ± 55.6 HU, P < .05) and 5 minutes (B −689.1 ± 52.2 HU vs. V −492.9 ± 89.1 HU, P < .05) of Xe ventilation. The density in the blocked lungs did not significantly change after either 1 or 5 minutes of ventilation with Xe. Although density tended to increase with time in the blood and muscle, the change only reached significance in muscle at 5 minutes.
Conclusions
Five minutes of ventilation with a high concentration of Xe does not cause measurable density changes in the contralateral, unventilated lung. Xe accumulation in muscle tissue limits redistribution. Correction of Xe-CT time series density data may be unnecessary.
Xenon-enhanced computed tomography (Xe-CT) has been used to measure regional pulmonary ventilation by determining the washin and washout rates of stable xenon gas. Early models of Xe-CT made the assumption that Xe was insoluble in blood and tissue, giving rise to mono-exponential washin or washout curves ( ). Although Xe gas is inert, it is moderately soluble in the blood (solubility coefficient = 0.115) ( ). The anesthetic properties and the utility of Xe for CT-based cerebral perfusion measurements depend on this solubility of Xe gas in the blood, therefore leading to the suggestion that these early models were oversimplifications.
Because of this measurable gas uptake, it has been proposed ( ) that Xe uptake in the lungs, storage of dissolved Xe in the blood and peripheral tissues, and subsequent recirculation back to the lung may affect both background levels or alveolar accumulation rates. These models propose that the levels of Xe gas in the lung, which ultimately determine the CT-density signal, are composed of essentially four compartments. The first and second arise from the air component, made up of the inspired concentration of Xe and the concentration of Xe already in place in the alveoli. The third and fourth are vascular contributions, including blood uptake from of Xe into the pulmonary venous blood and the pulmonary arterial delivery of recirculated Xe in returning blood flow. Kreck et al ( ) proposed this four-compartment model, making complex mathematical corrections to account for the influences of each on the lung CT density measured during Xe washin and washout.
Get Radiology Tree app to read full this article<
Materials and methods
Get Radiology Tree app to read full this article<
Animal Preparation
Get Radiology Tree app to read full this article<
Image Acquisition
Get Radiology Tree app to read full this article<
Image Analysis
Get Radiology Tree app to read full this article<
Statistical Analysis
Get Radiology Tree app to read full this article<
Results
Get Radiology Tree app to read full this article<
Get Radiology Tree app to read full this article<
Get Radiology Tree app to read full this article<
Get Radiology Tree app to read full this article<
Get Radiology Tree app to read full this article<
Get Radiology Tree app to read full this article<
Discussion
Get Radiology Tree app to read full this article<
Get Radiology Tree app to read full this article<
Get Radiology Tree app to read full this article<
Get Radiology Tree app to read full this article<
Acknowledgments
Get Radiology Tree app to read full this article<
Get Radiology Tree app to read full this article<
References
1. Simon B.A., Marcucci C., Fung M., et. al.: Parameter estimation and confidence intervals for Xenon-CT ventilation studies: a Monte Carlo approach. J Appl Physiol 1998; 84: pp. 709-716.
2. Marcucci C., Nyhan D., Simon B.A.: Distribution of regional pulmonary ventilation in prone and supine dogs using xenon enhanced CT. J Appl Physiol 2001; 90: pp. 421-430.
3. Goto T., Suwa K., Uezono S., et. al.: The blood-gas partition coefficient of xenon may be lower than generally accepted. Br J Anaesth 1998; 80: pp. 255-256.
4. Chon D., Simon B.A., Beck K.C., et. al.: Differences in regional wash-in and wash-out time constants for xenon-CT ventilation studies. Respir Physiol Neurobiol 2005; 148: pp. 65-83.
5. Kreck T.C., Krueger M.A., Altemeier W.A., et. al.: Determination of regional ventilation and perfusion in the lung using xenon and computer tomography. J Appl Physiol 2001; 91: pp. 1741-1749.
6. Hoffman E.A., Reinhardt J.M., Sonka M., et. al.: Characterization of the interstitial lung diseases via density-based and texture-based analysis of CT images of lung structure and function. Acad Radiol 2003; 10: pp. 1104-1118.
7. Drayer B.P., Wolfson S.K., Reinmuth O.M., et. al.: Xenon enhanced CT for analysis of cerebral integrity, perfusion, and blood flow. Stroke 1978; 9: pp. 123-130.
8. Gupta R., Jovin T.G., Yonas H.: Xenon CT cerebral blood flow in acute stroke. Neuroimaging Clin N Am 2005; 15: pp. 531-542.
9. Lynch C., Baum J., Tenbrinck R.: Xenon anesthesia. Anesthesiology 2000; 92: pp. 865-868.
10. Gur D., Drayer B.P., Borovetz H.S., et. al.: Dynamic computed tomography of the lung: regional ventilation measurements. J Comput Assist Tomogr 1979; 3: pp. 749-753.
11. Murphy D.M., Nicewicz J.T., Zabbatino S.M., et. al.: Local pulmonary ventilation using nonradioactive xenon-enhanced ultrafast computed tomography. Chest 1989; 96: pp. 799-804.