
Rationale and Objectives
18 F-fluorodeoxyglucose positron emission tomography/computed tomography ( 18 F-FDG PET/CT) has demonstrated significant value in the evaluation of patients with indication of recurrent thyroid cancer with negative conventional workup. The hypothesis of this study was that the addition of a dedicated, high-resolution head and neck scan (HNS) to the standard whole-body scan (WBS) improves the accuracy of the detection and diagnosis of recurrent thyroid cancer.
Materials and Methods
Forty-three consecutive patients suspected for recurrent thyroid cancer, as indicated by increased tumor markers, prospectively underwent a WBS and a HNS with 18 F-FDG PET/CT. The patients were followed up to establish ground truth. A receiver operator characteristic (ROC) study with two observers was conducted to evaluate the impact of the additional HNS on the detection and diagnosis of recurrent thyroid cancer. Indices of performance included the area under the ROC curve (AUC), the number of detected abnormal foci, and the size of the detected foci without and with the HNS images.
Results
ROC results showed that the addition of the HNS to the standard WBS increased the average AUC index of performance from 0.69 to 0.96, a statistically significant difference with a confidence interval (CI) of −0.33 to −0.19. Diagnosis was also improved with the average AUC increasing from 0.79 to 0.87 but differences were not statistically significant (CI, −0.19 to 0.04). Interreader agreement was “good” in the detection task and “excellent” in the diagnostic task. The addition of the HNS increased the number of detected foci in the positive patients by an average of 37%, whereas false-positive detections in the negative patients increased by an average of 10%. Reported average maximum lesion size also increased with the HNS addition by an average of 11%.
Conclusions
The addition of a high-resolution HNS to the standard whole-body PET/CT imaging improves readers’ performance in the detection and diagnosis of recurrent thyroid cancer and could greatly benefit patient care.
Thyroid cancer is the most common endocrine malignancy. Differentiated thyroid cancer (DTC) represents the vast majority (85%–90%) of thyroid cancer types and is highly curable. The remainder 10%–15% comprises medullary carcinoma, anaplastic tumors, lymphomas, and sarcomas .
Measurement of thyroglobulin (Tg) levels and Iodine-131 whole-body scan ( 131 I WBS) are the standard methods for the evaluation of DTC after thyroidectomy. Although 18 F-fluorodeoxyglucose positron emission tomography/computerized tomography ( 18 F-FDG PET/CT) scan is not recommended for the routine detection of well-DTC, it has an important role in detecting patients with elevated Tg level but negative 131 I WBS because of low capacity for iodine concentration and elevated cellular glucose metabolism of dedifferentiated cells . 18 F-FDG PET/CT is also used for the assessment of patients with suspected recurrent or metastatic medullary thyroid carcinoma (MTC), in particular with increasing calcitonin levels .
Get Radiology Tree app to read full this article<
Materials and methods
Patients and Imaging
Get Radiology Tree app to read full this article<
PET/CT Protocol
Get Radiology Tree app to read full this article<
Evaluation Process
Get Radiology Tree app to read full this article<
Get Radiology Tree app to read full this article<
Get Radiology Tree app to read full this article<
Get Radiology Tree app to read full this article<
Get Radiology Tree app to read full this article<
Get Radiology Tree app to read full this article<
Standard of Reference
Get Radiology Tree app to read full this article<
Statistical Analysis
Get Radiology Tree app to read full this article<
Get Radiology Tree app to read full this article<
Get Radiology Tree app to read full this article<
Results
Detection Characteristics
Get Radiology Tree app to read full this article<
Table 1
Number of Suspicious Areas Identified in the WBS and HNS PET/CT Images by the Two Readers
Category Reader 1 Reader 2 WBS PET Images HNS PET Images WBS PET Images HNS PET Images Negative patients (17) 16 11 13 15 Positive patients (26) 37 46 37 55
CT, computed tomography; HNS, head and neck scan; PET, positron emission tomography; WBS, whole-body scan.
Patients with either inflammatory lesions or recurrent thyroid cancer are considered positive for this analysis.
Get Radiology Tree app to read full this article<
Get Radiology Tree app to read full this article<
WBS Alone versus Combined WBS + HNS PET/CT: Overall Detection Performance
Get Radiology Tree app to read full this article<
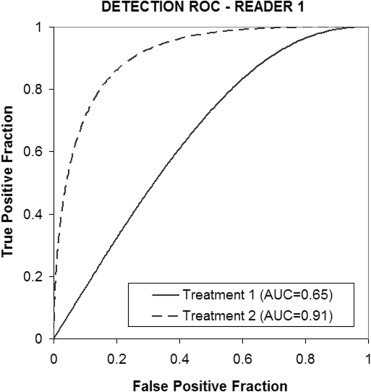
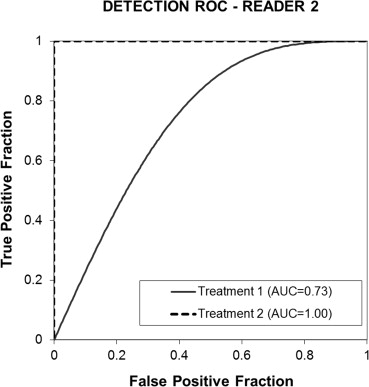
Table 2
Detection ROC Results for Random Readers and Random Cases
Treatment Mean AUC SE 95% CI 95% CI for Treatment Difference (1−2)P value for Treatment Difference (1−2) Treatment 1: WBS PET/CT 0.69 0.07 0.54–0.85 −0.33 to −0.19 .00 Treatment 2: WBS + HNS PET/CT 0.96 0.05 0.38–1.53
ANOVA, analysis of variance; AUC, area under the ROC curve; CI, confidence interval; CT, computed tomography; HNS, head and neck scan; PET, positron emission tomography; ROC, receiver operating characteristics; SE, standard error; WBS, whole-body scan.
Treatment mean AUCs (averaged across readers), SEs, and 95% CIs based on reader-by-case ANOVA for each treatment. The last two columns list the 95% CI for the difference between treatments and corresponding P value.
Get Radiology Tree app to read full this article<
Get Radiology Tree app to read full this article<
Get Radiology Tree app to read full this article<
WBS Alone versus Combined WBS + HNS PET/CT: Overall Diagnostic Performance
Get Radiology Tree app to read full this article<

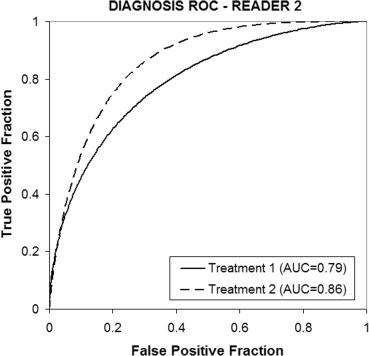
Table 3
Diagnosis ROC Results for Random Readers and Random Cases
Treatment Mean AUC SE 95% CI 95% CI for Treatment Difference (1−2)P value for Treatment Difference (1−2) Treatment 1: WBS PET/CT 0.79 0.06 0.67–0.91 −0.19 to 0.04 .17 Treatment 2: WBS + HNS PET/CT 0.87 0.04 0.79–0.95
ANOVA, analysis of variance; AUC, area under the ROC curve; CI, confidence interval; CT, computed tomography; HNS, head and neck scan; PET, positron emission tomography; ROC, receiver operating characteristics; SE, standard error; WBS, whole-body scan.
Treatment mean AUCs (averaged across readers), SEs, and 95% CIs based on reader-by-case ANOVA for each treatment. The last two columns list the 95% CI for the difference between treatments and corresponding P value.
Get Radiology Tree app to read full this article<
Get Radiology Tree app to read full this article<
Get Radiology Tree app to read full this article<
Discussion
Get Radiology Tree app to read full this article<
Get Radiology Tree app to read full this article<
Get Radiology Tree app to read full this article<
Get Radiology Tree app to read full this article<
Get Radiology Tree app to read full this article<
Get Radiology Tree app to read full this article<
References
1. AL-Nahhas A., Khan S., Gogbashian A., et. al.: 18 F-FDG PET in the diagnosis and follow-up of thyroid malignancy. In Vivo 2008; 22: pp. 109-114.
2. Lind P., Kohlfürst S.: Respective roles of thyroglobulin, radioiodine imaging and positron emission tomography in the assessment of thyroid cancer. Semin Nucl Med 2006; 36: pp. 194-205.
3. Abraham T., Schöder H.: Thyroid cancer—indications and opportunities for positron emission tomography/computed tomography imaging. Semin Nucl Med 2011; 41: pp. 121-138.
4. Zoller M., Kohlfuerst S., Igerc I., et. al.: Combined PET/CT in the follow-up of differentiated thyroid carcinoma: what is the impact of each modality?. Eur J Nucl Med Mol Imaging 2007; 34: pp. 487-495.
5. Davison J.M., Stocker D.J., Montilla-Soler J.L., et. al.: The added benefit of a dedicated neck 18 F FDG PET-CT imaging protocol in patients with suspected recurrent differentiated thyroid carcinoma. Clin Nucl Med 2008; 33: pp. 464-468.
6. Dorfman D.D., Berbaum K.S., Lenth R.V., et. al.: Monte Carlo validation of a multireader method for receiver operating characteristic discrete rating data: Factorial experimental design. AcadRadiol 1998; 5: pp. 591-602.
7. Hillis S.L., Berbaum K.S.: Power estimation for the Dorfman-Berbaum-Metz method. Acad Radiol 2004; 11: pp. 1260-1273.
8. Hillis S.L., Obuchowski N.A., Schartz K.M., et. al.: A comparison of the Dorfman-Berbaum-Metz and Obuchowski-Rockette methods for receiver operating characteristic (ROC) data. Stat Med 2005; 24: pp. 1579-1607.
9. Hillis S.L., Berbaum K.S.: Monte Carlo validation of the Dorfman-Berbaum-Metz method using normalized pseudovalues and less data-based model simplification. Acad Radiol 2005; 12: pp. 1534-1541.
10. Hillis S.L.: A comparison of denominator degrees of freedom for multiple observer ROC analysis. Stat Med 2007; 26: pp. 596-619.
11. Dorfman D.D., Berbaum K.S., Metz C.E.: Receiver operating characteristic rating analysis. Generalization to the population of readers and patients with the jackknife method. Invest Radiol 1992; 27: pp. 723-731.
12. Hillis S.L., Berbaum K.S., Metz C.E.: Recent developments in the Dorfman-Berbaum-Metz procedure for multireader ROC study analysis. Acad Radiol 2008; 15: pp. 647-661.
13. Pesce L.L., Metz C.E.: Reliable and computationally efficient maximum-likelihood estimation of “proper” binormal ROC curves. Acad Radiol 2007; 14: pp. 814-829.
14. Stokkel M.M., Duchateau C.J., Dragoiescu C.: The value of FDG-PET in the follow-up of differentiated thyroid cancer: a review of the literature. Q J Nucl Med Mol Imaging 2006; 50: pp. 78-87.
15. Yeo J.S., Chunk J.K., So Y., et. al.: F-18 fluorodeoxyglucose positron emission tomography as a presurgical evaluation modality for I-131 scan-negative thyroid carcinoma patients with local recurrence in cervical lymph nodes. Head Neck 2001; 23: pp. 94-103.
16. Hustinx R., Smith R.J., Benard F., et. al.: Dual time point fluorine-18 fluorodeoxyglucose positron emission tomography: a potential method to differentiate malignancy from inflammation and normal tissue in the head and neck. Eur J Nucl Med 1999; 26: pp. 1345-1348.