
Rationale and Objectives
The clinical gold standard for breast cancer diagnosis relies on invasive biopsies followed by tissue fixation for subsequent histopathological examination. This process renders the specimens to be much less suitable for biochemical or metabolic analysis. Our previous metabolic imaging data in tumor xenograft models showed that the mitochondrial redox state is a sensitive indicator that can distinguish between normal and tumor tissue. In this study, we investigated whether the same redox imaging technique can be applied to core biopsy samples of human breast cancer and whether the mitochondrial redox state may serve as a novel metabolic biomarker that may be used to distinguish between normal and malignant breast tissue in the clinic. Our long-term objective was to identify novel metabolic imaging biomarkers for breast cancer diagnosis.
Materials and Methods
Both normal and cancerous tissue specimens were collected from the cancer-bearing breasts of three patients shortly after surgical resection. Core biopsies and tissue blocks were obtained from tumor and normal adjacent breast tissue, respectively. All specimens were snap-frozen with liquid nitrogen, embedded in chilled mounting medium with flavin adenine dinucleotide and reduced nicotinamide adenine dinucleotide reference standards adjacently placed, and scanned using the Chance redox scanner (ie, cryogenic nicotinamide adenine dinucleotide/oxidized flavoprotein fluorescence imager).
Results
Our preliminary data showed cancerous tissues had up to 10-fold higher oxidized flavoprotein signals and had elevated oxidized redox state compared to the normal tissues from the same patient. A high degree of tumor tissue heterogeneity in the redox indices was observed.
Conclusions
Our finding suggests that the identified redox imaging indices could differentiate between cancer and noncancer breast tissues without subjecting tissues to fixatives. We propose that this novel redox scanning procedure may assist in tissue diagnosis in freshly procured biopsy samples before tissue fixation.
Biochemical analysis of cancer core biopsies has little diagnostic value in the clinic so far. In this study, we demonstrated a novel approach using the intrinsic biochemical properties of breast tissues as measured by the Chance redox scanner (named after Dr. Britton Chance) to distinguish between normal and cancerous breast tissues using clinical biopsy samples. The Chance redox scanner is a low-temperature ex vivo fluorescence imaging system that uses a raster-scanning fiberoptic probe coupled with a pair of rotating filter wheels to select proper excitation and emission light wavelengths to measure the endogenous fluorescence signals of reduced nicotinamide adenine dinucleotide (NADH) and oxidized flavoprotein (Fp) including flavin adenine dinucleotide (FAD) in tissue. With a tissue sample mounted in a liquid nitrogen-filled chamber and a miller to remove top tissues at different depth ( z axis), the scanner can image the three-dimensional distribution of NADH and Fp with a high spatial resolution down to 50 × 50 × 20 μm 3 . It requires only a small tissue sample (1 mm in two dimensions) for measurement of tissue mitochondrial redox states.
Redox scanning can become a diagnostic tool. NADH and reduced FAD are reducing equivalents used for the electron transport chain to generate ATP in mitochondria. It has been shown that the redox ratio [Fp/NADH or the normalized form, Fp/(Fp + NADH)] was a good representation of the tissue redox state and a sensitive indicator of mitochondrial metabolic state . It was discovered previously that the Fp redox ratio [ie, Fp/(Fp + NADH)] correlated with the degree of tumor invasiveness in mouse xenografts of human melanoma and breast cancer cell lines . In another study, the premalignant pancreatic tissue in the PTEN -null transgenic mouse model was shown to be more oxidized and heterogeneous in the mitochondrial redox state than the normal one . Redox scanning was also used to image the redox ratio variations in human dysplastic cervical tissues compared to normal controls .
Get Radiology Tree app to read full this article<
Get Radiology Tree app to read full this article<
Methods
Get Radiology Tree app to read full this article<
Get Radiology Tree app to read full this article<
Get Radiology Tree app to read full this article<
Get Radiology Tree app to read full this article<
Get Radiology Tree app to read full this article<
Get Radiology Tree app to read full this article<
Get Radiology Tree app to read full this article<
Results and discussion
Get Radiology Tree app to read full this article<
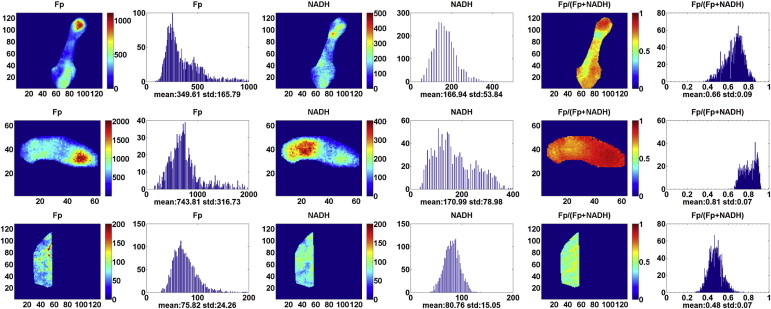
Table 1
Values of the Redox Indices of the Tumor and Normal (Control) Breast Tissues from Three Patients Analyzed by the Global Averaging Method
Type Fp, μmol/L NADH, μmol/L Fp Redox Ratio Control ( n = 3) 118 ± 89 138 ± 45 0.40 ± 0.09 Tumor ( n = 3) 652 ± 93 382 ± 283 0.61 ± 0.10P (paired t test) .027 .25 .071
Fp, flavoproteins; NADH, reduced nicotinamide adenine dinucleotide.
Get Radiology Tree app to read full this article<
Get Radiology Tree app to read full this article<
Table 2
Values of the Redox Indices of the Tumor and Normal (Control) Breast Tissues from Three Patients Analyzed by the General Linear Method Univariate Analysis
Type Fp, μmol/L NADH, μmol/L Fp Redox Ratio Control (6 sections) 118 ± 85 138 ± 42 0.40 ± 0.08 Tumor (14 sections) 620 ± 428 251 ± 210 0.67 ± 0.12P .015 .20 1.72E–04
Fp, flavoproteins; NADH, reduced nicotinamide adenine dinucleotide.
Get Radiology Tree app to read full this article<
Get Radiology Tree app to read full this article<
Get Radiology Tree app to read full this article<
Get Radiology Tree app to read full this article<
Get Radiology Tree app to read full this article<
Table 3
The Redox Indices of the Cancerous Core Biopsies Taken from Different Locations of Patient 1
Tissue Location Fp Redox Ratio NADH, μmol/L Fp, μmol/L a (2 sections) 0.54 ± 0.01 45 ± 13 57 ± 20 b (4 sections) 0.69 ± 0.03 139 ± 28 346 ± 38 d (5 sections) 0.82 ± 0.03 221 ± 38 1115 ± 344P ∗ .00001 .0004 .0017
Fp, flavoproteins; NADH, reduced nicotinamide adenine dinucleotide.
Get Radiology Tree app to read full this article<
Get Radiology Tree app to read full this article<
Get Radiology Tree app to read full this article<
Conclusions
Get Radiology Tree app to read full this article<
Acknowledgments
Get Radiology Tree app to read full this article<
References
1. Chance B., Schoener B., Oshino R., et. al.: Oxidation-reduction ratio studies of mitochondria in freeze-trapped samples. NADH and flavoprotein fluorescence signals. J Biol Chem 1979; 254: pp. 4764-4771.
2. Quistorff B., Haselgrove J.C., Chance B.: High spatial resolution readout of 3-D metabolic organ structure: an automated, low-temperature redox ratio-scanning instrument. Anal Biochem 1985; 148: pp. 389-400.
3. Li L.Z., Xu H.N., Ranji M., et. al.: Mitochondrial redox imaging for cancer diagnostic and therapeutic studies. J Innov Optical Health Sci 2009; 2: pp. 325-341.
4. Ozawa K., Chance B., Tanaka A., et. al.: Linear correlation between acetoacetate beta-hydroxybutyrate in arterial blood and oxidized flavoprotein reduced pyridine-nucleotide in freeze-trapped human liver-tissue. Biochim Biophys Acta 1992; 1138: pp. 350-352.
5. Li L.Z., Zhou R., Zhong T., et. al.: Predicting melanoma metastatic potential by optical and magnetic resonance imaging. Adv Exp Med Biol 2007; 599: pp. 67-78.
6. Li L.Z., Zhou R., Xu H.N., et. al.: Quantitative magnetic resonance and optical imaging biomarkers of melanoma metastatic potential. Proc Natl Acad Sci U S A 2009; 106: pp. 6608-6613.
7. Xu H.N., Nioka S., Glickson J.D., et. al.: Quantitative mitochondrial redox imaging of breast cancer metastatic potential. J Biomed Optics 2010; 15: pp. 036010.
8. Xu H.N., Nioka S., Chance B., et. al.: Heterogeneity of mitochondrial redox state in premalignant pancreas in a PTEN null transgenic mouse model. Adv Exp Med Biol 2011; 201: pp. 207-213.
9. Xu H.N., Nioka S., Chance B., et. al.: Imaging heterogeneity in the mitochondrial redox state of premalignant pancreas in the pancreas-specific PTEN-null transgenic mouse model. Biomarker Res 2013; 1: pp. 6.
10. Ramanujam N., Richards-Kortum R., Thomsen S., et. al.: Low temperature fluorescence imaging of freeze-trapped human cervical tissues. Opt Express 2001; 8: pp. 335-343.
11. Xu H.N., Tchou J., Chance B., et. al.: Imaging the redox states of human breast cancer core biopsies. Adv Exp Med Biol 2013; 765: pp. 343-349.
12. Xu H.N., Wu B., Nioka S., et. al.: Quantitative redox scanning of tissue samples using a calibration procedure. J Innov Opt Health Sci 2009; 2: pp. 375-385.
13. Xu H.N., Wu B., Nioka S., et. al.: Calibration of redox scanning for tissue samples. Proc SPIE 2009; 7174: pp. 71742F.
14. Evans N.T.S., Naylor P.F.D., Quinton T.H.: The diffusion coefficient of oxygen in respiring kidney and tumour tissue. Respir Physiol 1981; 43: pp. 179.
15. Groebe K., Vaupel P.: Evaluation of oxygen diffusion distances in human breast cancer xenografts using tumor-specific in vivo data: role of various mechanisms in the development of tumor hypoxia. Int J Radiat Oncol Biol Physics 1988; 15: pp. 691.
16. Krogh A.: The rate of diffusion of gases through animal tissues, with some remarks on the coefficient of invasion. J Physiol 1919; 52: pp. 391-408.
17. Macdougall J.D.B., McCabe M.: Diffusion coefficient of oxygen through tissues. Nature 1967; 215: pp. 1173.
18. Vaupel P., Mayer A., Briest S., et. al.: Hypoxia in breast cancer: role of blood flow, oxygen diffusion distances, and anemia in the development of oxygen depletion. Adv Exp Med Biol 2005; 566: pp. 333.