
Rationale and Objectives
To investigate for differences in metabolic concentrations and ratios between patients with systemic lupus erythematosus (SLE) without (group SLE) and those with neurological symptoms (group NPSLE) compared to a healthy control (group HC) in three normal-appearing brain regions: the frontal white matter, right insula (RI), and occipital gray matter and whether changes in any of the metabolites or metabolic ratios are correlated to disease activity and other clinical parameters.
Materials and Methods
Twenty patients with SLE (18 women and 2 men, age range 23.4–64.6 years, mean age 43.9 years), 23 NPSLE patients (23 women, age range 23.7–69.8 years, mean age 42.4 years), and 21 HC (19 women and 2 men, age range 21.0–65.7 years, mean age 43.4 years) were included. All subjects had conventional brain magnetic resonance imaging and 1 H single-voxel spectroscopy, clinical assessment, and laboratory testing.
Results
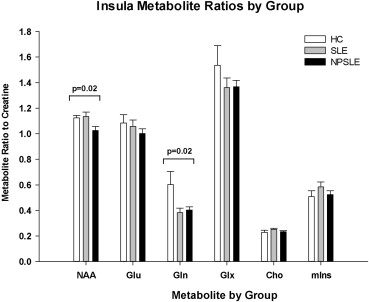
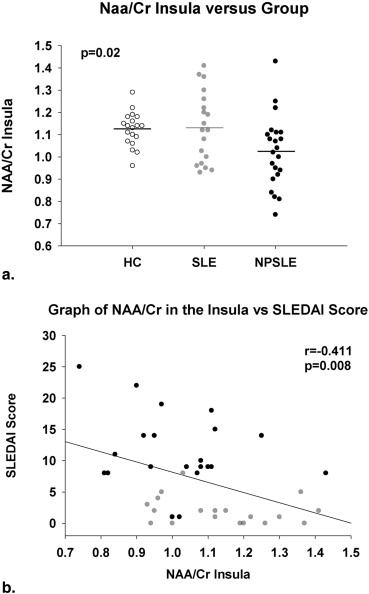
NPSLE patients had significantly reduced N -acetylaspartate (NAA)/creatine compared to HC ( P = .02) and SLE patients ( P = .01) in the RI. Lower glutamine/creatine levels were also detected in RI in both patient groups and in frontal white matter in NPSLE patients compared to HC ( P = .01, P = .02). NAA/Cr ratio in the RI was significantly negatively correlated with the Systemic Lupus Erythematosus Disease Activity Index ( r = −0.41; P = .008), and patients with active SLE symptoms also had a trend toward lower NAA/creatine ratios (1.02 vs 1.12; P = .07).
Conclusions
The present data support previous findings of abnormal metabolic changes in normal-appearing regions in the brain of both SLE and NPSLE patients and raise the possibility that especially NAA, glutamine, and glutamate may be additional biomarkers for cerebral disease activity in SLE patients as these early metabolic changes occur in the brain of SLE patients before neurologic and imaging manifestations become apparent.
Systemic lupus erythematosus (SLE) is a chronic inflammatory, immune-mediated disease that affects 0.1% of the general population. Neuropsychiatric SLE (NPSLE) is a severe and life-threatening condition, reported to occur in 25% to 70% of patients with SLE and associated with increased morbidity and mortality . Clinically, NPSLE can present with acute symptoms such as stroke, seizures, or movement disorders, which are usually diagnosed promptly and reliably. However, many individuals with SLE develop a variety of other symptoms, including headaches, psychosis, cognitive dysfunction, depression, or other less specific symptoms, and the diagnosis and attribution to NPSLE are much less certain. The wide variation in NSPLE incidence emphasizes the need for better diagnostic tests. Clinical manifestations of NPSLE include headaches, stroke, myelopathy, seizures, psychosis, confusional states, and cognitive impairment but also peripheral manifestations such as cranial neuropathies and inflammatory demyelinating polyradiculoneuropathies. Patients with concomitant antiphospholipid antibodies are at additional risk for neuropsychiatric events. Lupus patients are also at increased risk for a wide range of central nervous system (CNS) events related to immunosuppressive therapy, including infection and drug toxicity.
Magnetic resonance imaging (MRI) is frequently used to diagnose or exclude main brain alterations and has become part of the routine clinical workup of such alterations . Abnormal conventional MRI findings are common in both SLE and NPSLE patients and range from nonspecific small punctate focal lesions in white matter (WM) (present in the majority of NPSLE patients but not specific) to more severe findings such as cortical atrophy, ventricular dilation, cerebral edema, cerebral infarctions, and intracranial hemorrhage . These findings are attributed to different mechanisms, including thrombosis, vasculopathy, and antibody-mediated neuronal injury .
Get Radiology Tree app to read full this article<
Get Radiology Tree app to read full this article<
Materials and methods
Participants
Get Radiology Tree app to read full this article<
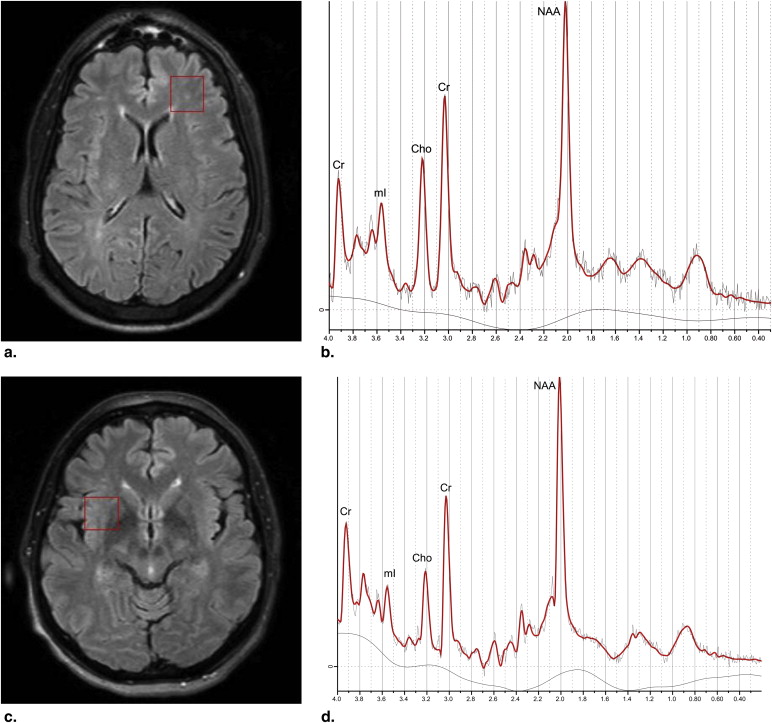
Conventional MRI and Proton MRS
Get Radiology Tree app to read full this article<
Get Radiology Tree app to read full this article<
Clinical Outcomes
Get Radiology Tree app to read full this article<
MR Image Evaluation
Get Radiology Tree app to read full this article<
Statistical Evaluation
Get Radiology Tree app to read full this article<
Results
Clinical Manifestations, Disease Severity, and Serological Data
Get Radiology Tree app to read full this article<
Table 1
Demographic and Disease Severity of the Study Subjects
HC (n = 21) SLE (n = 20) NPSLE (n = 23)P Value Age 21–66 23–65 23–70 .9 43.9 43.9 42.4 Female (n) 19 (90.5%) 18 (90%) 23 (100%) .3 Age at disease onset (yr) N/A 18–56 13–65 .8 33.4 ± 10.9 32.7 ± 13.5 Disease duration (yr) N/A 3–19 2–25 1.0 9.4 ± 5.2 10.5 ± 6.8 SLEDAI N/A 0–8 1–25 <.001 2.1 ± 2.5 11.3 ± 6.2 SLICC N/A 0–3 0–4 >.2 0.53 ± 1.01 0.95 ± 1.12 Mini-Mental State Examination score 32–33 31–33 31–32 >.2
HC, healthy controls; SLE, systemic lupus erythematosus; NPSLE, neuropsychiatric systemic lupus erythematosus; SLEDAI, Systemic Lupus Erythematosus Disease Activity Index; SLICC, Systemic Lupus Erythematosus International Collaborating Clinics; N/A, not applicable.
Values are range and mean ± SD unless otherwise noted.
Table 2
Laboratory Results and Antibody Data for Study Subjects
HC (n = 21) SLE (n = 20) NPSLE (n = 23)P Value Hemoglobin 11.6–15.5 10.9–15.8 9.5–14.7 1.162 ∗ 13.51/1.066 13.44/1.084 12.92/1.522 WBC 3.9–8.4 2.6–9.2 2.9–17.3 1.868 ∗ 5.9/1.272 5.847/1.99 7.25/3.64 Platelet count 214–365 152–405 176–683 .598 ∗ 268.6/46.54 265.74/56.58 289.9/110.58 Creatinine 0.6–1.2 0.6–1.50 0.5–1.0 1.961 ∗ 0.778/0.157 0.823/0.206 0.755/0.147 Double-stranded DNA N/A 0–28 0–126 .069 9.535/10.22 26.44/35.95 C3 N/A 85–145 65–189 .375 114.94/18.22 122.43/30.15 C4 N/A 7–40 11–39 .880 23.53/8.156 23.95/8.513 ESR N/A 4–27 2–43 .546 14.65/7.566 17.056/14.53 CRP N/A 0–1 0–3.3 .161 0.212/0.237 1.021/2.317 β2G-1 IgG N/A 0–25 0–110 .399 2.267/6.703 7.8/24.34 β2G-l IgM N/A 0–9 0–230 .312 0.867/2.475 14.55/51.404 β2G-l IgA N/A 0–9 0–18 .043 1.0/2.7 4.05/5.094 CAL IgG N/A 0–32 0–40 .438 2.412/7.722 5.1/12.19 CAL IgM N/A 0–13 0–36 .491 1.06/3.172 2.5/7.997 LAC 0–1 0–1 0–1 .078 All negative 4 of 20 positive 1 of 20 positive .239
HC, healthy controls; SLE, systemic lupus erythematosus; NPSLE, neuropsychiatric systemic lupus erythematosus; β2-GPI, β2-glycoprotein I; C3, C3 complement; C4, C4 complement; aCL, anticardiolipin antibody; CRP, C-reactive protein; ESR, erythrocyte sedimentation rate; LAC, lupus anticoagulant (binominal); WBC, white blood cell count; N/A, not applicable; IgG GPL, IgG phospholipid unit; IgM MPL, IgM phospholipid unit.
Values are range and mean ± SD unless otherwise noted.
The serological data are presented for the 20 patients NPSLE in whom data was available.
Get Radiology Tree app to read full this article<
Get Radiology Tree app to read full this article<
Conventional MRI
Get Radiology Tree app to read full this article<
Get Radiology Tree app to read full this article<
MRS
Get Radiology Tree app to read full this article<
Metabolic Ratios
Get Radiology Tree app to read full this article<
Get Radiology Tree app to read full this article<
Table 3
The Different Metabolic Ratios in the Three Evaluated Brain Regions Among the Three Groups
Metabolite HC SLE NPSLE_F_ Value_P_ Value Mean SD Mean SD Mean SD Right insula NAA/Cr 1.1241 0.07755 1.1342 0.15597 1.0250 0.15572 4.20 .02 Glu/Cr 1.0838 0.28334 1.0577 0.21900 1.0009 0.18186 0.73 .49 Gln/Cr 0.6029 0.3699 0.3823 0.12546 0.4023 0.11629 4.21 .02 Glx/Cr 1.5355 0.6542 1.3609 0.32481 1.3672 0.24571 1.00 .37 Cho/Cr 0.2282 0.0723 0.2517 0.04114 0.2336 0.04234 1.02 .37 Myoinositol/Cr 0.5090 0.1874 0.5837 0.16625 0.5236 0.14535 1.09 .34 Frontal white matter NAA/Cr 1.3331 0.12839 1.1948 0.35731 1.2287 0.11899 2.19 .12 glu/Cr 1.0936 0.33804 1.0558 0.21130 0.9220 0.15644 2.68 .08 gln/Cr 0.6384 0.41502 0.4193 0.31141 0.3628 0.15552 3.24 .05 Glx/Cr 1.5770 0.68329 1.2759 0.73870 1.2056 0.23912 2.38 .10 Cho/Cr 0.3089 0.08411 0.2509 0.10511 0.3098 0.05755 2.84 .07 Myoinositol/Cr 0.7939 0.70784 0.6657 0.17832 0.6413 0.12802 0.73 .49 Occipital gray matter NAA/Cr 1.4329 0.10830 1.4286 0.16598 1.3086 0.31613 2.12 .13 Glu/Cr 0.9116 0.09624 0.9381 0.15049 0.8737 0.22014 0.76 .47 Gln/Cr 0.2554 0.12949 0.2723 0.08932 0.2922 0.15251 0.23 .79 Glx/Cr 1.1283 0.16053 1.1507 0.22297 1.1102 0.32390 0.13 .88 Cho/Cr 0.1720 0.02321 0.1993 0.09818 0.1720 0.02737 1.36 .26 Myoinositol/Cr 0.5772 0.08476 0.6547 0.14335 0.5840 0.09660 2.95 .06
NAA, N -acetylaspartate; Cho, choline; Cr, creatine; Glu, glutamate; Gln, glutamine; Glx, combined Glu and Gln; HC, healthy controls; SLE, systemic lupus erythematosus; NPSLE, neuropsychiatric systemic lupus erytematosus.
Get Radiology Tree app to read full this article<
Metabolic Concentrations
Get Radiology Tree app to read full this article<
Metabolite Ratios and SLEDAI
Get Radiology Tree app to read full this article<
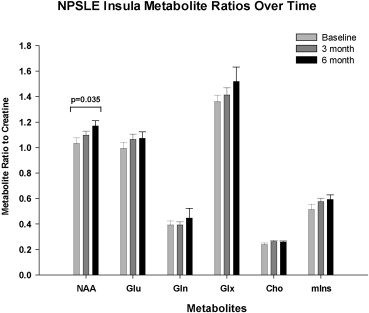
Longitudinal Follow-up of Metabolic Ratios
Get Radiology Tree app to read full this article<
Table 4
Longitudinal Follow-up of the Different Metabolic Ratios in the Insula in the NPSLE Patients
Metabolite Baseline 3 Months 6 Months_F_ Value_P_ Value Mean SD Mean SD Mean SD Insula NAA/Cr 1.03071 0.173151 1.09793 0.117026 1.16893 0.159068 4.52 .035 Glu/Cr 0.99243 0.169869 1.06321 0.160445 1.07129 0.198004 1.55 .25 Gln/Cr 0.39169 0.113944 0.39282 0.082682 0.44621 0.288669 0.38 .69 Glx/Cr 1.36129 0.185026 1.41314 0.209649 1.51743 0.427220 0.77 .48 Cho/Cr 0.23843 0.047144 0.26179 0.031737 0.2559 0.04290 1.25 .32 Myoinositol/Cr 0.51264 0.161923 0.57471 0.101972 0.5911 0.14314 1.29 .31
NAA, N -acetylaspartate; Cho, choline; Cr, creatine; Glu, glutamate; Gln, glutamine; Glx, combined Glu and Gln; NPSLE, neuropsychiatric systemic lupus erytematosus.
Get Radiology Tree app to read full this article<
Get Radiology Tree app to read full this article<
Get Radiology Tree app to read full this article<
Discussion
Get Radiology Tree app to read full this article<
Get Radiology Tree app to read full this article<
Get Radiology Tree app to read full this article<
Get Radiology Tree app to read full this article<
Get Radiology Tree app to read full this article<
Get Radiology Tree app to read full this article<
Get Radiology Tree app to read full this article<
Conclusions
Get Radiology Tree app to read full this article<
Get Radiology Tree app to read full this article<
References
1. Brey R.L., Holliday S.L., Saklad A.R., et. al.: Neuropsychiatric syndromes in lupus: prevalence using standardized definitions. Neurology 2002; 58: pp. 1214-1220.
2. Monastero R., Bettini R., Del Zotto , et. al.: Prevalence and pattern of cognitive impairment in systemic lupus erythematosus patients with and without overt neuropsychiatric manifestations. J Neurol Sci 2001; 184: pp. 33-39.
3. Sibley J.T., Olszynski W.P., Decoteau W.E., et. al.: The incidence and prognosis of central nervous system disease in systemic lupus erythematosus. J Rheumatol 1992; 19: pp. 47-52.
4. Gladman D., Ginzler E., Godlsmith C., et. al.: The development and initial validation of the Systemic Lupus International Collaborating Clinics/American College of Rheumatology damage index for systemic lupus erythematosus. Arthritis Rheum 1996; 39: pp. 363-369.
5. Appenzeller S., Pike G.B., Clarke A.E.: Magnetic resonance imaging in the evaluation of central nervous system manifestations in systemic lupus erythematosus. Clin Rev Allergy Immunol 2008; 34: pp. 361-366.
6. Cotton F., Bouffard-Vercelli J., Hermier M., et. al.: MRI of central nervous system in a series of 58 systemic lupus erythematosus (SLE) patients with or without overt neuropsychiatric manifestations. Rev Med Interne 2004; 25: pp. 8-15.
7. Petri M., Naqibuddin M., Carson K.A., et. al.: Brain magnetic resonance imaging in newly diagnosed systemic lupus erythematosus. J Rheumatol 2008; 35: pp. 2348-2354.
8. Sibbitt W.L., Brooks W.M., Kornfeld M., et. al.: Magnetic resonance imaging and brain histopathology in neuropsychiatric systemic lupus erythematosus. Semin Arthritis Rheum 2010; 40: pp. 32-52.
9. Fragoso-Loyo H., RRRichaud-Patin Y., Orozco-Narváez A., et. al.: Interleukin-6 and chemokines in the neuropsychiatric manifestations of systemic lupus erythematosus. Arthritis Rheum 2007; 56: pp. 1242-1250.
10. Ballok D.A., Woulfe J., Sur M., et. al.: Hippocampal damage in mouse and human forms of systemic autoimmune disease. Hippocampus 2004; 14: pp. 649-661.
11. Stanojcic M., Burstyn-Cohen T., Nashi N., et. al.: Disturbed distribution of proliferative brain cells during lupus-like disease. Brain Behav Immun 2009; 23: pp. 1003-1013.
12. Sibbitt W.L., Sibbitt R.R., Griffey R.H., et. al.: Magnetic resonance and computed tomographic imaging in the evaluation of acute neuropsychiatric disease in systemic lupus erythematosus. Ann Rheum Dis 1989; 12: pp. 1014-1022.
13. Lim M.K., Suh C.H., Kim H.J., et. al.: Systemic lupus erythematosus: brain MR imaging and single-voxel hydrogen1 MR spectroscopy. Radiology 2000; 217: pp. 43-49.
14. Axford J.S., Howe F.A., Heron C., et. al.: Sensitivity of quantitative 1 H magnetic resonance spectroscopy of the brain in detecting early neuronal damage in systemic lupus erythematosus. Ann Rheum Dis 2001; 60: pp. 106-111.
15. Sundgren P.C., Jennings J., Attwood T.J., et. al.: MRI and 2D-MR CSI spectroscopy of the brain in the evaluation of patients with acute onset of neuropsychiatric systemic lupus erythematosus. Neuroradiology 2005; 47: pp. 576-585.
16. Sibbitt W.L., Haseler L.J., Griffey R.R., et. al.: Neurometabolism of active neuropsychiatric lupus determined with proton MR spectroscopy. AJNR Am J Neuroradiol 1997; 18: pp. 1271-1277.
17. Brooks W.M., Sabet A., Sibbitt W.L., et. al.: Neurochemistry of brain lesions determined by spectroscopic imaging in systemic lupus erythematosus. J Rheumatol 1997; 24: pp. 2323-2329.
18. Chinn R.J.S., Wilkinson I.D., Hall-Craggs M.A., et. al.: Magnetic resonance imaging of the brain and cerebral proton spectroscopy in patients with systemic lupus erythematosus. Arthritis Rheum 1997; 40: pp. 36-46.
19. Kozora E., Brown M.S., Filley C.M., et. al.: Memory impairment associated with neurometabolic abnormalities of the hippocampus in patients with non-neuropsychiatric systemic lupus erythematosus. Lupus 2011; 20: pp. 598-606. Epub 2011 Feb 18
20. Harris R.E., Sundgren P.C., Pang Y., et. al.: Dynamic levels of glutamate within the insula are associated with improvements in multiple pain domains in fibromyalgia. Arthritis Rheum 2008; 58: pp. 903-907.
21. Bracken B.K., Jensen J.E., Prescot A.P., et. al.: Brain metabolite concentrations across cortical regions in healthy adults. Brain Res 2011; 1369: pp. 89-94. Epub 2010 Dec 7
22. Harris R.E., Sundgren P.C., Sen A., et. al.: Elevated insular glutamate (glu) in fibromyalgia (FM) is associated with experimental pain. Arthritis Rheum 2009; 60: pp. 3146-3152.
23. Hochberg M.C.: Updating the American College of Rheumatology revised criteria for the classification of systemic lupus erythematosus. Arthritis Rheum 1997; 40: pp. 1725.
24. The American College of Rheumatology nomenclature and case definitions for neuropsychiatric lupus syndromes. Arthritis Rheum 1999; 42: pp. 599-608.
25. Provencher S.W.: Estimation of metabolite concentrations from localized in vivo proton NMR spectra. Magn Reson Med 1993; 30: pp. 672-679.
26. Folstein M.F., Folstein S.E., McHugh P.R.: “Mini-Mental State”. A practical method for grading the cognitive state of patients for the clinician. J Psychiatr Res 1975; 12: pp. 189-198.
27. Bombardier C., Gladman D.D., Urowitz M.B., et. al.: Derivation of the SLEDAI. A disease activity index for lupus patients. The Committee on Prognosis Studies in SLE. Arthritis Rheum 1992; 35: pp. 630-640.
28. Steup-Beekman G.M., Zirkzee E.J.M., Cohen D., et. al.: Neuropsychiatric manifestations in patients with systemic lupus erythematosus: epidemiology and radiology pointing to an immune-mediated cause. Ann Rheum Dis 2013; 72: pp. ii76-ii79.
29. Jacobs L., Kinkel P., Costello P.B., et. al.: Central nervous system lupus erythematosus: the value of magnetic resonance imaging. J Rheumatol 1988; 15: pp. 601-606.
30. Bosma GPTh, Steens S.C.A., Petropoulos H., et. al.: Multisequence magnetic resonance imaging study of neuropsychiatric systemic lupus erythematosus. Arthritis Rheum 2004; 50: pp. 3195-3202.
31. Appenzeller S., Li L.M., Costallat L.Y.L., et. al.: Neurometabolic changes in normal white matter may predict appearance of hyperintense lesions in systemic lupus erythematosus. Lupus 2007; 16: pp. 963-971.
32. Sundgren PC, Cagnoli P, Wang P, et al. Changes in regional white matter integrity in the prefrontal cortex in patients with systemic lupus erythematosus. Proccedings Oral presentation #40, page 20, American Society of Neuroradiology Annual meeting May 18 -23, 2013, San Diego, CA, USA.
33. Narayana P.A.: Magnetic resonance spectroscopy in the monitoring of multiple sclerosis. J Neuroimaging 2005; 15: pp. 46S-57S.
34. Gerstner G.E., Gracely R.H., Deebajah A., et. al.: Posterior insular molecular changes in myofascial pain. Dent Res 2012; 91: pp. 485-490. Epub 2012 Mar 26
35. Moffett J.R., Ross B., Arun P., et. al.: N-Acetylaspartate in the CNS: from neurodiagnostics to neurobiology. Progr Neurobiol 2007; 81: pp. 89-131.
36. Appenzeller S., Li L.M., Costallat L.T.L., et. al.: Evidence of reversible axonal dysfunction in systemic lupus erythematosus: a proton MRS study. Brain 2005; 128: pp. 2933-2940.
37. Wang P., Cagnoli P.C., McCune W.J., et. al.: Perfusion weighted MR imaging in cerebral lupus erythematosus. Acad Radiol 2012 Aug; 19: pp. 965-970. Epub 2012 May 17
38. Gasparovic C., Roldan C., Sibbitt W., et. al.: Elevated cerebral blood flow and volume in systemic lupus measured by dynamic susceptibility contrast magnetic resonance imaging. J Rheumatol 2010; 37: pp. 1834-1843.
39. Emmer B., van Osch M., Wu O., et. al.: Perfusion MRI in neuro-psychiatric systemic lupus erthemathosus. J Magn Reson Imaging 2010; 32: pp. 283-288.
40. Rotondo E., Bruschetta G., Sacca A., et. al.: Straightforward relative quantitation and age- related human standards of N-acetylaspartate at the centrum semiovale level by CSI (1)H- MRS. Magn Reson Imaging 2003; 21: pp. 1055-1060.
41. Mosteret J.P., Blaauw Y., Koch M.W., et. al.: Reproducibility over a 1-month period of 1 H-MR spectroscopic imaging NAA/Cr ratios in clinically stable multiple sclerosis patients. Eur Radiol 2008; 18: pp. 1736-1740.