
Rationale and Objectives
The study aimed to evaluate the performances of two iterative reconstruction (IR) algorithms and of filtered back projection (FBP) when using reduced-dose chest computed tomography (RDCT) compared to standard-of-care CT.
Materials and Methods
An institutional review board approval was obtained. Thirty-six patients with hematologic malignancies referred for a control chest CT of a known lung disease were prospectively enrolled. Patients underwent standard-of-care scan reconstructed with hybrid IR, followed by an RDCT reconstructed with FBP, hybrid IR, and iterative model reconstruction. Objective and subjective quality measurements, lesion detectability, and evolution assessment on RDCT were recorded.
Results
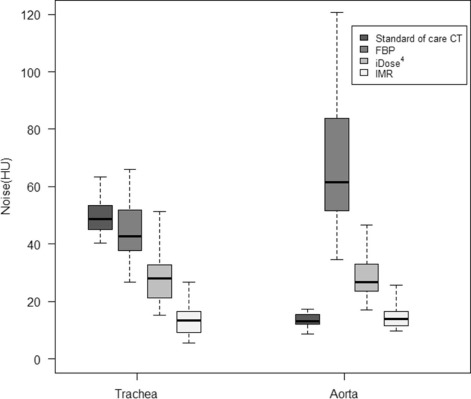
For RDCT, the CTDIvol (volumetric computed tomography dose index) was 0.43 mGy⋅cm for all patients, and the median [interquartile range] effective dose was 0.22 mSv [0.22–0.24]; corresponding measurements for standard-of-care scan were 3.4 mGy [3.1–3.9] and 1.8 mSv [1.6–2.0]. Noise significantly decreased from FBP to hybrid IR and from hybrid IR to iterative model reconstruction on RDCT, whereas lesion conspicuity and diagnostic confidence increased. Accurate evolution assessment was obtained in all cases with IR. Emphysema identification was higher with iterative model reconstruction.
Conclusion
Although iterative model reconstruction offered better diagnostic confidence and emphysema detection, both IR algorithms allowed an accurate evolution assessment with an effective dose of 0.22 mSv.
Introduction
Over the past decades, the average annual radiation dose delivered has raised significantly worldwide . Reducing computed tomography (CT) radiation dose has become a major concern because of the potential risk of radiation-induced cancer .
Various strategies have been developed to reduce radiation exposure while maintaining image quality, including tube potential selection and tube current modulation. Unfortunately, radiation dose decrease is limited when using filtered back projection (FBP) reconstruction. FBP assumes that each pixel value perfectly represents the attenuation of the object at this location, setting aside system hardware details and photon noise statistic information . Because of those idealized assumptions, a lowered radiation dose is accompanied by an increased noise and often increased artifacts.
Get Radiology Tree app to read full this article<
Get Radiology Tree app to read full this article<
Materials and Methods
Population
Get Radiology Tree app to read full this article<
Get Radiology Tree app to read full this article<
TABLE 1
Characteristics of Included Patients
Characteristics Patients ( n = 36) Age (y) \* 59[28.5–66] Sex ratio (M/F) 21/15 Body mass index (kg/m 2 ) \* 21.9[19.8–24.2] Effective diameter † (cm) \* 27[25.6–29.0] Delay since the initial chest computed tomography (d) \* 28[14–50] Initial pulmonary diagnosis Invasive aspergillosis (proven or probable) 7(19%) Bacterial pneumonia (proven or probable) 7(19%) Nonspecific lesions, probabilistic antifungal or antibiotic therapy 11(31%) Nonspecific lesions, no therapy 7(19%) All trans-retinoic acid syndrome 1(3%) Organizing pneumonia 1(3%) Lymphoma tumoral extension 1(3%) Alveolar proteinosis 1(3%)
Get Radiology Tree app to read full this article<
Get Radiology Tree app to read full this article<
Get Radiology Tree app to read full this article<
Imaging Protocol
Get Radiology Tree app to read full this article<
Reconstruction Process
Get Radiology Tree app to read full this article<
Radiation Dose Assessment
Get Radiology Tree app to read full this article<
Objective Measurements
Get Radiology Tree app to read full this article<
Subjective Measurements
Get Radiology Tree app to read full this article<
TABLE 2
Grading for Subjective Image Quality
1 2 3 4 5 Subjective noise Minimal image noise Less than average noise Average image noise Above average noise Unacceptable image noise Normal anatomic structure detectability \* Excellent visualization Above average visibility Acceptable visibility Unacceptable visualization of small structures Not applicable Artifacts † No artifacts Minor artifacts not interfering with diagnosis decision making Major artifacts but possible diagnosis Artifacts affecting diagnostic information Not applicable Lesion conspicuity Well-seen lesion with sharp margins Well-seen lesion with poorly demarcated margins Subtle lesion Probable artifact mimicking a lesion Definite artifact mimicking a lesion Diagnostic confidence Completely confident Probably confident Confident only for limited clinical situations Poor confidence Not applicable
Get Radiology Tree app to read full this article<
Get Radiology Tree app to read full this article<
Get Radiology Tree app to read full this article<
Get Radiology Tree app to read full this article<
Get Radiology Tree app to read full this article<
Statistical Analysis
Get Radiology Tree app to read full this article<
Results
Technical Parameters
Get Radiology Tree app to read full this article<
Get Radiology Tree app to read full this article<
Objective Measurements
Get Radiology Tree app to read full this article<
Get Radiology Tree app to read full this article<
Subjective Measurements
Get Radiology Tree app to read full this article<
TABLE 3
Subjective Quality Scores (Consensus Reading)
Standard-of-care CT Ultra Reduced-dose CT FBP iDose 4 IMR Subjective noise (1–5) 2 7(19) 0(0) 0(0) 32(89) 3 29(81) 0(0) 10(28) 4(11) 4 0(0) 18(50) 26(72) 0(0) 5 0(0) 18(50) 0(0) 0(0) Normal anatomic structure detectability(1–4) 2 10(28) 0(0) 0(0) 0(0) 3 26(72) 0(0) 0(0) 0(0) 4 0(0) 36(100) 36(100) 36(100) Artifacts(1–4) 1 21(58) 0(0) 0(0) 0(0) 2 15(42) 2(6) 25(69) 36(100) 3 0(0) 32(88) 11(31) 0(0) 4 0(0) 2(6) 0(0) 0(0) Lesion conspicuity(1–5) 1 35(97) 0(0) 0(0) 25(69) 2 1(3) 14(39) 31(86) 11(31) 3 0(0) 22(61) 5(14) 0(0) Diagnostic confidence(1–4) 1 36(100) 0(0) 0(0) 15(42) 2 0(0) 20(56) 35(97) 21(58) 3 0(0) 16(44) 1(3) 0(0)
CT, computed tomography; FBP, filtered back projection; IMR, iterative model reconstruction.
Data are expressed as count (percentages).

Get Radiology Tree app to read full this article<
Get Radiology Tree app to read full this article<
Get Radiology Tree app to read full this article<
Get Radiology Tree app to read full this article<
TABLE 4
Lesion Detection
FBP iDose 4 IMR Lesion Number of Lesion with Standard-of-care CT Number of Lesion with RDCT Sensitivity (95% CI) Specificity (95% CI) Number of Lesion with RDCT Sensitivity (95% CI) Specificity (95% CI) Number of Lesion with RDCT Sensitivity (95% CI) Specificity (95% CI) Ground-glass opacity 75 53 0.67(0.55–0.77) 0.98(0.94–0.97) 75 0.96(0.89–0.99) 0.98(0.94–1) 77 0.95(0.87–0.99) 0.96(0.91–0.98) Emphysema 48 33 0.65(0.50–0.78) 0.99(0.96–1) 33 0.67(0.52–0.8) 0.99(0.97–1) 45 0.9(0.77–0.97) 0.99(0.96–1) Consolidation 32 30 0.94(0.79–0.99) 1(0.98–1) 30 0.94(0.79–0.99) 1(0.98–1) 32 1(0.89–1) 1(0.98–1) Linear atelectasis 21 22 0.95(0.76–1) 0.99(0.96–1) 21 1(0.84–1) 1(0.98–1) 18 0.86(0.64–0.97) 1(0.98–1) Bronchiectasis 15 8 0.53(0.27–0.79) 1(0.98–1) 11 0.73(0.45–0.92) 1(0.98–1) 9 0.6(0.32–0.84) 1(0.98–1) Septal thickening 7 3 0.43(0.01–0.82) 1(0.98–1) 4 0.57(0.18–0.9) 1(0.98–1) 4 0.57(0.18–0.9) 1(0.98–1)
CI, confidence interval; CT, computed tomography; FBP, filtered back projection; IMR, iterative model reconstruction; RDCT, reduced-dose chest computed tomography.
Get Radiology Tree app to read full this article<
Get Radiology Tree app to read full this article<
Get Radiology Tree app to read full this article<
Discussion
Get Radiology Tree app to read full this article<
Get Radiology Tree app to read full this article<
Get Radiology Tree app to read full this article<
Get Radiology Tree app to read full this article<
Get Radiology Tree app to read full this article<
Get Radiology Tree app to read full this article<
Get Radiology Tree app to read full this article<
Get Radiology Tree app to read full this article<
Acknowledgments
Get Radiology Tree app to read full this article<
References
1. Mettler F.A., Bhargavan M., Faulkner K., et. al.: Radiologic and nuclear medicine studies in the United States and worldwide: frequency, radiation dose, and comparison with other radiation sources–1950-2007. Radiology 2009; 253: pp. 520-531.
2. Brenner D.J., Hall E.J.: Computed tomography—an increasing source of radiation exposure. N Engl J Med 2007; 357: pp. 2277-2284.
3. Brooks R.A., Di Chiro G.: Theory of image reconstruction in computed tomography. Radiology 1975; 117: pp. 561-572.
4. Mehta D., Thompson R., Morton T., et. al.: Iterative model reconstruction: simultaneously lowered computed tomography radiation dose and improved image quality. Med Phys Int J 2013; 1: pp. 147-155.
5. Kim H., Park C.M., Song Y.S., et. al.: Influence of radiation dose and iterative reconstruction algorithms for measurement accuracy and reproducibility of pulmonary nodule volumetry: a phantom study. Eur J Radiol 2014; 83: pp. 848-857.
6. Yuki H., Oda S., Utsunomiya D., et. al.: Clinical impact of model-based type iterative reconstruction with fast reconstruction time on image quality of low-dose screening chest CT. Acta Radiol 2015; 57: pp. 295-302.
7. Khawaja R.D.A., Singh S., Gilman M., et. al.: Computed tomography (CT) of the chest at less than 1 mSv: an ongoing prospective clinical trial of chest CT at submillisievert radiation doses with iterative model image reconstruction and iDose4 technique. J Comput Assist Tomogr 2014; 38: pp. 613-619.
8. Koh T.T., Colby T.V., Müller N.L.: Myeloid leukemias and lung involvement. Semin Respir Crit Care Med 2005; 26: pp. 514-519.
9. Georgiadou S.P., Sipsas N.V., Marom E.M., et. al.: The diagnostic value of halo and reversed halo signs for invasive mold infections in compromised hosts. Clin Infect Dis 2011; 52: pp. 1144-1155.
10. Bissinger A.L., Einsele H., Hamprecht K., et. al.: Infectious pulmonary complications after stem cell transplantation or chemotherapy: diagnostic yield of bronchoalveolar lavage. Diagn Microbiol Infect Dis 2005; 52: pp. 275-280.
11. Vahid B., Marik P.E.: Infiltrative lung diseases: complications of novel antineoplastic agents in patients with hematological malignancies. Can Respir J 2008; 15: pp. 211.
12. Nakaseko C., Ozawa S., Sakaida E., et. al.: Incidence, risk factors and outcomes of bronchiolitis obliterans after allogeneic stem cell transplantation. Int J Hematol 2011; 93: pp. 375-382.
13. Tack D., Kalra M.K., Genevois P.A.: ALARA concept for MDCT optimization: what is reasonable, what is achievable?.Tack D.Kalra M.K.Gevenois P.A.Radiation dose multidetector CT.2012.SpringerBerlin Heidelberg:pp. 231-258.
14. Wang Y., de Bock G.H., van Klaveren R.J., et. al.: Volumetric measurement of pulmonary nodules at low-dose chest CT: effect of reconstruction setting on measurement variability. Eur Radiol 2010; 20: pp. 1180-1187.
15. Nakajo C., Heinzer S., Montandon S., et. al.: Chest CT at a dose below 0.3 mSv: impact of iterative reconstruction on image quality and lung analysis. Acta Radiol 2015; 57: pp. 311-317.
16. Christner J.A., Kofler J.M., McCollough C.H.: Estimating effective dose for CT using dose-length product compared with using organ doses: consequences of adopting International Commission on Radiological Protection publication 103 or dual-energy scanning. AJR Am J Roentgenol 2010; 194: pp. 881-889.
17. American Association of Physicist in Medicine : Size-specific dose estimates (SSDE) in pediatric and adult body CT examinations. Task Group 2042011.
18. Singh S., Kalra M.K., Gilman M.D., et. al.: Adaptive statistical iterative reconstruction technique for radiation dose reduction in chest CT: a pilot study. Radiology 2011; 259: pp. 565-573.
19. Singh S., Kalra M.K., Moore M.A., et. al.: Dose reduction and compliance with pediatric CT protocols adapted to patient size, clinical indication, and number of prior studies. Radiology 2009; 252: pp. 200-208.
20. Yamada Y., Jinzaki M., Hosokawa T., et. al.: Dose reduction in chest CT: comparison of the adaptive iterative dose reduction 3D, adaptive iterative dose reduction, and filtered back projection reconstruction techniques. Eur J Radiol 2012; 81: pp. 4185-4195.
21. Hansell D.M., Bankier A.A., MacMahon H., et. al.: Fleischner Society: glossary of terms for thoracic imaging. Radiology 2008; 246: pp. 697-722.
22. Agresti A., Min Y.: Simple improved confidence intervals for comparing matched proportions. Stat Med 2005; 24: pp. 729-740.
23. Larke F.J., Kruger R.L., Cagnon C.H., et. al.: Estimated radiation dose associated with low-dose chest CT of average-size participants in the national lung screening trial. Am J Roentgenol 2011; 197: pp. 1165-1169.
24. Lambert L., Ourednicek P., Briza J., et. al.: Sub-milliSievert ultralow-dose CT colonography with iterative model reconstruction technique. PeerJ 2016; 4: pp. e1883. http://dx.doi.org/10.7717/peerj.1883
25. Neroladaki A., Botsikas D., Boudabbous S., et. al.: Computed tomography of the chest with model-based iterative reconstruction using a radiation exposure similar to chest x-ray examination: preliminary observations. Eur Radiol 2012; 23: pp. 360-366.
26. Katsura M., Matsuda I., Akahane M., et. al.: Model-based iterative reconstruction technique for ultralow-dose chest CT. Invest Radiol 2013; 48: pp. 206-212.
27. Yamada Y., Jinzaki M., Tanami Y., et. al.: Model-based iterative reconstruction technique for ultralow-dose computed tomography of the lung: a pilot study. Invest Radiol 2012; 47: pp. 482-489.
28. Katsura M., Matsuda I., Akahane M., et. al.: Model-based iterative reconstruction technique for radiation dose reduction in chest CT: comparison with the adaptive statistical iterative reconstruction technique. Eur Radiol 2012; 22: pp. 1613-1623.
29. Kim Y., Kim Y.K., Lee B.E., et. al.: Ultra-low-dose CT of the thorax using iterative reconstruction: evaluation of image quality and radiation dose reduction. AJR Am J Roentgenol 2015; 204: pp. 1197-1202.
30. Lee S.W., Kim Y., Shim S.S., et. al.: Image quality assessment of ultra low-dose chest CT using sinogram-affirmed iterative reconstruction. Eur Radiol 2014; 24: pp. 817-826.
31. Nagatani Y., Takahashi M., Murata K., et. al.: Lung nodule detection performance in five observers on computed tomography (CT) with adaptive iterative dose reduction using three-dimensional processing (AIDR 3D) in a Japanese multicenter study: comparison between ultra-low-dose CT and low-dose CT by receiver-operating characteristic analysis. Eur J Radiol 2015; 84: pp. 1401-1412.
32. Laqmani A., Buhk J.H., Henes F.O., et. al.: Impact of a 4th generation iterative reconstruction technique on image quality in low-dose computed tomography of the chest in immunocompromised patients. Rofo 2013; 185: pp. 749-757.
33. Willemink M.J., Borstlap J., Takx R.A.P., et. al.: The effects of computed tomography with iterative reconstruction on solid pulmonary nodule volume quantification. PLoS ONE 2013; 8: e58053