
Rationale and Objectives
Multireader, multicase (MRMC) receiver-operating characteristic studies often require large numbers of patients, readers, and reader interpretations. The objective of this work is to evaluate a new “mixed” MRMC study design that reduces the number of reader interpretations.
Materials and Methods
As compared to the traditional MRMC design, the number of reader interpretations and the number of cases that must be truth-verified for the new mixed design was evaluated theoretically and empirically for various correlation values and sample sizes.
Results
For large MRMC studies, the new mixed design offers a substantial savings in the number of reader interpretations if the magnitude of the difference in between-reader correlations is not zero. For example, compared to a traditional design with 20 readers, 200 total cases, and a difference in between-reader correlations of 0.05, the newly proposed mixed design requires each reader to interpret only 132 cases, but at a cost of truth-verifying an additional 64 cases.
Conclusions
The mixed design can reduce the number of cases that readers need to interpret and the overall duration of a study, but at a cost in terms of the number of cases that must be truth-verified. The mixed design is particularly useful for studies where the condition being detected is not rare and patients routinely undergo the gold standard assessment.
Multireader, multicase (MRMC) receiver-operating characteristic (ROC) studies are commonly used to assess and compare the diagnostic accuracy of imaging tests. For example, the MRMC design is often used in retrospective studies to evaluate the diagnostic accuracy efficacy of computer-aided detection (CAD) devices for breast, lung, and colon cancer by comparing readers’ ROC areas without the aid of CAD versus their ROC areas with the aid of CAD ( ).
Because the improvement in accuracy with CAD devices is often small, MRMC ROC studies often require a large sample of patients (usually 100–300) and a moderate-to-large sample of readers (10–20). In a typical CAD study of this size, there would be 2,000–12,000 total reader interpretations. Ways to reduce the total number of reader interpretations and the number of interpretations per reader would reduce both the overall costs of the study as well as its duration. In this work, a new MRMC study design is described, referred to as the mixed design, which reduces the total number of reader interpretations at a cost of additional cases that must be truth-verified.
Materials and methods
MRMC Studies
Get Radiology Tree app to read full this article<
Get Radiology Tree app to read full this article<
Ho:μ1=μ2HA:μ1≠μ2. H
o
:
μ
1
=
μ
2
H
A
:
μ
1
≠
μ
2
.
Get Radiology Tree app to read full this article<
Previously Proposed MRMC Study Designs
Get Radiology Tree app to read full this article<
Get Radiology Tree app to read full this article<
Table 1
Layout for Traditional Study Design (one dataset)
Reader #1 Reader #2 … Reader #J Test 1 Test 2 Test 1 Test 2 Test 1 Test 2 Case #1 Case #2 Case #3 … Case #N T
In the traditional design, each of the J readers interprets the same sample of N T cases. Here we show the layout for the comparison of two diagnostic tests. There are a total of 2(J)(N T ) reader interpretations, and a total of N T cases to truth-verify.
Table 2
Layout for Hybrid Study Design (J datasets)
Reader #1 Reader #2 … Reader #J Test 1 Test 2 Test 1 Test 2 Test 1 Test 2 Case #1_1 Case #1_2 Case #1_J Case #2_1 Case #2_2 Case #2_J Case #3_1 Case #3_2 Case #3_J … … … Case #N H _1 Case #N H _2 Case #N H _J
In the hybrid design, each of the J readers interprets his own sample of N H cases. Here we show the layout for the comparison of two diagnostic tests. There are a total of 2(J)(N H ) reader interpretations, and a total of (J)(N H ) cases to truth-verify.
Get Radiology Tree app to read full this article<
Get Radiology Tree app to read full this article<
Get Radiology Tree app to read full this article<
Get Radiology Tree app to read full this article<
“Mixed” MRMC Design
Get Radiology Tree app to read full this article<
Get Radiology Tree app to read full this article<
Get Radiology Tree app to read full this article<
Table 3
Layout for Mixed Study Design
Two Datasets ⁎ Reader #1 … Reader #(J/2) Reader #(J/2)+1 … Reader #J Test 1 Test 2 Test 1 Test 2 Test 1 Test 2 Test 1 Test 2 Case #1 Case #1 Case #2 Case #2 Case #3 Case #3 … … Case #N M Case #N M
Three Datasets † Reader #1 … Reader #(J/3) Reader #(J/3)+1 … Reader #(2J/3) Reader #(2J/3)+1 … Reader #J Test 1 2 1 2 1 2 1 2 1 2 1 2 Case #1 Case #1 Case #1 Case #2 Case #2 Case #2 Case #3 Case #3 Case #3 … … … Case #N M Case #N M Case #N M
Get Radiology Tree app to read full this article<
Get Radiology Tree app to read full this article<
Get Radiology Tree app to read full this article<
Effect of Study Design on Study Power
Get Radiology Tree app to read full this article<
power=prob(F1,df2,λ>F1−α,1,df2), power
=
prob
(
F
1
,
df
2
,
λ
F
1
−
α
,
1
,
df
2
)
,
where
λ=[J(μ1−μ2)2]/[2{σ2b(1−rb)+σ2w+σ2c[(1−r1)+(J−1)(r2−r3)]}] λ
=
[
J
(
μ
1
−
μ
2
)
2
]
/
[
2
{
σ
b
2
(
1
−
r
b
)
+
σ
w
2
+
σ
c
2
[
(
1
−
r
1
)
+
(
J
−
1
)
(
r
2
−
r
3
)
]
}
]
and prob(F 1,df2,λ > F 1 − α,1,df2 ) is the probability that a random variable having a noncentral F distribution with 1 and df 2 degrees of freedom and noncentrality parameter λ exceeds the (1 − α)100th percentile of a central F distribution, with 1 and df 2 degrees of freedom. J is the total number of readers in the study and μ i , here, is the conjectured average of readers’ area under the ROC curve for the ith diagnostic test (note that other measures of accuracy, such as the partial area under the ROC curve, can also be used). σ b 2 is the between-reader variability and r b is the correlation between accuracies when the same readers evaluate patients using different tests. Note that r b describes the correlation between the different tests because of the paired-reader design. Even in an unpaired-patient design, readers with high accuracy will tend to do well on both tests, and readers with low accuracy will tend to perform poorly on both tests; r b measures this tendency. σ w 2 is the within-reader variability and σ c 2 is the variability resulting from different patient samples. σ c 2 will tend to be high for samples of difficult-to-diagnose patients and tend to be smaller for samples of easy-to-diagnose patients. For sample size estimation, σ c 2 can be estimated as a function of the conjectured magnitude of diagnostic accuracy, μ i , and the patient sample size ( ). r 1 , r 2 , and r 3 are correlations between estimated diagnostic accuracies from the same sample of patients being interpreted by the readers. They describe the correlations between different pairs of readers and diagnostic tests. r 1 is the correlation between the estimated diagnostic accuracies of the same reader, but with different diagnostic tests; r 2 is the correlation between the estimated diagnostic accuracies of different readers using the same test; and r 3 is the correlation between estimated diagnostic accuracies of different readers using different tests. Note that these correlations are zero when the pairs of diagnostic accuracies are estimated from different samples of patients.
Get Radiology Tree app to read full this article<
Get Radiology Tree app to read full this article<
Get Radiology Tree app to read full this article<
Get Radiology Tree app to read full this article<
σ2c[(1−r1)+(J−1)(r2−r3)]. σ
c
2
[
(
1
−
r
1
)
+
(
J
−
1
)
(
r
2
−
r
3
)
]
.
Get Radiology Tree app to read full this article<
Get Radiology Tree app to read full this article<
Get Radiology Tree app to read full this article<
σ2c=[(0.0099e−(axa)/2){(5a2+8)+(a2+8)/κ}]/M σ
c
2
=
[
(
0.0099
e
−
(
axa
)
/
2
)
{
(
5
a
2
+
8
)
+
(
a
2
+
8
)
/
κ
}
]
/
M
where a = [Φ −1 (AUC)](1.414), AUC is the conjectured area under the ROC curve, and Φ −1 is the inverse of the cumulative normal distribution (4). σ c 2 increases in the mixed design because there are fewer patients interpreted by each reader. If M T and M M are denoted as the number of study patients with the condition interpreted by each reader in the traditional and mixed designs, respectively, then in the mixed design, σ c 2 increases by M T /M M over that in the traditional design (M T > M M ).
Get Radiology Tree app to read full this article<
Get Radiology Tree app to read full this article<
Get Radiology Tree app to read full this article<
Total#ofreaderinterpretations=(I)(J)(M)(1+κ) Total
#
of
reader
interpretations
=
(
I
)
(
J
)
(
M
)
(
1
+
κ
)
Get Radiology Tree app to read full this article<
Get Radiology Tree app to read full this article<
Comparison Between Traditional and Mixed MRMC Designs
Get Radiology Tree app to read full this article<
Get Radiology Tree app to read full this article<
Results
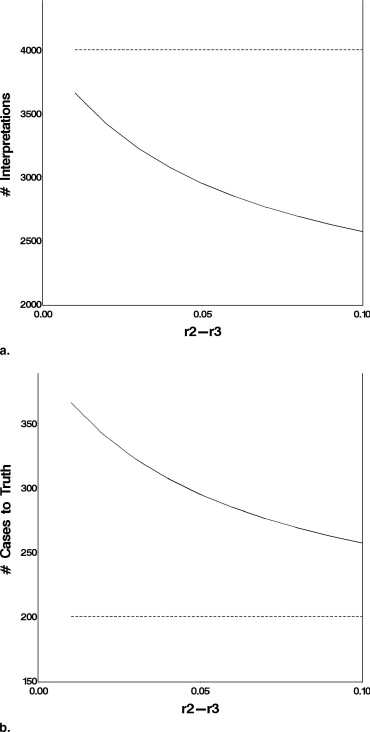
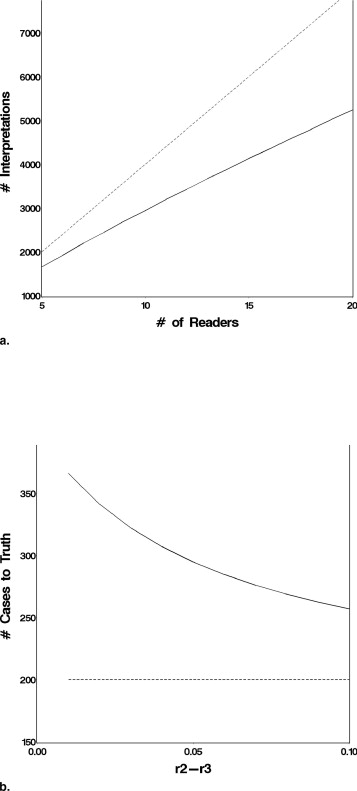
Effect of the Magnitude of (r 2 − r 3 )
Get Radiology Tree app to read full this article<
Get Radiology Tree app to read full this article<
Get Radiology Tree app to read full this article<
Get Radiology Tree app to read full this article<
Effect of the Number of Readers
Get Radiology Tree app to read full this article<
Get Radiology Tree app to read full this article<
Get Radiology Tree app to read full this article<
Mixed Design in Large Studies
Get Radiology Tree app to read full this article<
Table 4
Comparison of Traditional and Mixed Designs for Large-sized Studies
Traditional Design Mixed Design (two datasets) Mixed Design (three datasets) No. Reader Interpretations No. Cases to Truth No. Reader Interpretations No. Cases to Truth No. Reader Interpretations No. Cases to Truth 10 Readers (r 2 − r 3 ) = 0.01 4000 200 3680 368 1780 534 (r 2 − r 3 ) = 0.05 4000 200 2960 296 1320 396 (r 2 − r 3 ) = 0.10 4000 200 2600 260 1100 330 20 Readers (r 2 − r 3 ) = 0.01 8000 200 6880 344 6480 486 (r 2 − r 3 ) = 0.05 8000 200 5280 264 4400 330 (r 2 − r 3 ) = 0.10 8000 200 4720 236 3600 270
Mixed design (two datasets) refers to a design in which half of the readers interpret one sample of cases and the remaining readers interpret a second sample of cases. Mixed design (three datasets) refers to a design in which one third of the readers interpret one sample of cases, one third interprets a second sample of cases, and the remaining readers interpret a third sample of cases.
Get Radiology Tree app to read full this article<
Get Radiology Tree app to read full this article<
Real Clinical Studies
Get Radiology Tree app to read full this article<
Get Radiology Tree app to read full this article<
Get Radiology Tree app to read full this article<
Get Radiology Tree app to read full this article<
Get Radiology Tree app to read full this article<
Discussion
Get Radiology Tree app to read full this article<
Get Radiology Tree app to read full this article<
Get Radiology Tree app to read full this article<
Get Radiology Tree app to read full this article<
Get Radiology Tree app to read full this article<
Get Radiology Tree app to read full this article<
Get Radiology Tree app to read full this article<
Get Radiology Tree app to read full this article<
Acknowledgment
Get Radiology Tree app to read full this article<
References
1. Wagner R.F., Metz C.E., Campbell G.: Assessment of medical imaging systems and computer aids: a tutorial review. Acad Radiol 2007; 14: pp. 723-748.
2. Obuchowski N.A.: Multi-reader ROC Studies: A comparison of study designs. Acad Radiol 1995; 2: pp. 709-716.
3. Obuchowski N.A.: Multi-reader multi-modality ROC studies: hypothesis testing and sample size estimation using an ANOVA approach with dependent observations. Acad Radiol 1995; 2: pp. S22-S29.
4. Zhou X.H., Obuchowski N.A., McClish D.L.: Statistical methods in diagnostic medicine.2002.Wiley and Sons, IncNew York
5. Hillis S.L., Obuchowski N.A., Schartz K.M., et. al.: A comparison of the Dorfman-Berbaum-Metz and Obuchowski-Rockette methods for receiver operating characteristic (ROC) data. Stat Med 2005; 24: pp. 1579-1607.
6. Hillis S.L., Berbaum K.S.: Power estimation for the Dorfman-Berbaum-Metz method. Acad Radiol 2004; 11: pp. 1260-1273.
7. Hillis S.L.: A comparison of denominator degrees of freedom methods for multiple observer ROC analysis. Stat Med 2007; 26: pp. 596-619.
8. Obuchowski N.A., Beiden S.V., Berbaum K.S., et. al.: Multireader, multicase receiver operating characteristic analysis: an empirical comparison of five methods. Acad Radiol 2004; 11: pp. 980-995.
9. Rao B.R., Bi J., Fung G., Salganicoff M., Obuchowski N., Naidich D.P.: Lung CAD: A clinically approved, machine learning system for lung cancer detection.2007.pp. 1033-1037. Proc 13th ACM SIGKDD Int Conf on Knowledge Discovery and Data Mining, San Jose, CA.
10. Rockette H.E., Campbell W.L., Britton C.A., et. al.: Empiric assessment of parameters that affect the design of multiobserver receiver operating characteristic studies. Acad Radiol 1999; 6: pp. 723-729.
11. Dorfman D.D., Berbaum K.S., Metz C.E.: Receiver operating characteristic rating analysis: generalization to the population of readers and patients with the jackknife method. Invest Radiol 1992; 27: pp. 723-731.
12. Toledano A.Y., Gatsonis C.: Ordinal regression methodology for ROC curves derived from correlated data. Stat Med 1996; 15: pp. 1807-1826.
13. Obuchowski N.A., Rockette H.E.: Hypothesis testing of the diagnostic accuracy for multiple diagnostic tests: an ANOVA approach with dependent observations. Commun Stat Simulation Comput 1995; 24: pp. 285-308.
14. Song H.H.: Analysis of correlated ROC areas in diagnostic testing. Biometrics 1997; 53: pp. 370-382.
15. Beiden S.V., Wagner R.F., Campbell G.: Components-of-variance models and multiple-bootstrap experiments: an alternative method for random-effects, receiver operating characteristic analysis. Acad Radiol 2000; 7: pp. 341-349.
16. Ishwaran H., Gatsonis C.A.: A general class of hierarchical ordinal regression models with applications to correlated ROC analysis. Can J Stat 2000; 28: pp. 731-750.
17. Beiden S.V., Wagner R.F., Campbell G., et. al.: Components-of-variance models for random-effects ROC analysis: the case of unequal variance structure across modalities. Acad Radiol 2001; 8: pp. 605-615.
18. Beiden S.V., Wagner R.F., Campbell G., et. al.: Analysis of uncertainties in estimates of components of variance in multivariate ROC analysis. Acad Radiol 2001; 8: pp. 616-622.