
Rationale and Objectives
In cardiovascular computed tomography (CT), thin collimation results in a large number of images per examination. Moreover, interpretation relies on multiplanar reformatted images.
Materials and Methods
Although many strategies for approaching cardiac reformations have been described, as CT use increases, so does the importance of simple and reproducible postprocessing algorithms. The clinical importance of reformations has recently extended beyond the left ventricle to include the right ventricular in patients with pulmonary embolism.
Results
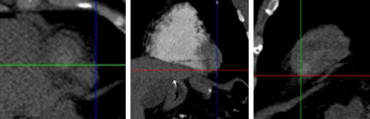
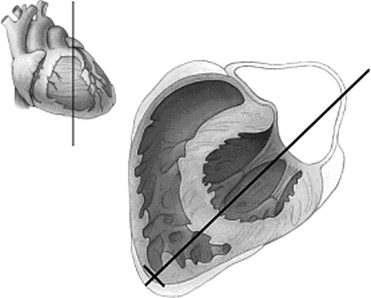
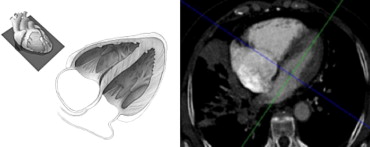
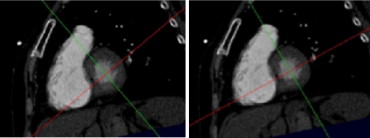
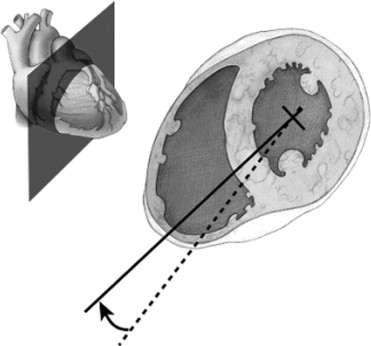
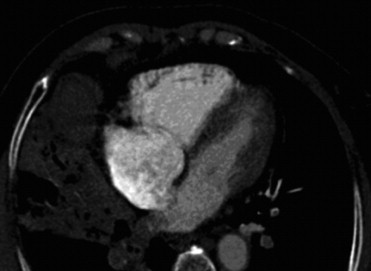
This work illustrates an algorithm to reformat two of the most important views in cardiovascular CT: the four-chamber and short axis views.
Conclusions
The illustration is performed in the context of two cardiovascular examinations: cardiac CT and CT pulmonary angiography.
Utilization of multidetector computed tomography (CT) for cardiovascular applications continues to increase. Robust electrocardiogram (ECG)-gated protocols are being used with increased frequency for assessment of coronary stenoses, so called “coronary CT angiography (CTA).” Because CT is acquired throughout the R-R interval, the size and function of the left ventricle can be evaluated with reformatted images viewed as a cine loop throughout the cardiac cycle ( ). The evaluation of pulmonary embolism (PE) represents another important use of CTA in CV imaging. In addition to the fact that CTA is a primary method to diagnose pulmonary embolism (PE), recent work suggests that prognostic information can be obtained by evaluating the size of the right ventricle ( ). Using multiplanar reformatted images to assess the size of the right ventricle has been proposed as a tool to help determine patient prognosis ( ).
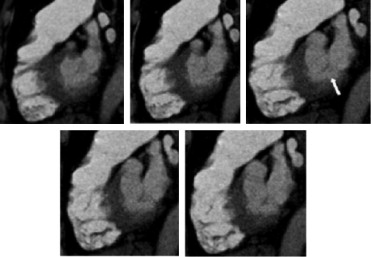
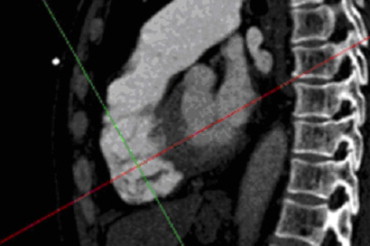
With respect to image acquisition and reconstruction, thin collimation is a common theme for both coronary CTA and CT pulmonary angiography (CTPA). The resulting thin axial slices serve as the primary dataset from which reformatted views are obtained, despite the fact that the contrast-enhanced CT protocol for the detection of PE and the evaluation of coronary stenosis differ with regard to many factors including the contrast bolus timing, the use of ECG gating, the volume of contrast material, and the detector collimation. The details of the image acquisition for each specific vendor are beyond the scope of this work, but, as an example, at our institution ECG-gated coronary CTA is performed using a 64-slice system with 0.6-mm detector collimation. The axial slices for evaluation of the coronary arterial tree have a reconstruction interval of 0.4 mm. To assess the left ventricle, additional 2-mm thick images are reconstructed over 10 equally spaced phases (0%–90%) in the cardiac cycle. Additional phases (eg, 20 reconstructions at 5% intervals) could be performed and may be important in newer generation CT systems with temporal resolutions under 100 milliseconds. In our experience, the 2-mm thick images give good signal and do not overwhelm the three-dimensional image postprocessing hardware/software. For each patient, the four-chamber and short-axis views are reformatted. The short-axis view is used to compute left ventricular ejection fraction ( ), and a cine of the ten phases of the 4-chamber view is used as an overview (with short-axis views) for ventricular global and regional wall motion ( ). It is important to note that additional cardiac axes can be used to depict specific pathology (eg, the three-chamber view for evaluating mitral valve prolapse) ( ), but the present article is designed to give the radiologist who is just beginning the practice of cardiovascular CT a primer for those images that are required in a complete evaluation in every patient.
Get Radiology Tree app to read full this article<
Get Radiology Tree app to read full this article<
Get Radiology Tree app to read full this article<
Get Radiology Tree app to read full this article<
Algorithm
Get Radiology Tree app to read full this article<
Get Radiology Tree app to read full this article<
Get Radiology Tree app to read full this article<
Get Radiology Tree app to read full this article<
Get Radiology Tree app to read full this article<
Get Radiology Tree app to read full this article<
Get Radiology Tree app to read full this article<
Get Radiology Tree app to read full this article<
Get Radiology Tree app to read full this article<
Discussion
Get Radiology Tree app to read full this article<
Get Radiology Tree app to read full this article<
References
1. Juergens K.U., Grude M., Fallenberg E.M., et. al.: Using ECG-gated multidetector CT to evaluate global left ventricular myocardial function in patients with coronary artery disease. AJR Am J Roentgenol 2002; 179: pp. 1545-1550.
2. Juergens K.U., Fischbach R.: Left ventricular function studied with MDCT. Eur Radiol 2006; 16: pp. 342-357.
3. Ghaye B., Ghuysen A., Willems V., et. al.: Severe pulmonary embolism: pulmonary artery clot load scores and cardiovascular parameters as predictors of mortality. Radiology 2006; 239: pp. 884-891.
4. Ghaye B., Ghuysen A., Bruyere P.J., et. al.: Can CT pulmonary angiography allow assessment of severity and prognosis in patients presenting with pulmonary embolism?. Radiographics 2006; 26: pp. 23-40.
5. van der Meer R.W., Pattynama P.M., van Strijen M.J., et. al.: Right ventricular dysfunction and pulmonary obstruction index at helical CT: prediction of clinical outcome during 3-month follow-up in patients with acute pulmonary embolism. Radiology 2005; 235: pp. 798-803.
6. Schoepf U.J., Kucher N., Kipfmueller F., et. al.: Right ventricular enlargement on chest computed tomography: a predictor of early death in acute pulmonary embolism. Circulation 2004; 110: pp. 3276-3280.
7. Quiroz R., Kucher N., Schoepf U.J., et. al.: Right ventricular enlargement on chest computed tomography: prognostic role in acute pulmonary embolism. Circulation 2004; 109: pp. 2401-2404.
8. Messroghli D.R., Bainbridge G.J., Alfakih K., et. al.: Assessment of regional left ventricular function: accuracy and reproducibility of positioning standard short-axis sections in cardiac MR imaging. Radiology 2005; 235: pp. 229-236.
9. Cerqueira M.D., Weissman N.J., Dilsizian V., et. al.: Standardized myocardial segmentation and nomenclature for tomographic imaging of the heart: a statement for healthcare professionals from the Cardiac Imaging Committee of the Council on Clinical Cardiology of the American Heart Association. Circulation 2002; 105: pp. 539-542.
10. Schoepf U.J., Costello P.: CT angiography for diagnosis of pulmonary embolism: state of the art. Radiology 2004; 230: pp. 329-337.
11. Boxt L.M.: Cardiac MR imaging: a guide for the beginner. Radiographics 1999; 19: pp. 1009-1026.
12. Mahnken A.H., Henschmi M., Ruettner A.: Functional cardiac imaging.Bruening R.Kuettner A.Flohr T.Protocols for multislice CT.2006.Springer-VerlagBerlin, Germany:pp. 173-175.
13. Assessment of left ventricular function.de Feyter P.J.Krestin G.P.Computed tomography of the coronary arteries.2005.Taylor and FrancisLondon:pp. 153-156.
14. van der Vleuten P.A., Willems T.P., Gotte M.J., et. al.: Quantification of global left ventricular function: comparison of multidetector computed tomography and magnetic resonance imaging: a meta-analysis and review of the current literature. Acta Radiol 2006; 47: pp. 1049-1057.