
Rationale and Objectives
To determine lobar ventilation patterns in asthmatic lungs with hyperpolarized 3 He magnetic resonance imaging (HP 3 He MRI).
Materials and Methods
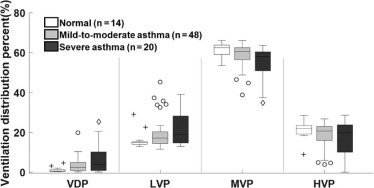
Eighty-two subjects (14 normal, 48 mild-to-moderate asthma, and 20 severe asthma) underwent HP 3 He MRI, computed tomography (CT), and pulmonary function testing. After registering proton to 3 He images, we segmented the lungs from proton MRI and further segmented the five lung lobes (right upper lobe [RUL], right middle lobe [RML], and right lower lobe [RLL]; left upper lobe and left lower lobe [LLL]) by referring to the lobar segmentation from CT. We classified the gas volume into four signal intensity levels as follows: ventilation defect percent (VDP), low ventilation percent, medium ventilation percent, and high ventilation percent. The local signal intensity variations in the ventilated volume were estimated using heterogeneity score (Hs). We compared each ventilation level and Hs measured in the whole lung and lobar regions across the three subject groups.
Results
In mild-to-moderate asthma, the RML and RUL showed significantly greater VDP than the two lower lobes (RLL and LLL) ( P ≤ .047). In severe asthma, the pattern was more variable with the VDP in the RUL significantly greater than in the RLL ( P = .026). In both asthma groups, the lower lobes (RLL and LLL) showed significantly higher high ventilation percent and Hs compared to the three upper lobes (all P ≤ .015).
Conclusions
In asthma, the RML and RUL showed greater ventilation abnormalities, and the RLL and LLL were more highly ventilated with greater local heterogeneity. These findings may facilitate guided bronchoscopic sampling and localized airway treatment in future studies.
Introduction
Asthma is a chronic disease characterized by airway narrowing that leads to symptoms of wheezing, chest tightness, cough, and difficulty breathing. These symptoms result from underlying chronic inflammatory processes that render the airways hyper-responsive to perturbations that in normal airways would evoke a negligible response . The heterogeneity of airway obstruction is now well accepted, suggesting localized disease processes including persistent and reversible regions of obstruction, both of which have been visualized using functional imaging methods .
Computed tomography (CT) imaging has been used to characterize regions of airway thickening and regions of low parenchymal density at expiratory lung volume to identify air trapping . Independently, hyperpolarized helium-3 (HP 3 He) magnetic resonance imaging (MRI) has demonstrated regions of lower than normal ventilation termed “ventilation defects” in asthma. Regional ventilation abnormalities have also been associated with airway disease including airway narrowing , air trapping, and inflammation . HP 3 He MRI and CT have been used in combination to compare structure-function associations between anatomical markers of airway remodeling and ventilation defects . Such regionally specific approaches show promise for better characterizing regional ventilation heterogeneity in asthma generally as well as localized therapy, for example, bronchial thermoplasty .
Get Radiology Tree app to read full this article<
Get Radiology Tree app to read full this article<
Get Radiology Tree app to read full this article<
Materials and Methods
Human Subjects
Get Radiology Tree app to read full this article<
Magnetic Resonance Imaging
Get Radiology Tree app to read full this article<
Get Radiology Tree app to read full this article<
Get Radiology Tree app to read full this article<
Get Radiology Tree app to read full this article<
Multidetector Computed Tomography
Get Radiology Tree app to read full this article<
Pulmonary Function Testing
Get Radiology Tree app to read full this article<
Image Analysis
Get Radiology Tree app to read full this article<
Get Radiology Tree app to read full this article<
Get Radiology Tree app to read full this article<
Get Radiology Tree app to read full this article<
Get Radiology Tree app to read full this article<
Get Radiology Tree app to read full this article<
Statistical Analyses
Get Radiology Tree app to read full this article<
Get Radiology Tree app to read full this article<
Results
Get Radiology Tree app to read full this article<
TABLE 1
Subject Demographics and Global Functional Measurements for Normal and Asthmatic Subjects
Asthma Significance of Difference ( P value) Normal (N = 14) Mild-to-Moderate (N = 48) Severe (N = 20) Normal vs Mild-to-Moderate Normal vs Severe Mild-to-Moderate vs Severe Age (y) 21 ± 3 31 ± 12 38 ± 14 .026 .0005 .095 Men/Women 5/9 22/26 7/13 — — — FEV 1 PP (%) 102 ± 12 89 ± 14 79 ± 19 .0014 .0002 .058 FEV 1 /FVC PP (%) 100 ± 6 89 ± 10 87 ± 15 .0050 .0039 .79 Whole-lung VDP (%) 1.2 ± 1.3 3.4 ± 3.6 6.5 ± 7.3 .23 .0034 .033 Whole-lung LVP (%) 16.1 ± 4.4 19.1 ± 7.3 21.6 ± 8.8 .37 .087 .42 Whole-lung MVP (%) 61.6 ± 3.4 58.9 ± 5.6 54.9 ± 8.3 .27 .0062 .042 Whole-lung HVP (%) 21.1 ± 4.5 18.6 ± 6.2 17.0 ± 8.4 — — — Heterogeneity score (–) 0.24 ± 0.029 0.24 ± 0.030 0.27 ± 0.043 .91 .034 .014
FEV 1 PP, percent predicted forced expiratory volume in 1 second; FVC, forced vital capacity; HVP, high ventilation percent; LVP, low ventilation percent; MVP, moderate ventilation percent; VDP, ventilation defect percent.
Values are expressed as mean ± standard deviation. A P < .05 was considered significant. The pairwise comparison was performed and reported only if the global effect of one-way analysis of variance was confirmed to be significantly different.
Get Radiology Tree app to read full this article<
Lobar Measurements and Comparison
Get Radiology Tree app to read full this article<
![Figure 1, Glyph charts of average lobar ventilation defect percent (VDP) in the normal group (left), mild-to-moderate asthma (middle), and severe asthma (right). The shaded regions in light colors (right upper lobe [RUL] in green, right middle lobe [RML] in yellow, right lower lobe [RLL] in cyan, left upper lobe [LUL] in magenta, left lower lobe [LLL] in red) represent the volume of each lobe as a percentage of total lung volume. The shaded regions in the corresponding bold colors represent the average VDP values of individual lobes in a subject group. In each glyph chart, the symbols *, #, and § denote significant differences found in the other lobes compared to the RUL, RML, and LUL, respectively. A P < .05 was considered significant.](https://storage.googleapis.com/dl.dentistrykey.com/clinical/RegionalHeterogeneityofLobarVentilationinAsthmaUsingHyperpolarizedHelium3MRI/0_1s20S1076633217304075.jpg)
![Figure 2, Bar graphs of ( a ) high ventilation percent (HVP) and ( b ) heterogeneity score (Hs) in lung lobes with error bars representing standard deviation. The lobar HVP showed the lower lobes (right lower lobe [RLL] and left lower lobe [LLL]) contained more highly ventilated regions relative to the upper lobes in the two asthma groups. The lobar Hs suggested the two lower lobes had more heterogeneity relative to the upper lobes (right middle lobe [RML], right upper lobe [RUL], and left upper lobe [LUL]). In each bar graph, the symbols *, #, and § denote significantly differences found in the other lobes compared to the RUL, RML, and LUL, respectively. A P < .05 was considered significant.](https://storage.googleapis.com/dl.dentistrykey.com/clinical/RegionalHeterogeneityofLobarVentilationinAsthmaUsingHyperpolarizedHelium3MRI/1_1s20S1076633217304075.jpg)
Get Radiology Tree app to read full this article<
Get Radiology Tree app to read full this article<
Get Radiology Tree app to read full this article<
Get Radiology Tree app to read full this article<
Global Measurements and Comparison
Get Radiology Tree app to read full this article<
TABLE 2
Spearman Correlation Between VDP and Other Global Measures Including FEV 1 PP and FEV 1 /FVC PP from Spirometry and Heterogeneity Score
Spearman Correlation_ρ__P_ 95% Confidence Interval VDP vs FEV 1 PP −0.38 .0005 [−0.55, −0.17] VDP vs FEV 1 /FVC PP −0.42 <.0001 [−0.58, −0.22] VDP vs Heterogeneity score 0.68 <.0001 [0.54, 0.78]
FEV 1 PP, percent predicted forced expiratory volume in 1 second; FVC, forced vital capacity; VDP, ventilation defect percent.
A P < .05 was considered significant.
Get Radiology Tree app to read full this article<
Get Radiology Tree app to read full this article<
![Figure 4, Examples of segmented defects and the corresponding ventilation maps at apical, middle, and basal slices of three subjects. Columns from left to right show apical, middle, and basal lung slices of a subject. Rows a, d, and g show the segmented defects (right upper lobe [RUL] in green, right middle lobe [RML] in yellow, right lower lobe [RLL] in cyan, left upper lobe [LUL] in magenta, left lower lobe [LLL] in red) in a normal subject, mild-to-moderate asthma, and severe asthma respectively. Rows b, e, and h show the corresponding ventilation maps, which contain four ventilation levels: ventilation defect percent (VDP) in red, low ventilation percent (LVP) in orange, medium ventilation percent (MVP) in green, and high ventilation percent (HVP) in blue, at the same slices of the same normal, mild-to-moderate, and severe asthmatic subjects. Rows c, f, and i display the corresponding heterogeneity maps. Normal: 21-year-old man, percent predicted forced expiratory volume in 1 second (FEV 1 PP) = 90%, VDP = 0.5%, LVP = 14.7%, MVP = 63.1%, and HVP = 21.7%, heterogeneity score = 0.20. Mild-to-moderate asthmatic: 19-year-old man, FEV 1 PP = 72%, VDP = 2.7%, LVP = 15.5%, MVP = 60.2%, and HVP = 21.6%, heterogeneity score = 0.24. Severe asthmatic: 53-year-old man, FEV 1 PP = 86%, VDP = 9.5%, LVP = 34.7%, MVP = 49.2%, HVP = 6.7%, heterogeneity score = 0.31.](https://storage.googleapis.com/dl.dentistrykey.com/clinical/RegionalHeterogeneityofLobarVentilationinAsthmaUsingHyperpolarizedHelium3MRI/3_1s20S1076633217304075.jpg)
Get Radiology Tree app to read full this article<
Anterior/Posterior Gradient
Get Radiology Tree app to read full this article<
Get Radiology Tree app to read full this article<
Discussion
Get Radiology Tree app to read full this article<
Get Radiology Tree app to read full this article<
Get Radiology Tree app to read full this article<
Get Radiology Tree app to read full this article<
Get Radiology Tree app to read full this article<
Get Radiology Tree app to read full this article<
Get Radiology Tree app to read full this article<
Get Radiology Tree app to read full this article<
Get Radiology Tree app to read full this article<
Acknowledgments
Get Radiology Tree app to read full this article<
Get Radiology Tree app to read full this article<
Appendix
Get Radiology Tree app to read full this article<
Get Radiology Tree app to read full this article<
Get Radiology Tree app to read full this article<
References
1. Sears M.R.: Predicting asthma outcomes. J Allergy Clin Immunol 2015; 136: pp. 829-836. quiz 837
2. Samee S., Altes T., Powers P., et. al.: Imaging the lungs in asthmatic patients by using hyperpolarized helium-3 magnetic resonance: assessment of response to methacholine and exercise challenge. J Allergy Clin Immunol 2003; 111: pp. 1205-1211.
3. Tgavalekos N.T., Musch G., Harris R.S., et. al.: Relationship between airway narrowing, patchy ventilation and lung mechanics in asthmatics. Eur Respir J 2007; 29: pp. 1174-1181.
4. Aysola R.S., Hoffman E.A., Gierada D., et. al.: Airway remodeling measured by multidetector CT is increased in severe asthma and correlates with pathology. Chest 2008; 134: pp. 1183-1191.
5. Busacker A., Newell J.D.J., Keefe T., et. al.: A multivariate analysis of risk factors for the air-trapping asthmatic phenotype as measured by quantitative CT analysis. Chest 2009; 135: pp. 48-56.
6. Fain S.B., Gonzalez-Fernandez G., Peterson E.T., et. al.: Evaluation of structure-function relationships in asthma using multidetector CT and hyperpolarized He-3 MRI. Acad Radiol 2008; 15: pp. 753-762.
7. de Lange E.E., Altes T.A., Patrie J.T., et. al.: Evaluation of asthma with hyperpolarized helium-3 MRI: correlation with clinical severity and spirometry. Chest 2006; 130: pp. 1055-1062.
8. Bergeron C., Al-ramli W., Hamid Q.: Remodeling in asthma. Proc Am Thorac Soc 2009; 6: pp. 301-305.
9. Svenningsen S., Kirby M., Starr D., et. al.: What are ventilation defects in asthma?. Thorax 2014; 69: pp. 63-71.
10. Chae E.J., Seo J.B., Lee J., et. al.: Xenon ventilation imaging using dual-energy computed tomography in asthmatics: initial experience. Invest Radiol 2010; 45: pp. 354-361.
11. Niles D.J., Kruger S.J., Dardzinski B.J., et. al.: Exercise-induced bronchoconstriction: reproducibility of hyperpolarized 3He MR imaging. Radiology 2013; 266: pp. 618-625.
12. Thomen R.P., Sheshadri A., Quirk J.D., et. al.: Regional ventilation changes in severe asthma after bronchial thermoplasty with (3)He MR imaging and CT. Radiology 2015; 274: pp. 250-259.
13. Woodhouse N., Wild J.M., Paley M.N.J., et. al.: Combined helium-3/proton magnetic resonance imaging measurement of ventilated lung volumes in smokers compared to never-smokers. J Magn Reson Imaging 2005; 21: pp. 365-369.
14. Davis C., Sheikh K., Pike D., et. al.: Ventilation heterogeneity in never-smokers and COPD: comparison of pulmonary functional magnetic resonance imaging with the poorly communicating fraction derived from plethysmography. Acad Radiol 2016; 23: pp. 398-405.
15. Kohlmann P., Strehlow J., Jobst B., et. al.: Automatic lung segmentation method for MRI-based lung perfusion studies of patients with chronic obstructive pulmonary disease. Int J Comput Assist Radiol Surg 2015; 10: pp. 403-417.
16. Kirby M., Heydarian M., Svenningsen S., et. al.: Hyperpolarized 3He magnetic resonance functional imaging semiautomated segmentation. Acad Radiol 2012; 19: pp. 141-152.
17. Zha W., Niles D.J., Kruger S.J., et. al.: Semiautomated ventilation defect quantification in exercise-induced bronchoconstriction using hyperpolarized helium-3 magnetic resonance imaging: a repeatability study. Acad Radiol 2016; 23: pp. 1104-1114.
18. He M., Kaushik S.S., Robertson S.H., et. al.: Extending semiautomatic ventilation defect analysis for hyperpolarized 129Xe ventilation MRI. Acad Radiol 2014; 21: pp. 1530-1541.
19. Tzeng Y.-S., Lutchen K., Albert M.: The difference in ventilation heterogeneity between asthmatic and healthy subjects quantified using hyperpolarized 3He MRI. J Appl Physiol 2009; 106: pp. 813-822.
20. Svenningsen S., Kirby M., Starr D., et. al.: Hyperpolarized 3He and 129Xe MRI: differences in asthma before bronchodilation. J Magn Reson Imaging 2013; 38: pp. 1521-1530.
21. Kruger S.J., Niles D.J., Dardzinski B., et. al.: Hyperpolarized Helium-3 MRI of exercise-induced bronchoconstriction during challenge and therapy. J Magn Reson Imaging 2014; 39: pp. 1230-1237.
22. Van Holsbeke C., Ireland R.H., Swift A.J., et. al.: Comparison of CT-based lobar ventilation with 3He MR imaging ventilation measurements. Radiology 2016; 278: pp. 585-592.
23. Pike D., Kirby M., Eddy R.L., et. al.: Regional heterogeneity of chronic obstructive pulmonary disease phenotypes: pulmonary 3He magnetic resonance imaging and computed tomography. COPD 2016; pp. 1-9.
24. Pike D., Kirby M., Guo F., et. al.: Ventilation heterogeneity in ex-smokers without airflow limitation. Acad Radiol 2015; 22: pp. 1068-1078.
25. Jarjour N.N., Erzurum S.C., Bleecker E.R., et. al.: Severe asthma: lessons learned from the National Heart, Lung, and Blood Institute Severe Asthma Research Program. Am J Respir Crit Care Med 2012; 185: pp. 356-362.
26. Miller M.R., Hankinson J., Brusasco V., et. al.: Standardisation of spirometry. Eur Respir J 2005; 26: pp. 319-338.
27. Hankinson J.L., Odencrantz J.R., Fedan K.B.: Spirometric reference values from a sample of the general U.S. population. Am J Respir Crit Care Med 1999; 159: pp. 179-187.
28. Mentore K., Froh D.K., De Lange E.E., et. al.: Hyperpolarized He 3 MRI of the lung in cystic fibrosis: assessment at baseline and after bronchodilator and airway clearance treatment. Acad Radiol 2005; 12: pp. 1423-1429.
29. Kirby M., Pike D., Coxson H.O., et. al.: Hyperpolarized (3)He ventilation defects used to predict pulmonary exacerbations in mild to moderate chronic obstructive pulmonary disease. Radiology 2014; 273: pp. 887-896.
30. Svenningsen S., Nair P., Guo F., et. al.: Is ventilation heterogeneity related to asthma control?. Eur Respir J 2016; 48: pp. 370-379.
31. Choy S., Wheatley A., McCormack D.G., et. al.: Hyperpolarized (3)He magnetic resonance imaging-derived pulmonary pressure-volume curves. J Appl Physiol 2010; 109: pp. 574-585.
32. Hahn A.D., Cadman R., Sorkness R.L., et. al.: Redistribution of inhaled hyperpolarized 3He gas during breath-hold differs by asthma severity. J Appl Physiol 2016; 120: pp. 526-536.
33. Witt C.A., Sheshadri A., Carlstrom L., et. al.: Longitudinal changes in airway remodeling and air trapping in severe asthma. Acad Radiol 2014; 21: pp. 986-993.