
Rationale and Objectives
Pulmonary vascular control mechanisms are complex and likely to differ between species. We wish to quantify regional perfusion and the effects of gravity using computed tomography.
Materials and Methods
Sequential density measurements following the administration of a bolus of iodinated contrast medium were acquired from four healthy human subjects and four dogs.
Results
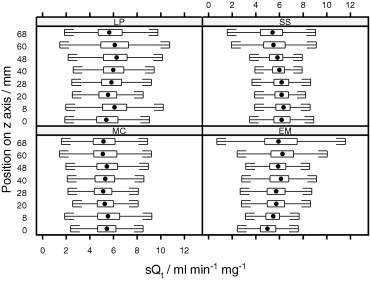
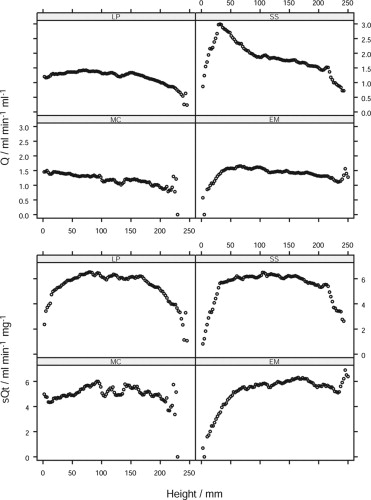
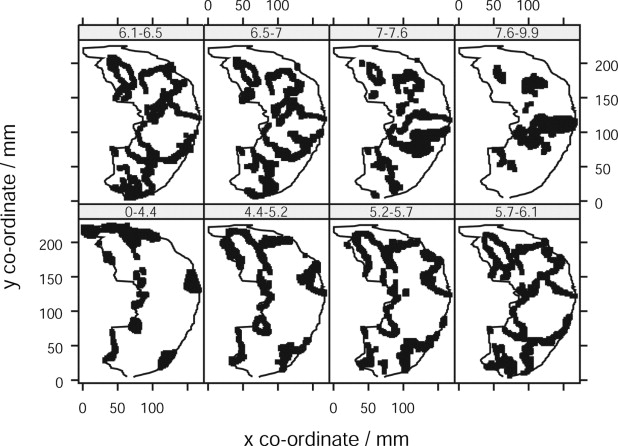
In humans, perfusion (Q) was linear throughout most of the range of vertical height, with an overall gradient of −2.6% cm −1 . However, when perfusion was normalized to “tissue” density (blood plus tissue: sQ t ), maximum perfusion occurred around the mid-range of vertical height, being 9% (range 1–22%) greater than either the dorsal or ventral extreme. Within discrete transverse axial sections, concentric zones of perfusion centered on blood vessels were demonstrated. The relationship between sQ t and vertical height in dogs was distinctly linear, with a gradient of −7.2% cm −1 . In dogs, the median gradient of Q was −13.6% cm −1 (range −9.7 to −17.1%).
Conclusions
Differences in regional pulmonary perfusion, particularly the vertical gradient observed in humans and dogs, may in part reflect anatomic differences between the symmetric dichotomous branching structure of the human pulmonary vasculature and the more asymmetrical structure found in dogs.
The mechanisms that regulate pulmonary vascular control are poorly understood, but assume therapeutic significance in patients with clinical conditions characterized by ventilation perfusion (V/Q) mismatch, such as pulmonary embolism and the acute respiratory distress syndrome. Regional pulmonary perfusion has been studied using radioactive tracers ( ), positron emission tomography (PET) ( ), single positron emission computed tomography ( ), and magnetic resonance imaging ( ). Computed tomography (CT), despite its superior spatial resolution and shorter acquisition times, has not been as fully explored ( ). Previous studies of pulmonary perfusion in humans using CT have been limited to discrete sampling at defined regions of interest (ROIs), and revealed increased perfusion to dependent lung regions ( ), but were not analyzed on a pixel-by-pixel basis. The aims of this study were twofold. First, using four-dimensional CT, regional pulmonary perfusion was characterized in conscious, normal human subjects, to identify the effect of gravity on perfusion gradients in the normal lung. Second, previously acquired data from dogs using the same methodology ( ) were reanalyzed using the technical modifications necessary in human subjects. This allowed interspecies comparisons to identify differences that might relate to the different vascular branching patterns in the two species. Quadrupeds have been used extensively to study pulmonary perfusion, and inference has been drawn to perfusion in humans, although equivalence of their pulmonary physiology has not been demonstrated.
Materials and methods
Study Subjects
Volunteer studies were performed in six male human subjects between the ages of 30 and 48 years) at the Royal Brompton Hospital, London, UK. All subjects were nonsmokers and self-reported to be healthy. Males were chosen to avoid exposure of breast tissue to radiation. The protocol was approved by local institutional board review, and all subjects provided informed written consent. All animal studies were performed within guidelines for animal care stipulated by the American Physiological Society and the National Institutes of Health. Dogs evaluated in this study are reported in Chon et al and preparation details are provided in that study ( ). Studies were approved by the University of Pennsylvania Institutional Animal Care and Use Committee.
Study Design
Get Radiology Tree app to read full this article<
Get Radiology Tree app to read full this article<
flowvolume=ΔHU1AUCa flow
volume
=
Δ
HU
1
AUC
a
where ΔHU t = the difference between baseline and peak density in the tissue ROI (HU) and AUC a = the area under the time attenuation curve of the feeding vessel (HU). Thus, perfusion is measured as blood flow per unit voxel, and is independent of the volume of the ROI sampled. This method assumes negligible contrast washout from the parenchymal ROI before peak opacification ( ).
Get Radiology Tree app to read full this article<
Get Radiology Tree app to read full this article<
Methods
Scanning Protocol
Get Radiology Tree app to read full this article<
Volunteers
Get Radiology Tree app to read full this article<
Get Radiology Tree app to read full this article<
Animals
Get Radiology Tree app to read full this article<
Data Analysis
Get Radiology Tree app to read full this article<
Get Radiology Tree app to read full this article<
Sampling
Get Radiology Tree app to read full this article<
Animal Studies
Get Radiology Tree app to read full this article<
Humans
Get Radiology Tree app to read full this article<
Filtering
Get Radiology Tree app to read full this article<
Get Radiology Tree app to read full this article<
Statistical Analysis
Get Radiology Tree app to read full this article<
Results
Volunteers
Get Radiology Tree app to read full this article<
Table 1
Subject Demographic Data
MC EM LP SS Mean Age (y) 30 33 35 30 34 Mass (kg) 73 89 76 81 82 Height (m) 1.82 1.83 1.68 1.83 1.81
Get Radiology Tree app to read full this article<
Get Radiology Tree app to read full this article<
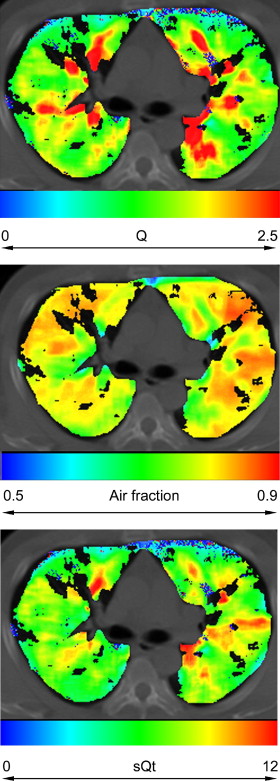
Table 2
Radiologic and Physiologic Parameters
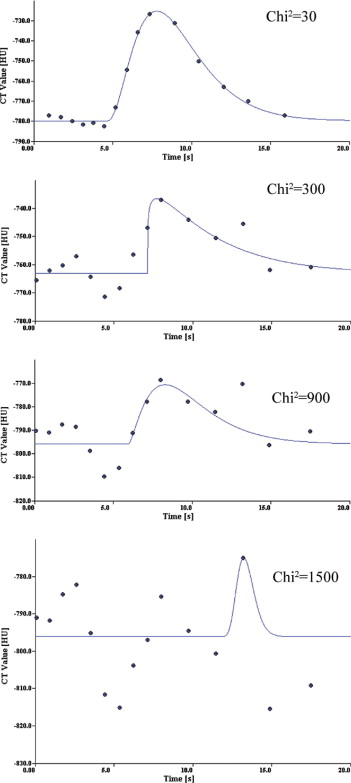
Human Dog Adjacent Grid Overlapping Grid_N_ 76,515 2,163 60,503 Baseline −745 −663 −665 Opacification 37 123 124 Chi-squared 83 139 136 MTT 0.3 6.1 −91.2 Rise time 3.3 2.1 2 F air 0.75 0.66 0.67 Q 1.5 2.4 2.4 sQ t 5.6 6.8 6.6
n , number of gamma variate fits; baseline, baseline attenuation before opacification with contrast (Hounsfield units); opacification, difference between baseline and peak attenuation during opacification (Hounsfield units); chi-squared, goodness of fit of gamma variate to tissue opacification/time curve; MTT, mean transit time of contrast bolus in tissue ROI; rise time, time of arrival of contrast bolus in tissue ROI; F air , air fractional content of tissue ROI; Q, perfusion; sQ t m, perfusion normalized to “water” fraction; ROI, region of interest.
Data are intersubject means of radiologic and physiologic parameters.
Get Radiology Tree app to read full this article<
Get Radiology Tree app to read full this article<
Get Radiology Tree app to read full this article<
Get Radiology Tree app to read full this article<
Get Radiology Tree app to read full this article<
Dogs
Get Radiology Tree app to read full this article<
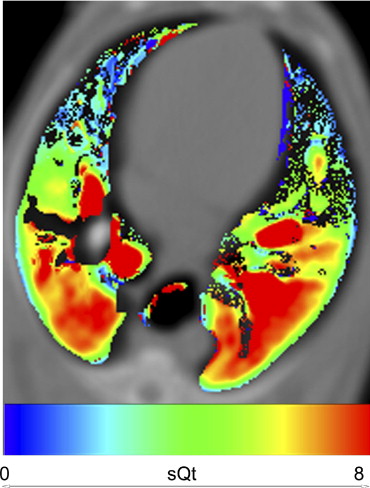
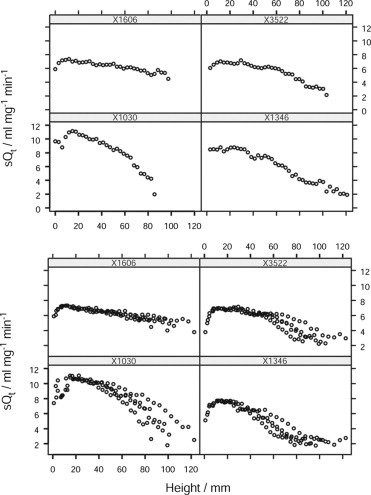
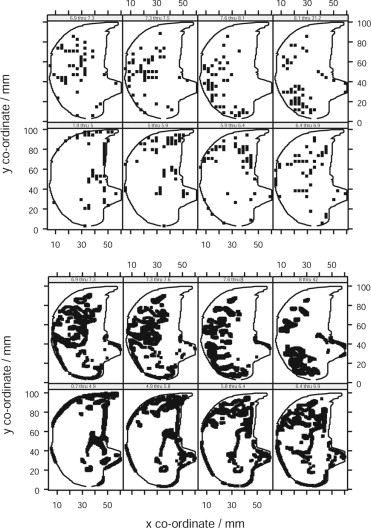
Table 3
Derived Parameters for Linear Regression of Q on Vertical Height for Dog Studies
Subject Intercept Gradient_r 2_P X1030 11.8 −9.1 0.76 0 X1346 9.9 −9.6 0.95 0 X1606 7.3 −3.2 0.75 <10 −5 X3522 7.8 −7.1 0.83 0 Median 8.85 −8.1 0.8 0
Get Radiology Tree app to read full this article<
Discussion
Get Radiology Tree app to read full this article<
Methodologic Considerations
Get Radiology Tree app to read full this article<
Regional Distribution of Perfusion
Get Radiology Tree app to read full this article<
Intraregional Distribution of Perfusion
Get Radiology Tree app to read full this article<
Get Radiology Tree app to read full this article<
Comparison of Human Data to Animal Species
Get Radiology Tree app to read full this article<
Get Radiology Tree app to read full this article<
Acknowledgments
Get Radiology Tree app to read full this article<
Get Radiology Tree app to read full this article<
References
1. Hughes J.M., Glazier J.B., Maloney J.E., et. al.: Effect of lung volume on the distribution of pulmonary blood flow in man. Respir Physiol 1968; 4: pp. 58-72.
2. Anthonisen N.R., Milic-Emili J.: Distribution of pulmonary perfusion in erect man. J Appl Physiol 1966; 21: pp. 760-766.
3. Kaneko K., Milic-Emili J., Dolovich M.B., et. al.: Regional distribution of ventilation and perfusion as a function of body position. J Appl Physiol 1966; 21: pp. 767-777.
4. Brudin L.H., Rhodes C.G., Valind S.O., et. al.: Relationships between regional ventilation and vascular and extravascular volume in supine humans. J Appl Physiol 1994; 76: pp. 1195-1204.
5. Brudin L.H., Rhodes C.G., Valind S.O., et. al.: Regional lung density and blood volume in nonsmoking and smoking subjects measured by PET. J Appl Physiol 1987; 63: pp. 1324-1334.
6. Sanchez-Crespo A., Petersson J., Nyren S., et. al.: A novel quantitative dual-isotope method for simultaneous ventilation and perfusion lung SPET. Eur J Nucl Med Mol Imaging 2002; 29: pp. 863-875.
7. Bajc M., Bitzen U., Olsson B., et. al.: Lung ventilation/perfusion SPECT in the artificially embolized pig. J Nucl Med 2002; 43: pp. 640-647.
8. Levin D.L., Chen Q., Zhang M., et. al.: Evaluation of regional pulmonary perfusion using ultrafast magnetic resonance imaging. Magn Reson Med 2001; 46: pp. 166-171.
9. Wolfkiel C.J., Rich S.: Analysis of regional pulmonary enhancement in dogs by ultrafast computed tomography. Invest Radiol 1992; 27: pp. 211-216.
10. Jones A.T., Hansell D.M., Evans T.W.: Pulmonary perfusion in supine and prone positions: an electron-beam computed tomography study. J Appl Physiol 2001; 90: pp. 1342-1348.
11. Chon D., Beck K.C., Larsen R.L., et. al.: Regional pulmonary blood flow in dogs by 4D-X-ray CT. J Appl Physiol 2006; 101: pp. 1451-1465.
12. Wu X., Latson L.A., Wang T., et. al.: Regional pulmonary perfusion estimated by high-speed volume scanning CT. Am J Physiol Imaging 1988; 3: pp. 73-80.
13. Wolfkiel C.J., Ferguson J.L., Chomka E.V., et. al.: Measurement of myocardial blood flow by ultrafast computed tomography. Circulation 1987; 76: pp. 1262-1273.
14. Jones A.T., Hansell D.M., Evans T.W.: Pulmonary perfusion quantified by electron-beam computed tomography: effects of hypoxia and inhaled NO. Eur Respir J 2003; 21: pp. 855-861.
15. Georgiou D., Wolfkiel C., Brundage B.H.: Ultrafast computed tomography for the physiological evaluation of myocardial perfusion. Am J Card Imaging 1994; 8: pp. 151-158.
16. Noble M.I., Eisele J.R., Frankel H.L., et. al.: The role of the diaphragm in the sensation of holding the breath. Clin Sci 1971; 41: pp. 275-283.
17. Reinhardt J., Guo J., Zhang M.: Integrated system for objective assessment of global and regional lung structure.Viergever M.Lecture notes in computer science.2001.Springer-VerlagUtrecht:pp. 1384-1385.
18. Hoffman E.A., Gnanaprakasam D., Gupta K.B., et. al.: VIDA: an environment for multi-dimensional image display and analysis. SPIE Proc Biomed Image Proc 3D Microsc 1992; 1660: pp. 694-711.
19. Won C., Chon D., Tajik J., et. al.: CT-based assessment of regional pulmonary microvascular blood flow parameters. J Appl Physiol 2003; 94: pp. 2483-2493.
20. Press W.H., Flannery B.P., Teukolsky S.A., et. al.: Numerical recipes: the art of scientific computing (Fortran version).1989.Cambridge University PressCambridge
21. Dakin J.: Quantification of pulmonary perfusion using electron beam computed tomography.2004.Imperial College LondonLondon:pp. 260.
22. Hulands G.H., Greene R., Iliff L.D., et. al.: Influence of anaesthesia on the regional distribution of perfusion and ventilation in the lung. Br J Anaesth 1969; 41: pp. 789-790.
23. Landmark S.J., Knopp T.J., Rehder K., et. al.: Regional pulmonary perfusion and V/Q in awake and anesthetized-paralyzed man. J Appl Physiol 1977; 43: pp. 993-1000.
24. Musch G., Layfield J.D., Harris R.S., et. al.: Topographical distribution of pulmonary perfusion and ventilation, assessed by PET in supine and prone humans. J Appl Physiol 2002; 93: pp. 1841-1851.
25. Brudin L.H., Rhodes C.G., Valind S.O., et. al.: Interrelationships between regional blood flow, blood volume, and ventilation in supine humans. J Appl Physiol 1994; 76: pp. 1205-1210.
26. Glenny R.W., Bernard S., Robertson H.T., et. al.: Gravity is an important but secondary determinant of regional pulmonary blood flow in upright primates. J Appl Physiol 1999; 86: pp. 623-632.
27. Weibel E.R.: Design of airways and blood vessels considered as branching trees.Crystal R.Barnes P.J.West J.B. et. al.The lung: scientific foundations.1997.Lippincott, Williams & WilkinsPhiladelphia, PA:pp. 1061-1071.
28. Glenny R.W.: Spatial correlation of regional pulmonary perfusion. J Appl Physiol 1992; 72: pp. 2378-2386.
29. Pattekar M.: Role of right ventricle in pulmonary blood flow distribution.1997.University of IowaIowa