
Rationale and Objectives
This study evaluated the performance of computed tomography (CT)-derived biomechanical based features of lung function and the presence and severity of chronic obstructive pulmonary disease (COPD). It performed well when compared to CT-derived density and textural features of lung function and the presence and severity of COPD.
Materials and Methods
A total of 162 subjects (Global Initiative for Chronic Obstructive Lung Disease [GOLD] stages 0–4 and nonsmokers) subjects with CT scan performed at total lung capacity or expiration to functional residual capacity were evaluated. CT-derived biomechanical, density, and textural feature sets were compared to forced expiratory volume in 1 second (FEV 1 )%, FEV 1 /forced vital capacity, and total St. George’s respiratory questionnaire scores. The ability of these feature sets to assess the presence and severity of COPD was also evaluated. Optimal features are selected by linear forward feature selection and the classification is done using k nearest neighbor learning algorithm.
Results
The proposed biomechanical features showed good correlations with the pulmonary function tests and health status metrics. In COPD versus non-COPD classification, biomechanical feature set achieved an area under the curve (AUC) of 0.85 performing well in comparison to density (AUC = 0.83) and texture (AUC = 0.89) feature sets. Classifying the subjects into the severity of GOLD stage using biomechanical features (AUC = 0.81) performed better than the density- and texture-based feature sets, AUC = 0.76 and 0.73, respectively. The biomechanical features performed better alone than in combination with the other two feature sets.
Conclusion
This study shows the effectiveness of CT-derived biomechanical measures in the assessment of airflow obstruction and quality of life in subjects with COPD. CT-derived biomechanical features performed well in assessing the presence and severity of COPD.
Chronic obstructive pulmonary disease (COPD), a growing health concern, is the fourth leading cause of death in the world . COPD is largely the result of inflammation produced by host response factors to smoking and inhaled environmental pollutants linked to combustion of various hydrocarbon-based fuels. The inflammation generated in the lung produces local and systemic effects. The lung responses include emphysema, large airway disease (chronic bronchitis), and small airway disease. The structural changes in the airways include remodeling of the airway wall that can produce a reduction in luminal diameter and thickening of the corresponding airway wall. Emphysema is defined as destruction of alveolar walls without significant fibrosis. This destruction of tissues includes the small airways, small arteries, capillaries, and small veins. Emphysema causes a decrease in lung elastic recoil. This in turn may disrupt the extracellular tissue support structure of airways in the lung, making the airways more prone to collapse. Emphysema also causes a marked decrease in the tissue surface-to-volume ratio in the lung, which greatly decreases the lungs efficiency in transporting oxygen and carbon dioxide gases. Although chronic smokers constitute the highest COPD-susceptible population in the United States, people worldwide who are exposed to indoor air pollution using biomass for heating and cooking as well as other environmental lung irritants form another major group of COPD patients . The current methods to diagnosis COPD include assessments of airflow using spirometry to measure forced expiratory volume in 1 second (FEV 1 ) and FEV 1 /forced vital capacity (FVC) ratio, and assessing the frequency of COPD exacerbations often associated with acute lung infections. The complexity of COPD is only recently being fully appreciated, with a growing awareness that measures of global airflow obstruction and frequency of exacerbations may not be sufficient to characterize the many disease processes that have traditionally been grouped together under the term COPD. There is great interest in using imaging to more fully characterize normal and diseased lung tissue in patients with COPD. The COPDGene, MESA Lung, and SPIROMICS multicenter National Institutes of Health-National Heart, Lung, and Blood Institutes–funded COPD research studies have included quantitative computed tomography (CT) imaging of the chest as a key element of the experimental design to study COPD-related lung diseases.
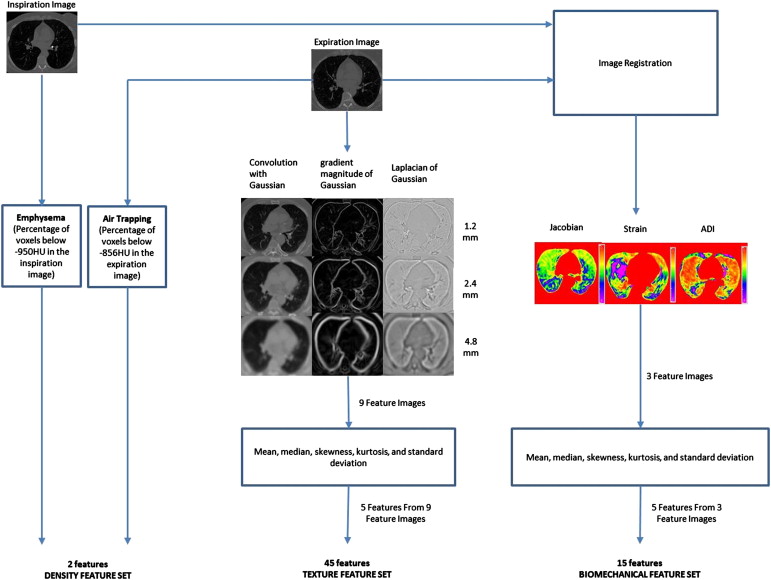
CT has emerged as a tool for quantitatively characterizing parenchymal destruction and small airways involvement. CT allows regional assessment of the lung disease. CT-derived measurements have been shown to correlate well with the pathology of the disease . CT is commonly used to measure the extent of emphysema in the lungs and can be more sensitive than spirometry in quantitating disease progression. Emphysema is quantified using CT densitometry techniques, which for example can calculate the percentage of voxels falling below a given Hounsfield unit (HU) threshold in the inspiration image. Expiratory CT has also been shown to be useful in calculating the extent of air trapping using CT densitometry techniques . However, density measurements are influenced by CT reconstruction algorithm or other technical parameters and are dependent on the single threshold value. CT image texture also plays an important role in characterizing lung tissue and its pathologies. Uppaluri et al proposed the two-dimensional (2D) adaptive multiple feature method (AMFM), which captures textural patterns on the CT image. This method has shown good sensitivity in characterizing lung tissue . Later, an extension of this method to three dimensions by Xu et al further showed good sensitivity in discriminating smoker and nonsmoker subjects . Sorensen et al proposed a multiscale Gaussian filter bank approach to define the texture on the CT images and has shown better discrimination of COPD and normal subjects with good correlations to the lung function measurements . Although density- and texture-based features serve to map lung destruction and remodeling, these measures do not provide insights into the mechanism of disease onset or disease progression. Mishima et al have suggested that once emphysema has been initiated with the appearance of small, regionalized tissue destruction, disease progression occurs, in part, because of mechanical factors serving to cause small holes to converge rather than new, isolated small holes emerging. It is important that new imaging-based metrics provide maps of parenchymal mechanics to allow for an improved understanding of subject-specific alterations in lung mechanics and regional parenchymal stresses. This is especially important as new methods emerge, such as endobronchial valves , to extract or isolate lung regions from the ventilation process. There is a poor understanding in regard to how remaining parenchyma is affected by such interventions.
Get Radiology Tree app to read full this article<
Materials and methods
COPDGene Data
Get Radiology Tree app to read full this article<
Data Collection and PFT
Get Radiology Tree app to read full this article<
Table 1
Demographic Information and PFT Measures of the Subjects in This Study
Parameters Non-COPD COPD Age 67.4 (6.79) 67.6 (5.87) Gender (M/F) 34/23 57/39 Height (cm) 168.5 (8.66) 168.2 (9.02) Weight (kg) 81 (11.80) 79.9 (21.30) BMI 28.5 (4.08) 28.01 (6.26) Pack-years 16 (8.30) 39.05 (12.21) FEV 1 % predicted 0.9 (0.13) 0.55 (0.27) FEV 1 /FVC 0.7 (0.05) 0.46 (0.15) GOLD stage (N/0/1/2/3/4) 27/30/0/0/0/0 0/0/29/29/28/19
BMI, body mass index; COPD, chronic obstructive pulmonary disease; FEV 1 , forced expiratory volume in 1 second; FVC, forced vital capacity; GOLD, Global Initiative for COPD.
The numbers reported are mean values with standard deviation in parentheses.
Get Radiology Tree app to read full this article<
Image Acquisition
Get Radiology Tree app to read full this article<
Image Preprocessing and Lung Segmentation
Get Radiology Tree app to read full this article<
Get Radiology Tree app to read full this article<
Image Registration
Get Radiology Tree app to read full this article<
Feature Calculation
Get Radiology Tree app to read full this article<
Density-Based Feature Set
Get Radiology Tree app to read full this article<
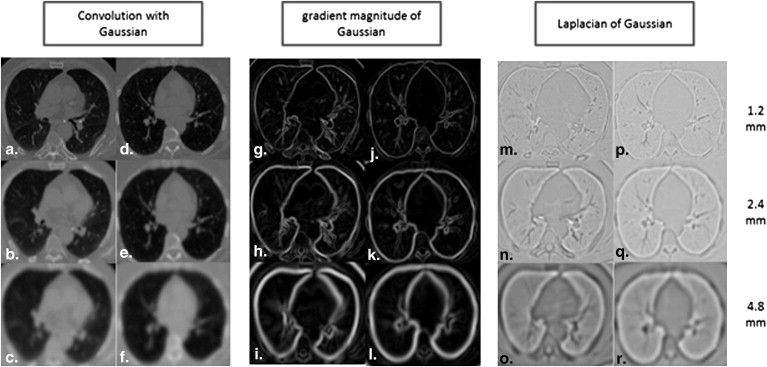
Texture-Based Feature Set
Get Radiology Tree app to read full this article<
Get Radiology Tree app to read full this article<
Lung Biomechanical Feature Set
Get Radiology Tree app to read full this article<
Get Radiology Tree app to read full this article<
![Figure 3, Axial slices of a mild chronic obstructive lung disease (COPD) (Global Initiative for COPD [GOLD]1) and severe COPD (GOLD4) subject. (a) Jacobian map of GOLD1 subject. (b) Jacobian map of GOLD4 subject. (c) Strain map of GOLD1 subject. (d) Strain map of GOLD4 subject. (e) Anisotropic deformation index map of GOLD1 subject. (f) Anisotropic deformation of GOLD4 subject. ADI, anisotropic deformation index.](https://storage.googleapis.com/dl.dentistrykey.com/clinical/RegistrationBasedLungMechanicalAnalysisofChronicObstructivePulmonaryDiseaseCOPDUsingaSupervisedMachineLearningFramework/2_1s20S1076633213001086.jpg)
Get Radiology Tree app to read full this article<
Feature Selection and Classification
Get Radiology Tree app to read full this article<
Get Radiology Tree app to read full this article<
Statistical Analysis and Classification Experiments
Get Radiology Tree app to read full this article<
Get Radiology Tree app to read full this article<
Get Radiology Tree app to read full this article<
Table 2
Relationship between CT-Derived Features and Clinical Diagnostic Measures of COPD
Features_r_ FEV 1 % Predicted_r_ FEV 1 /FVC_ρ_ SGRQ Total Score Exp. 1 Exp. 2 Mean Jacobian ∗ 0.80 0.76 −0.63 ✓ ✓ Median Jacobian ∗ 0.76 0.75 −0.63 ✓ Skewness Jacobian ∗ −0.42 −0.52 0.35 ✓ Kurtosis Jacobian ∗ −0.53 −0.58 0.44 ✓ Standard deviation of Jacobian ∗ 0.74 0.64 −0.59 ✓ Standard deviation of strain ∗ 0.70 0.59 −0.53 ✓ Kurtosis ADI ( P > .05) ∗ 0.27 0.12 −0.43 ✓ Median convolution with Gaussian at 1.2 mm † 0.67 0.76 −0.52 ✓ ✓ Kurtosis convolution with Gaussian at 2.4 mm † −0.59 −0.60 −0.39 ✓ Mean convolution with Gaussian at 2.4 mm † 0.68 0.77 −0.51 ✓ ✓ Median convolution with Gaussian at 2.4 mm † 0.69 0.78 −0.51 ✓ Skewness convolution with Gaussian at 4.8 mm † −0.57 0.60 0.41 ✓ Skewness gradient magnitude of Gaussian at 1.2 mm † −0.55 −0.61 0.47 ✓ Skewness gradient magnitude of Gaussian at 4.8 mm † −0.61 −0.66 0.55 ✓ ✓ Median Laplacian of Gaussian at 4.8 mm † 0.70 0.72 −0.61 ✓ ✓ Kurtosis Laplacian of Gaussian at 4.8 mm † 0.24 0.26 −0.2 ✓ Mean Laplacian of Gaussian at 4.8 mm † 0.66 0.66 −0.64 ✓ ✓ Emphysema (percentage of voxels below −950 HU) ‡ −0.65 −0.73 0.46 ✓ ✓ Air trapping (percentage of voxels below −856 HU) ‡ −0.78 −0.84 0.56 ✓ ✓
ADI, anisotropic deformation index; CT, computed tomography; FEV 1 , forced expiratory volume in 1 second; SGRQ, St. George’s respiratory questionnaire.
Pearson linear correlation coefficient is represented with r and Spearman correlation coefficient is represented with ρ . All the correlations have shown statistical significance of P < .0001 except the kurtosis ADI. Exp. 1 and Exp. 2 columns represent the features used in classification experiments 1 and 2.
Get Radiology Tree app to read full this article<
Get Radiology Tree app to read full this article<
Get Radiology Tree app to read full this article<
Table 3
Classification Results of COPD/Non-COPD Classification
Feature Sets AUC FEV 1 %predicted ( R 2 ) FEV 1 /FVC ( R 2 ) SGRQ Total Score ( R 2 ) Density 0.83 ( P < 10 −4 ) 0.57 0.68 0.30 Texture 0.89 ( P < 10 −4 ) 0.58 0.72 0.37 Biomechanical 0.85 ( P < 10 −4 ) 0.71 0.68 0.41 ALL 0.87 (-) 0.73 0.77 0.47
AUC, area under the curve; FEV 1 , forced expiratory volume in 1 second; FVC, forced vital capacity; SGRQ, St. George’s respiratory questionnaire.
AUC values reported from the receiver-operating characteristic analysis with P values for difference in AUC between the ALL feature set and the other feature sets according to the test proposed by Hanley and McNeil shown in parentheses. Correlation results from multiple regression analysis are shown between optimal features of density, texture, biomechanical features, and ALL with pulmonary function test parameters and SGRQ scores.
Table 4
COPD Severity Classification Results
Feature Sets AUC FEV 1 %predicted ( R 2 ) FEV 1 /FVC ( R 2 ) SGRQ Total Score ( R 2 ) Density 0.76 ( P < 10 −4 ) 0.57 0.69 0.26 Texture 0.73 ( P < 10 −4 ) 0.57 0.70 0.30 Biomechanical 0.81 ( P < 10 −3 ) 0.71 0.63 0.35 All 0.80 (-) 0.72 0.73 0.35
AUC, area under the curve; FEV 1 , forced expiratory volume in 1 second; FVC, forced vital capacity; SGRQ, St. George’s respiratory questionnaire.
AUC values reported from the ROC analysis with P values for difference in AUC between the ALL feature set and the other feature sets according to the test proposed by Hanley and McNeil shown in parenthesis. Correlation results from multiple regression analysis are shown between optimal features of density, texture, lung biomechanical features, and ALL with pulmonary function test parameters and SGRQ scores.
Get Radiology Tree app to read full this article<
Results
Correlation Results
Get Radiology Tree app to read full this article<
Classification Experiment 1 (COPD vs. Non-COPD Classification)
Get Radiology Tree app to read full this article<
Classification Experiment 2 (COPD Severity Classification)
Get Radiology Tree app to read full this article<
Discussion
Get Radiology Tree app to read full this article<
Get Radiology Tree app to read full this article<
Get Radiology Tree app to read full this article<
Get Radiology Tree app to read full this article<
Table 5
AUC Values at Each GOLD Stage of COPD From COPD Severity Classification with P Values for Difference in AUC with Biomechanical Feature Set According to the Comparison Test Proposed by Hanley and McNeil in Parentheses
Feature Sets GOLD0 GOLD1 GOLD2 GOLD3 GOLD4 Density 0.80 ( P = .0521) 0.67 ( P < 10 −4 ) 0.63 ( P < 10 −4 ) 0.75 ( P < 10 −4 ) 0.89 ( P = .0781) Texture 0.79 ( P < .05) 0.74 ( P = .6524) 0.58 ( P < 10 −4 ) 0.75 ( P < 10 −4 ) 0.83 ( P < 10 −4 ) Biomechanical 0.82 (-) 0.75 (-) 0.76 (-) 0.89 (-) 0.92 (-)
AUC, area under the curve; GOLD, Global Initiative for Chronic Obstructive Pulmonary Disease.
Get Radiology Tree app to read full this article<
Get Radiology Tree app to read full this article<
Get Radiology Tree app to read full this article<
Conclusion
Get Radiology Tree app to read full this article<
Acknowledgments
Get Radiology Tree app to read full this article<
References
1. Global Strategy for the Diagnosis, Management and Prevention of COPD. Global Initiative for Chronic Obstructive Lung Disease (GOLD); 2011.
2. Rabe K.F., Hurd S., Anzueto A., et. al.: Global strategy for the diagnosis, management, and prevention of chronic obstructive pulmonary disease: GOLD executive summary. Am J Resp Crit Care Med 2007; 176: pp. 532-555. Epub 2007/05/18
3. Amelon R., Cao K., Ding K., et. al.: Three-dimensional characterization of regional lung deformation. J Biomech 2011; 44: pp. 2489-2495. Epub 2011/08/02
4. Busacker A., Newell J.D., Keefe T., et. al.: A multivariate analysis of risk factors for the air-trapping asthmatic phenotype as measured by quantitative CT analysis. Chest 2009; 135: pp. 48-56. Epub 2008/08/12
5. Muller N.L., Staples C.A., Miller R.R., et. al.: “Density mask.” An objective method to quantitate emphysema using computed tomography. Chest 1988; 94: pp. 782-787. Epub 1988/10/01
6. Murphy K., Pluim J.P., van Rikxoort E.M., et. al.: Toward automatic regional analysis of pulmonary function using inspiration and expiration thoracic CT. Med Phys 2012; 39: pp. 1650-1662. Epub 2012/03/03
7. Uppaluri R., Mitsa T., Sonka M., et. al.: Quantification of pulmonary emphysema from lung computed tomography images. Am J Resp Crit Care Med 1997; 156: pp. 248-254. Epub 1997/07/01
8. Xu Y., Sonka M., McLennan G., et. al.: MDCT-based 3-D texture classification of emphysema and early smoking related lung pathologies. IEEE Trans Medical Imaging 2006; 25: pp. 464-475. Epub 2006/04/13
9. Yin Y., Hoffman E.A., Lin C.L.: Mass preserving nonrigid registration of CT lung images using cubic B-spline. Med Phys 2009; 36: pp. 4213-4222. Epub 2009/10/09
10. Spaggiari E., Zompatori M., Verduri A., et. al.: Early smoking-induced lung lesions in asymptomatic subjects. Correlations between high resolution dynamic CT and pulmonary function testing. La Radiol Med 2005; 109: pp. 27-39. Epub 2005/02/25
11. Gevenois P.A., de Maertelaer V., De Vuyst P., et. al.: Comparison of computed density and macroscopic morphometry in pulmonary emphysema. Am J Resp Crit Care Med 1995; 152: pp. 653-657. Epub 1995/08/01
12. Gould G.A., MacNee W., McLean A., et. al.: CT measurements of lung density in life can quantitate distal airspace enlargement—an essential defining feature of human emphysema. Am Rev Respir Dis 1988; 137: pp. 380-392. Epub 1988/02/01
13. Gould G.A., Redpath A.T., Ryan M., et. al.: Lung CT density correlates with measurements of airflow limitation and the diffusing capacity. Eur Respir J 1991; 4: pp. 141-146. Epub 1991/02/01
14. Boedeker K.L., McNitt-Gray M.F., Rogers S.R., et. al.: Emphysema: effect of reconstruction algorithm on CT imaging measures. Radiology 2004; 232: pp. 295-301. Epub 2004/06/29
15. Sieren J.P., Newell J.D., Judy P.F., et. al.: Reference standard and statistical model for intersite and temporal comparisons of CT attenuation in a multicenter quantitative lung study. Med Phys 2012; 39: pp. 5757-5767. Epub 2012/09/11
16. Uppaluri R., Hoffman E.A., Sonka M., et. al.: Computer recognition of regional lung disease patterns. Am J Resp Crit Care Med 1999; 160: pp. 648-654. Epub 1999/08/03
17. Uppaluri R., Hoffman E.A., Sonka M., et. al.: Interstitial lung disease: a quantitative study using the adaptive multiple feature method. Am J Resp Crit Care Med 1999; 159: pp. 519-525. Epub 1999/02/02
18. Sorensen L., Nielsen M., Lo P., et. al.: Texture-based analysis of COPD: a data-driven approach. IEEE Trans Med Imaging 2012; 31: pp. 70-78. Epub 2011/08/24
19. Mishima M., Hirai T., Itoh H., et. al.: Complexity of terminal airspace geometry assessed by lung computed tomography in normal subjects and patients with chronic obstructive pulmonary disease. Proc Natl Acad Sci USA 1999; 96: pp. 8829-8834. Epub 1999/08/04
20. Barua A., Vaughan P., Wotton R., et. al.: Do endobronchial valves improve outcomes in patients with emphysema?. Interact Cardiovasc Thorac Surg 2012; 15: pp. 1072-1076. Epub 2012/09/05
21. Brown M.S., Kim H.J., Abtin F.G., et. al.: Emphysema lung lobe volume reduction: effects on the ipsilateral and contralateral lobes. Eur Radiol 2012; 22: pp. 1547-1555. Epub 2012/04/03
22. Herth F.J., Eberhardt R., Gompelmann D., et. al.: Radiological and clinical outcomes of using Chartis to plan endobronchial valve treatment. Eur Respir J 2013; 41: pp. 302-308. Epub 2012/05/05
23. Herth F.J., Noppen M., Valipour A., et. al.: Efficacy predictors of lung volume reduction with Zephyr valves in a European cohort. Eur Respir J 2012; 39: pp. 1334-1342. Epub 2012/01/28
24. Reinhardt J.M., Ding K., Cao K., et. al.: Registration-based estimates of local lung tissue expansion compared to xenon CT measures of specific ventilation. Med Image Anal 2008; 12: pp. 752-763. Epub 2008/05/27
25. Regan E.A., Hokanson J.E., Murphy J.R., et. al.: Genetic epidemiology of COPD (COPDGene) study design. COPD 2010; 7: pp. 32-43. Epub 2010/03/11
26. Cao K, Christensen GE, Ding K, et al, eds. Intensity-and-landmark-driven, inverse consistent, B-spline registration and analysis for lung imagery. Second International Workshop on Pulmonary Image Analysis; 2009; London, UK.
27. Muller N.L., Thurlbeck W.M.: Thin-section CT, emphysema, air trapping, and airway obstruction. Radiology 1996; 199: pp. 621-622. Epub 1996/06/01
28. Newell J.D.: Quantitative computed tomography of lung parenchyma in chronic obstructive pulmonary disease: an overview. Proc Am Thorac Soc 2008; 5: pp. 915-918. Epub 2008/12/06
29. Foreman M.G., DeMeo D.L., Hersh C.P., et. al.: Clinical determinants of exacerbations in severe, early-onset COPD. Eur Respir J 2007; 30: pp. 1124-1130. Epub 2007/08/24
30. Newman K.B., Lynch D.A., Newman L.S., et. al.: Quantitative computed tomography detects air trapping due to asthma. Chest 1994; 106: pp. 105-109. Epub 1994/07/01
31. Lubliner J.: Plasticity theory.2008.Dover PublicationMineola, NY
32. Hall M.A.: Correlation-based feature subset selection for machine learning.1998.University of WaikatoHamilton, New Zealand
33. Aha D., Kibler D., Albert M.K.: Instance-based learning algorithms. Machine Learning 1991; 6: pp. 37-66.
34. Mark Hall, Frank E, Holmes G, et al. The WEKA data mining software: an update. SIGKDD Explorations, 2009. http://www.cs.waikato.ac.nz/∼eibe/pubs/weka_update.pdf .
35. Holmes G, Donkin A. Witten IH. WEKA: a machine learning workbench. Proceedings of the 1994 Second Australian and New Zealand Conference, November 29–December 2, 1994.
36. Hanley J.A., McNeil B.J.: A method of comparing the areas under receiver operating characteristic curves derived from the same cases. Radiology 1983; 148: pp. 839-843. Epub 1983/09/01
37. Gurney J.W., Jones K.K., Robbins R.A., et. al.: Regional distribution of emphysema: correlation of high-resolution CT with pulmonary function tests in unselected smokers. Radiology 1992; 183: pp. 457-463. Epub 1992/05/01
38. Matsuoka S., Kurihara Y., Yagihashi K., et. al.: Quantitative assessment of air trapping in chronic obstructive pulmonary disease using inspiratory and expiratory volumetric MDCT. AJR Am J Roentgen 2008; 190: pp. 762-769. Epub 2008/02/22
39. Lynch D.A., Newell J.D.: Quantitative imaging of COPD. J Thorac Imaging 2009; 24: pp. 189-194. Epub 2009/08/26
40. Newell J.D., Hogg J.C., Snider G.L.: Report of a workshop: quantitative computed tomography scanning in longitudinal studies of emphysema. Eur Respir J 2004; 23: pp. 769-775. Epub 2004/06/05
41. Sorensen L., Shaker S.B., de Bruijne M.: Quantitative analysis of pulmonary emphysema using local binary patterns. IEEE Trans Med Imaging 2010; 29: pp. 559-569. Epub 2010/02/05