
Rationale and Objectives
Registration enables quantitative spatial correlation of features from different imaging modalities. Our objective is to register in vivo imaging with histologic sections of the human prostate so that histologic truth can be correlated with in vivo imaging features.
Materials and Methods
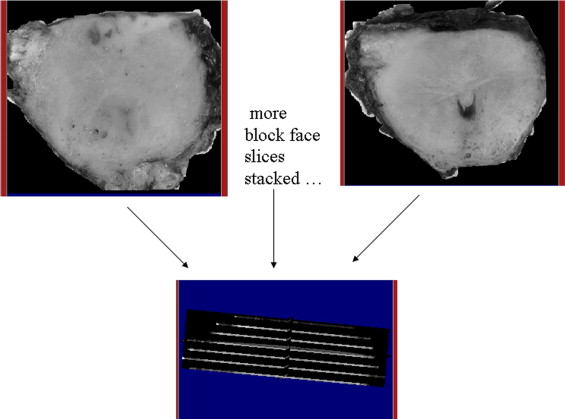
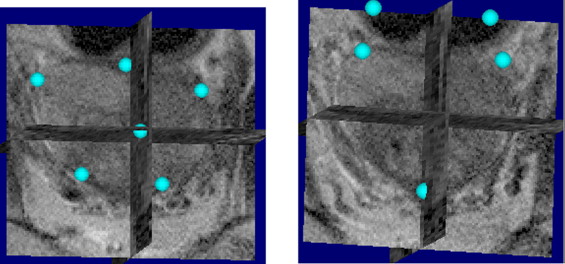
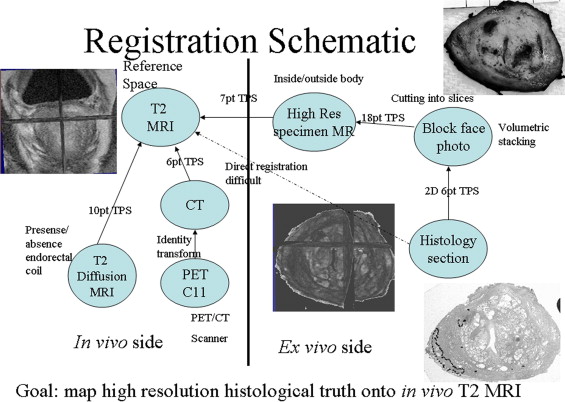
In vivo imaging of the prostate included T2-weighted anatomic and diffusion weighted 3-T magnetic resonance imaging (MRI) as well as 11 C-choline positron emission tomography (PET). In addition, ex vivo 3-T MRI of the prostate specimen, histology, and associated block face photos of the prostate specimen were obtained. A standard registration method based on mutual information (MI) and thin-plate spline (TPS) was applied. Registration among in vivo imaging modalities is well established; however, accurate registration involving histology is difficult. Our approach breaks up the difficult direct registration of histology and in vivo imaging into achievable subregistration tasks involving intermediate ex vivo modalities like block face photography and specimen MRI. Results of subregistration tasks are combined to compute the intended, final registration between in vivo imaging and histology.
Results
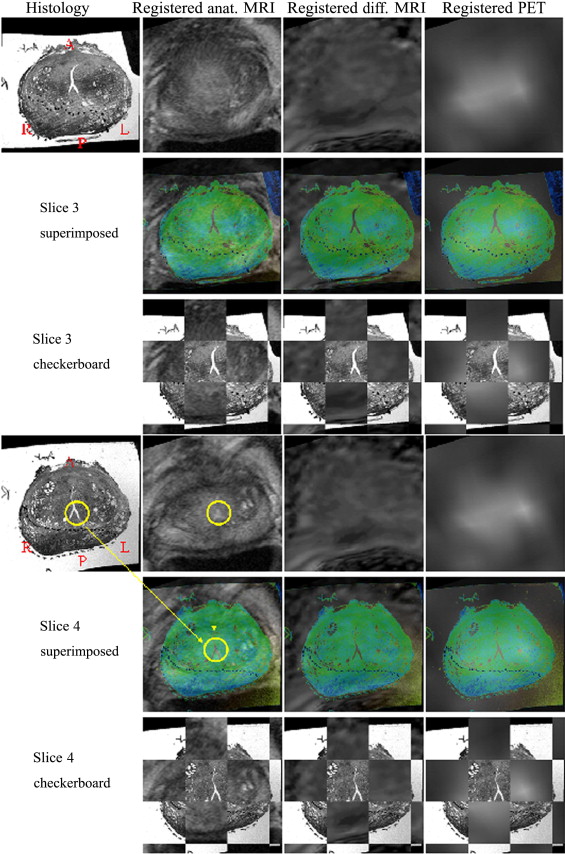
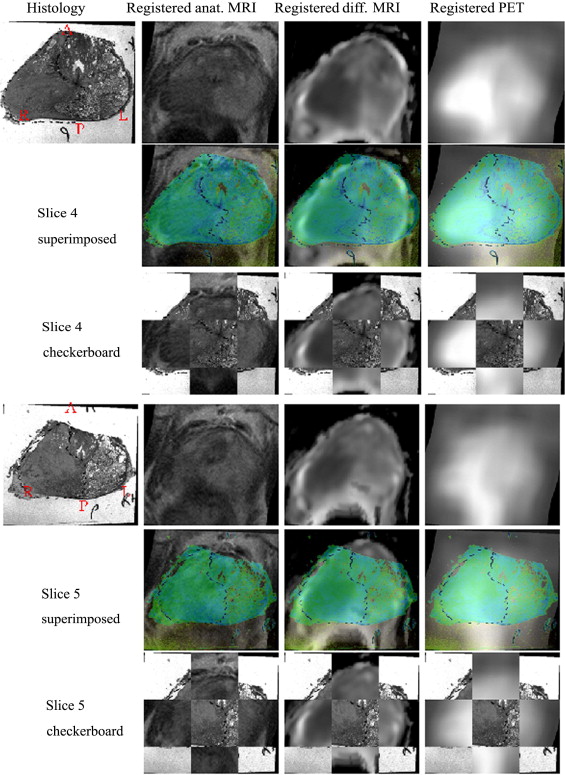
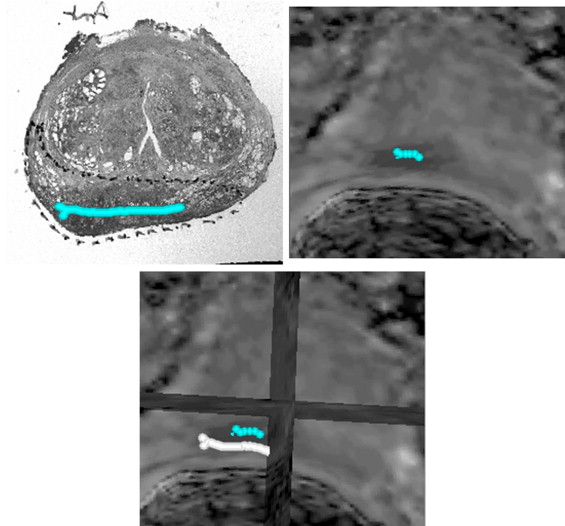
The methodology was applied to two patients and found to be clinically feasible. Overall registered anatomic MRI, diffusion MRI, and 11 C-choline PET aligned well with histology qualitatively for both patients. There is no ground truth of registration accuracy as the scans are real patient scans. An indirect validation of the registration accuracy has been proposed comparing tumor boundary markings found in diffusion MRI and histologic sections. Registration errors for two patients between diffusion MRI and histology were 3.74 and 2.26 mm.
Conclusion
This proof of concept paper demonstrates a method based on intrinsic image information content for successfully registering in vivo imaging of the human prostate with its post-resection histology, which does not require the use of extrinsic fiducial markers. The methodology successfully mapped histology onto the in vivo imaging space, allowing the observation of how well different in vivo imaging features correspond to histologic truth. The methodology is therefore the basis for a systematic comparison of in vivo imaging for staging of human prostate cancer.
Registration is a process that establishes a spatial correspondence between two scans so that both can be viewed in the same spatial frame. Often registration is a necessary preprocessing step before a quantitative comparison can be made between two scans, as it is difficult to locate exactly corresponding spatial features in both scans free of personal bias. Here we present a method to register histology sections with various in vivo images, including anatomical magnetic resonance imaging (MRI), diffusion MRI, and positron emission tomography (PET), of human prostate. Histology slides carry the “ground truth” regarding location and extent of tumors determined by a pathologist. Once mapped onto the in vivo imaging space, we can observe how different features of in vivo imaging help to characterize tumor and normal tissues determined by histology. We can observe how well anatomical MRI, diffusion MRI, and PET differentiate between normal and tumor tissues for prostate cancer. This information will enable us to determine which modality or combination of modalities is suited best to stage prostate cancer. The current practice of staging prostate cancer uses anatomical MRI and/or transrectal ultrasound (TRUS), both of which have unsatisfactory accuracy ( ).
Registration of histology sections and in vivo imaging modalities is a challenging problem. The key issue is to account for the complex deformations that occur in the prostate as it is removed from the body and then sectioned for histological evaluation. First, the prostate potentially undergoes nonlinear deformation as it is removed from the body, because there are no surrounding organs to constrain the prostate and vascular pressurization and intracellular fluids are lost. Second, the prostate is further deformed as it is fixed and then sliced for histological evaluation. The other challenge is the difference in available information between in vivo imaging (e.g., resolution in millimeters) and histology (e.g., resolution in microns). Registration among in vivo imaging modalities is relatively easy, as the deformation involved is less drastic than deformation involved with registering histology.
Get Radiology Tree app to read full this article<
Get Radiology Tree app to read full this article<
Get Radiology Tree app to read full this article<
Get Radiology Tree app to read full this article<
Materials and methods
Get Radiology Tree app to read full this article<
Get Radiology Tree app to read full this article<
Registration Framework
Get Radiology Tree app to read full this article<
Tˆ=argmaxT∈FMI(A(∙),B(T(∙))Tˆ;estimateofthetransformF;familyoffeasibletransforms. T
=
arg
max
T
∈
F
M
I
(
A
(
•
)
,
B
(
T
(
•
)
)
T
;
estimate
of
the
transform
F
;
family
of
feasible
transforms
.
Get Radiology Tree app to read full this article<
Get Radiology Tree app to read full this article<
Get Radiology Tree app to read full this article<
Scan Acquisition
Get Radiology Tree app to read full this article<
Get Radiology Tree app to read full this article<
Get Radiology Tree app to read full this article<
Get Radiology Tree app to read full this article<
Registration Schematic
Get Radiology Tree app to read full this article<
Get Radiology Tree app to read full this article<
Get Radiology Tree app to read full this article<
Get Radiology Tree app to read full this article<
Get Radiology Tree app to read full this article<
Get Radiology Tree app to read full this article<
Get Radiology Tree app to read full this article<
Results
Get Radiology Tree app to read full this article<
Registration Results: Patient 1
Get Radiology Tree app to read full this article<
Get Radiology Tree app to read full this article<
Get Radiology Tree app to read full this article<
Registration Results: Patient 2
Get Radiology Tree app to read full this article<
Get Radiology Tree app to read full this article<
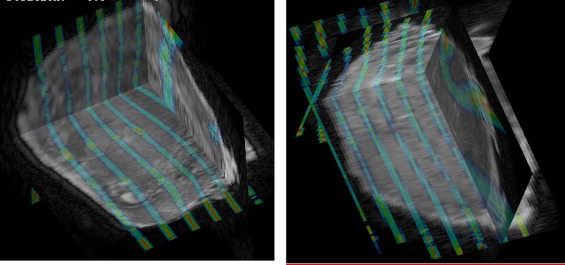
Intermediate Registration Between Stacked Block Photographs and Ex Vivo MRI
Get Radiology Tree app to read full this article<
Get Radiology Tree app to read full this article<
Registration Error from Two Patients
Get Radiology Tree app to read full this article<
Get Radiology Tree app to read full this article<
Get Radiology Tree app to read full this article<
Get Radiology Tree app to read full this article<
Get Radiology Tree app to read full this article<
Discussion
Get Radiology Tree app to read full this article<
Get Radiology Tree app to read full this article<
Conclusion
Get Radiology Tree app to read full this article<
Get Radiology Tree app to read full this article<
References
1. Rifkin M.D., Zerhouni E.A., Gatsonis C.A., et. al.: Comparison of magnetic resonance imaging and ultrasonography in staging early prostate cancer: Results of a multi-institutional cooperative trial. N Engl J Med 1999; 323: pp. 621-626.
2. Chenevert T., Stegman L., Taylor J., et. al.: Diffusion magnetic resonance imaging: An early surrogate marker of therapeutic efficacy in brain tumors. J Natl Cancer Inst 2000; 92: pp. 2029-2036.
3. Hara T., Kosaka N., Kishi H.: PET imaging of prostate cancer using carbon-11-choline. J Nucl Med 1998; 39: pp. 990-995.
4. Picchio M., Treiber U., Beer A., et. al.: Value of 11C-choline PET and contrast-enhanced CT for staging of bladder cancer: Correlation with histopathologic findings. J Nucl Med 2006; 47: pp. 938-944.
5. Kim B., Boes J.L., Frey K.A., et. al.: Mutual information for automated unwarping of rat brain autoradiographs. Neuroimage 1997; 5: pp. 31-40.
6. Jacobs M.A., Windham J.P., Soltanian-Zadeh H., et. al.: Registration and warping of magnetic resonance images to histology sections. Med Phys 1999; 26: pp. 1568-1578.
7. Breen M.S., Lancaster T.L., Lazebnik R.S., et. al.: Three-dimensional method for comparing in vivo interventional MR images of thermally ablated tissue with tissue response. J Magn Reson Imaging 2003; 18: pp. 90-102.
8. Zarow C., Kim T.-S., Singh M., et. al.: A standardized method for brain-cutting suitable for both stereology and MRI-brain co-registration. J Neurosci Methods 2004; 139: pp. 209-215.
9. Li G., Nikolova S., Bartha R.: Registration of in vivo magnetic resonance T1 weighted brain images to triphenyltetrazolium chloride stained sections in small animals. J Neurosci Methods 2006; 156: pp. 368-375.
10. Meyer C.R., Moffat B.A., Kuszpit K.K., et. al.: A methodology for registration of a histological slide and in-vivo MRI volume based on optimizing mutual information. Mol Imaging 2006; 5: pp. 1-8.
11. Hill D.L.G., Batchelor P.G., Holden M., et. al.: Medical image registration. Physics Med Biol 2001; 46: pp. r1-r45.
12. Meyer C., Boes J., Bland P., et. al.: Demonstration of accuracy and clinical versatility of mutual information for automatic multimodality image fusion using affine and thin plate spline warped geometric deformations. Med Image Analysis 1997; 3: pp. 195-206.
13. Press W.H., Flannery B.P., Teukolsky S.A., et. al.: Numerical Recipes in C: The Art of Scientific Computing.1988.Cambridge University PressCambridge 305−137
14. Rueckert D., Sonoda L.I., Hayes C., et. al.: Nonrigid registration using free-form deformations: Application to breast MR images. IEEE Trans Med Imaging 1999; 18: pp. 712-721.
15. Zou K.H., Warfield S.K., Bharatha A., et. al.: Statistical validation of image segmentation quality based on a spatial overlap index. Acad Radiol 2004; 11: pp. 178-189.
16. Wu Q.J., Bourland J.D.: Morphology-guided radiosurgery treatment planning and optimization for multiple isocenters. Med Phys 1999; 26: pp. 2151-2160.
17. Powles T., Murray I., Brock C., et. al.: Molecular positron emission tomography and PET/CT imaging in urological malignancies. Eur Urol 2007; 51: pp. 1511-1521.
18. Piert M., Machulla H.-J., Picchio M., et. al.: Hypoxia-Specific tumor imaging with 18F-fluoroazomycin arabinoside. J Nucl Med 2005; 46: pp. 106-113.
19. Kwee S.A., Coel M., Lim J., et. al.: Prostate cancer localization with 18fluorine fluorocholine positron emission tomography. J Urol 2005; 173: pp. 252-255.
20. Kotzerke J., Volkmer B.G., Neumaier B., et. al.: Carbon-11 acetate positron emission tomography can detect local recurrence of prostate cancer. Eur J Nucl Med Mol Imaging 2002; 29: pp. 1380-1384.