
Rationale and Objectives
To quantify the relationship between dose of contrast administered and contrast kinetics of malignant breast lesions.
Materials and Methods
A total of 108 patients with 120 malignant lesions were selected for an institutional review board–approved review. Dynamic magnetic resonance protocol: one pre- and three or five post-contrast (at a fixed volume of 20 mL of 0.5 M gadodiamide) images. Patients were stratified into groups based on dose of contrast administered, after calculation of body weight (kg): Dose Group 1, <0.122 mmol/kg; Dose Group 2, 0.123–0.155 mmol/kg; Dose Group, 3 > 0.155 mmol/kg. Analysis of kinetic curve shape was made according to the Breast Imaging Reporting and Data System lexicon. Several quantitative parameters were calculated including initial and peak enhancement percentage (E 1 and E peak ). Linear regression was used to model the variation of kinetic parameters with dose.
Results
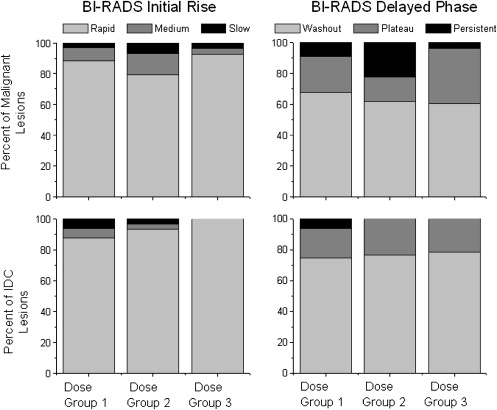
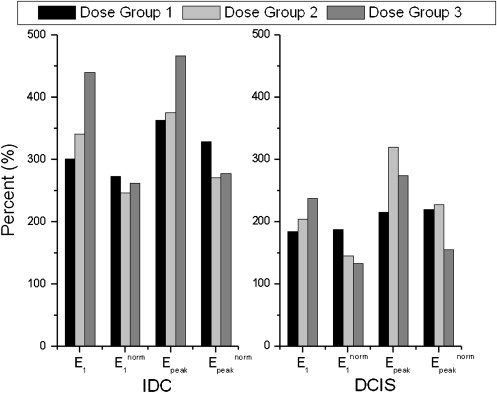
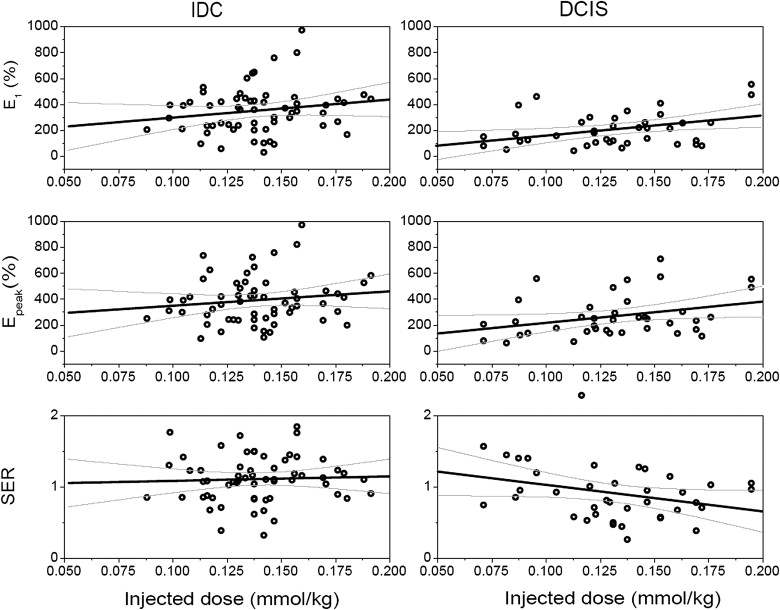
There was no difference found in the qualitative Breast Imaging Reporting and Data System descriptors of curve shape between the three dose groups. There was a trend for E 1 and E peak to increase from Dose Group 1 to Dose Group 3 in malignant lesions overall, as well as in invasive ductal carcinoma lesions separately. Each decrement/increment of 0.05 mmol/kg in dose yielded a decrease/increase of 78% and 97% in E 1 for in situ and invasive cancers, respectively.
Conclusion
Contrast should be administered at fixed dose to achieve comparable levels of lesion uptake in women of different weights. Our results suggest that reducing the contrast administered to 0.05 mmol/kg, as has been suggested for patients at risk of developing nephrogenic systemic fibrosis, could substantially decrease the observed initial enhancement in some cancers.
Dynamic contrast-enhanced magnetic resonance imaging (DCEMRI) of the breast allows for excellent visualization of lesion morphology and cancerous disease extent . Because of its high sensitivity for malignant disease, DCEMRI is being used increasingly for staging of the newly diagnosed breast cancer patient, for high-risk screening, and for follow-up of patients undergoing therapeutic interventions . Lesions are visualized after intravenous injection of contrast media, usually a gadolinium chelate, which accumulates in and around malignant tumors because of their dense and leaky neovasculature. Analysis of the time course of contrast media uptake and washout (ie, the kinetic curve) is important for lesion evaluation, because malignant tumors tend to exhibit a “washout” curve shape, whereas benign lesions often show “persistent” contrast uptake over time .
The injection of contrast media is a crucial component of breast DCEMRI acquisitions, because it is required for both lesion visualization and characterization. Yet, despite years of breast magnetic resonance imaging and clinical investigations, contrast media is typically used “off-label” for breast DCEMRI. Ideally, it should be expected that sufficient quantity of contrast is injected for reliable detection of all malignancies; an excessive quantity should be avoided to prevent toxicity, such as development of nephrogenic systemic fibrosis in patients with compromised kidney function ; and it is administered in such a way to minimize interpatient variability, ensuring that similar interpretation criteria can be consistently applied in the evaluation and characterization of lesions. The American College of Radiology (ACR) practice guidelines recommend that contrast be administered at a fixed dose of 0.1 mmol/kg via a bolus injection, followed by at least a 10-mL saline flush . By injecting a fixed dose, heavier women receive a larger volume (in milliliters) of contrast media compared to normal weight women. This is to be distinguished from injecting a fixed volume of contrast, so that regardless of weight, all women will receive the same volume of contrast media. This method was used more commonly in the past, and continues to be employed in some institutions.
Get Radiology Tree app to read full this article<
Materials and methods
Patients
Get Radiology Tree app to read full this article<
Get Radiology Tree app to read full this article<
MR Imaging Protocol and Analysis
Get Radiology Tree app to read full this article<
Determination of Dose Groups
Get Radiology Tree app to read full this article<
Get Radiology Tree app to read full this article<
Get Radiology Tree app to read full this article<
Kinetic Analysis
Qualitative Assessment of Curve Shape
Get Radiology Tree app to read full this article<
Quantitative Assessment of Curve Shape
Get Radiology Tree app to read full this article<
E1=100×S1−S0S0,Epeak=100×Speak−S0S0 E
1
=
100
×
S
1
−
S
0
S
0
,
E
p
e
a
k
=
100
×
S
p
e
a
k
−
S
0
S
0
where S 0 in the precontrast signal intensity, S 1 is the first postcontrast signal intensity, and S peak is the peak signal intensity. The signal enhancement ratio (SER) has been used in prior studies to quantify the degree of washout of the curve ,
SER=S1−S0Slast−S0, S
E
R
=
S
1
−
S
0
S
l
a
s
t
−
S
0
,
where S last is the signal intensity at the last postcontrast time point. A larger SER implies greater washout relative to the first postcontrast point. Higher SER has been correlated with increased vascularity and malignancy in other reports . Finally, the time to peak enhancement (T peak ) was calculated in seconds .
Get Radiology Tree app to read full this article<
Normalizing Parameters to Fixed Dose
Get Radiology Tree app to read full this article<
Get Radiology Tree app to read full this article<
Get Radiology Tree app to read full this article<
Enorm1=E1NF,Enormpeak=EpeakNF E
1
n
o
r
m
=
E
1
N
F
,
E
p
e
a
k
n
o
r
m
=
E
p
e
a
k
N
F
Get Radiology Tree app to read full this article<
Statistical Analysis
Get Radiology Tree app to read full this article<
Results
Get Radiology Tree app to read full this article<
Table 1
Patients in this Study were Classified into Three Groups Based on Quantity of Administered Dose
Dose Group 1 Dose Group 2 Dose Group 3 Dose range (mmol/kg) 0.071 – 0.122 0.123 – 0.155 0.156 – 0.201 Average dose (mmol/kg) 0.105 ± 0.015 0.139 ± 0.008 0.175 ± 0.014 Number of patients 31 53 24 Average patient age (y) 53.6 ± 13.1 55.8 ± 14.1 56.0 ± 16.7 Average patient weight (lb) 215 ± 36 159 ± 9 127 ± 10 Number malignant lesions 34 58 28 Average size (mm) 23.9 ± 13.0 22.2 ± 12.8 20.7 ± 16.6 Number of IDC lesions 16 30 14 Grade 1 3 4 3 Grade 2 9 12 7 Grade 3 4 12 3 Unknown 0 2 1 Number of DCIS lesions 15 15 9 Low grade 2 3 1 Intermediate grade 4 6 0 High grade 9 4 8 Unknown 0 2 0 ILC 0 6 4 Other 3 7 1
DCIS, ductal carcinoma in situ; IDC, invasive ductal carcinoma; ILC, invasive lobular carcinoma.
Get Radiology Tree app to read full this article<
Get Radiology Tree app to read full this article<
Table 2
Quantitative Kinetic Parameters E 1 , E peak , T peak , and SER for Malignant, IDC, and DCIS Lesions in Each Dose Group
Type of Lesion No. Cases E 1 (%) E peak (%) T peak (s) SER Dose Group 1 All malignant 34 254 ± 146 298 ± 167 215 ± 97 1.09 ± 0.43 DCIS 15 184 ± 122 216 ± 134 225 ± 103 1.09 ± 0.46 Low grade 2 152 ± 156 167 ± 134 250 ± 187 1.43 ± 1.21 Intermediate grade 4 208 ± 178 238 ± 221 203 ± 86 1.17 ± 0.26 High grade 9 181 ± 104 216 ± 101 230 ± 105 0.97 ± 0.33 IDC 16 301 ± 139 363 ± 169 202 ± 89 1.05 ± 0.36 Grade 1 3 157 ± 91 210 ± 66 317 ± 113 0.78 ± 0.36 Grade 2 9 325 ± 144 409 ± 200 194 ± 63 1.01 ± 0.31 Grade 3 4 354 ± 96 376 ± 52 135 ± 34 1.32 ± 0.38 ILC 0 — — — — Other 3 353 ± 175 358 ± 171 229 ± 137 1.38 ± 0.63 Dose Group 2 All malignant 58 284 ± 167 344 ± 166 233 ± 110 0.97 ± 0.37 DCIS 15 204 ± 106 319 ± 181 318 ± 107 0.74 ± 0.30 Low grade 3 152 ± 69 301 ± 168 385 ± 4.6 0.53 ± 0.08 Intermediate grade 6 202 ± 104 299 ± 151 273 ± 122 0.81 ± 0.34 High grade 4 167 ± 88 202 ± 61 301 ± 125 0.87 ± 0.34 IDC 30 341 ± 179 375 ± 172 183 ± 82 1.09 ± 0.32 Grade 1 4 333 ± 159 390 ± 144 218 ± 114 1.08 ± 0.48 Grade 2 12 314 ± 204 353 ± 187 191 ± 83 1.03 ± 0.38 Grade 3 12 382 ± 165 399 ± 170 163 ± 76 1.19 ± 0.20 ILC 6 186 ± 137 240 ± 132 275 ± 101 0.82 ± 0.35 Other 7 292 ± 161 354 ± 106 223 ± 120 1.04 ± 0.53 Dose Group 3 All malignant 28 348 ± 205 381 ± 197 202 ± 95 1.06 ± 0.31 DCIS 9 238 ± 173 275 ± 154 245 ± 113 0.85 ± 0.24 Low grade 1 259 262 254 1.03 Intermediate grade 0 — — — — High grade 8 235 ± 185 277 ± 164 244 ± 120 0.83 ± 0.24 IDC 14 439 ± 212 467 ± 212 166 ± 71 1.22 ± 0.30 Grade 1 3 537 ± 207 608 ± 157 163 ± 39 1.04 ± 0.13 Grade 2 7 388 ± 210 209 ± 138 175 ± 97 1.21 ± 0.31 Grade 3 3 404 ± 71 432 ± 84 163 ± 39 1.45 ± 0.37 ILC 4 241 ± 84 291 ± 100 252 ± 92 0.92 ± 0.15 Other 1 479 479 118 1.30
DCIS, ductal carcinoma in situ; E 1 , initial percentage; E peak , peak enhancement percentage; IDC, invasive ductal carcinoma; ILC, invasive lobular carcinoma; SER, signal enhancement ratio; T peak , time to peak enhancement.
Get Radiology Tree app to read full this article<
Get Radiology Tree app to read full this article<
Get Radiology Tree app to read full this article<
Discussion
Get Radiology Tree app to read full this article<
Get Radiology Tree app to read full this article<
Get Radiology Tree app to read full this article<
Get Radiology Tree app to read full this article<
Get Radiology Tree app to read full this article<
Get Radiology Tree app to read full this article<
References
1. Boetes C., Mus R.D., Holland R., et. al.: Breast tumors: comparative accuracy of MR imaging relative to mammography and US for demonstrating extent. Radiology 1995; 197: pp. 743-747.
2. Schouten van der Velden A.P., Boetes C., Bult P., et. al.: The value of magnetic resonance imaging in diagnosis and size assessment of in situ and small invasive breast carcinoma. Am J Surg 2006; 192: pp. 172-178.
3. Liberman L.: Breast MR imaging in assessing extent of disease. Magn Reson Imaging Clin N Am 2006; 14: pp. 339-349. vi
4. Newstead G.M.: MR imaging in the management of patients with breast cancer. Semin Ultrasound CT MR 2006; 27: pp. 320-332.
5. Saslow D., Boetes C., Burke W., et. al.: American Cancer Society guidelines for breast screening with MRI as an adjunct to mammography. CA Cancer J Clin 2007; 57: pp. 75-89.
6. Hylton N.: MR imaging for assessment of breast cancer response to neoadjuvant chemotherapy. Magn Reson Imaging Clin N Am 2006; 14: pp. 383-389. vii
7. Kuhl C.K., Mielcareck P., Klaschik S., et. al.: Dynamic breast MR imaging: are signal intensity time course data useful for differential diagnosis of enhancing lesions?. Radiology 1999; 211: pp. 101-110.
8. Abraham J.L., Thakral C.: Tissue distribution and kinetics of gadolinium and nephrogenic systemic fibrosis. Eur J Radiol 2008; 66: pp. 200-207.
9. Kanal E., Barkovich A.J., Bell C., et. al.: ACR guidance document for safe MR practices: 2007. AJR Am J Roentgenol 2007; 188: pp. 1447-1474.
10. Heywang-Kobrunner S.H., Haustein J., Pohl C., et. al.: Contrast-enhanced MR imaging of the breast: comparison of two different doses of gadopentetate dimeglumine. Radiology 1994; 191: pp. 639-646.
11. Szabo B.K., Aspelin P., Wiberg M.K., et. al.: Dynamic MR imaging of the breast. Analysis of kinetic and morphologic diagnostic criteria. Acta Radiol 2003; 44: pp. 379-386.
12. Esserman L., Hylton N., George T., et. al.: Contrast-enhanced magnetic resonance imaging to assess tumor histopathology and angiogenesis in breast carcinoma. Breast J 1999; 5: pp. 13-21.
13. Li K.L., Partridge S.C., Joe B.N., et. al.: Invasive breast cancer: predicting disease recurrence by using high-spatial-resolution signal enhancement ratio imaging. Radiology 2008; 248: pp. 79-87.
14. Li K.L., Henry R.G., Wilmes L.J., et. al.: Kinetic assessment of breast tumors using high spatial resolution signal enhancement ratio (SER) imaging. Magn Reson Med 2007; 58: pp. 572-581.
15. Holm S.: A simple sequentially rejective multiple test procedure. Scand J Statist 1979; 6: pp. 65-70.
16. Jansen S.A., Newstead G.M., Abe H., et. al.: Pure ductal carcinoma in situ: kinetic and morphologic MR characteristics compared with mammographic appearance and nuclear grade. Radiology 2007; 245: pp. 684-691.
17. Schnall M.D., Blume J., Bluemke D.A., et. al.: Diagnostic architectural and dynamic features at breast MR imaging: multicenter study. Radiology 2006; 238: pp. 42-53.
18. Kuhl C.K., Schrading S., Leutner C.C., et. al.: Mammography, breast ultrasound, and magnetic resonance imaging for surveillance of women at high familial risk for breast cancer. J Clin Oncol 2005; 23: pp. 8469-8476.
19. Warner E., Plewes D.B., Hill K.A., et. al.: Surveillance of BRCA1 and BRCA2 mutation carriers with magnetic resonance imaging, ultrasound, mammography, and clinical breast examination. JAMA 2004; 292: pp. 1317-1325.
20. Sardanelli F., Podo F., D’Agnolo G., et. al.: Multicenter comparative multimodality surveillance of women at genetic-familial high risk for breast cancer (HIBCRIT study): interim results. Radiology 2007; 242: pp. 698-715.
21. Heywang-Kobrunner S.H., Bick U., Bradley W.G., et. al.: International investigation of breast MRI: results of a multicentre study (11 sites) concerning diagnostic parameters for contrast-enhanced MRI based on 519 histopathologically correlated lesions. Eur Radiol 2001; 11: pp. 531-546.
22. Leach M.O., Boggis C.R., Dixon A.K., et. al.: Screening with magnetic resonance imaging and mammography of a UK population at high familial risk of breast cancer: a prospective multicentre cohort study (MARIBS). Lancet 2005; 365: pp. 1769-1778.
23. Knopp M.V., Bourne M.W., Sardanelli F., et. al.: Gadobenate dimeglumine-enhanced MRI of the breast: analysis of dose response and comparison with gadopentetate dimeglumine. AJR Am J Roentgenol 2003; 181: pp. 663-676.
24. Pediconi F., Catalano C., Occhiato R., et. al.: Breast lesion detection and characterization at contrast-enhanced MR mammography: gadobenate dimeglumine versus gadopentetate dimeglumine. Radiology 2005; 237: pp. 45-56.
25. FDA. Prohance, Available at: http://www.fda.gov/cder/foi/label/2007/020131s023,021489s001lbl.pdf . Accessed February 25, 2009.
26. FDA. Magnevist, Available at: http://www.fda.gov/cder/foi/label/2007/019596s043,021037s018lbl.pdf . Accessed February 25, 2009.
27. FDA. Omniscan, Available at: http://www.fda.gov/cder/foi/label/2007/020123s034lbl.pdf . Accessed February 25, 2009.
28. FDA. Multihance, Available at: http://www.fda.gov/cder/foi/label/2007/021357s003,021358s003lbl.pdf . Accessed February 25, 2009.
29. Warren R., Hayes C., Pointon L., et. al.: A test of performance of breast MRI interpretation in a multicentre screening study. Magn Reson Imaging 2006; 24: pp. 917-929.
30. Van Goethem M., Schelfout K., Kersschot E., et. al.: Comparison of MRI features of different grades of DCIS and invasive carcinoma of the breast. Jbr-Btr 2005; 88: pp. 225-232.
31. Neubauer H., Li M., Kuehne-Heid R., et. al.: High grade and non-high grade ductal carcinoma in situ on dynamic MR mammography: characteristic findings for signal increase and morphological pattern of enhancement. Br J Radiol 2003; 76: pp. 3-12.
32. Chen W., Giger M.L., Bick U., et. al.: Automatic identification and classification of characteristic kinetic curves of breast lesions on DCE-MRI. Med Phys 2006; 33: pp. 2878-2887.
33. Armitage P., Behrenbruch C., Brady M., Moore N.: Extracting and visualizing physiological parameters using dynamic contrast-enhanced magnetic resonance imaging of the breast. Med Image Anal 2005; 9: pp. 315-329.