
Rationale and Objectives
The aim of this study was to compare the reproducibility of bidimensional and volumetric quantification of epicardial adipose tissue (EAT) on cardiac computed tomography (CT) and evaluate their relationship with the extent of coronary artery disease (CAD).
Materials and Methods
Forty-five individuals underwent cardiac dual-source CT and conventional coronary angiography for suspicion of CAD. Nonenhanced images acquired to assess calcium score were used to quantify EAT. Coronary stenosis grading was performed on conventional coronary angiograms using Gensini scores. Two independent observers manually measured right ventricular EAT thickness at three different levels and in two different planes (four chamber and short axis) to obtain mean values. Additionally, EAT volume was automatically determined using a commercially available software tool.
Results
Conventional coronary angiography demonstrated nonstenotic coronary arteries in 22 subjects and significant coronary artery stenosis in 23. Significant correlations were observed between volumetric estimation of EAT and body mass index, coronary artery calcification, and Gensini score. On automatic volumetry, patients with significant coronary artery stenosis had significantly greater EAT volumes (154.58 ± 58.91 mL) than those without significant CAD (120.94 ± 81.85 mL) ( P = .016). The manual bidimensional approach based on thickness measurements failed to show a significant difference between the two groups. Reproducibility and interobserver agreement for EAT quantification were higher when the automatic volumetric method was used (concordance-correlation coefficient, 0.96) compared to manual measurements (concordance-correlation coefficients, 0.37 for four-chamber EAT, 0.53 for short-axis EAT, and 0.58 for average EAT).
Conclusions
For the quantification of EAT on cardiac CT, automated volumetry is more reproducible and correlates better with the extent of CAD than manual bidimensional measurements.
There is increasing clinical evidence that visceral adipose tissue is an important indicator of cardiovascular risk . There seems to be an association between visceral adipose tissue and cardiovascular risk factors such as dyslipidemia , diabetes , hypertension , and metabolic syndrome . Epicardial adipose tissue (EAT) is visceral fat located between the myocardium and the pericardium, particularly around subepicardial coronary vessels. It is thought to originate from brown adipose tissue . This depot of visceral fat is correlated with insulin resistance , body mass index (BMI) , visceral abdominal adipose tissue and left ventricular mass . Furthermore, EAT may act as an endocrine or paracrine organ as the source of a number of bioactive molecules causing coronary atherosclerosis . Some studies have revealed correlations between EAT, coronary artery calcification (CAC) , obesity, metabolic syndrome , and coronary artery disease (CAD) , which may be due to the contribution of EAT to the local production of inflammatory mediators developing atherosclerosis .
Traditionally, two-dimensional transthoracic echocardiography has been used to quantify epicardial fat. In these studies, the assessment of EAT is performed by measuring the epicardial fat thickness located around the right ventricle . However, the measurement of EAT thickness using transthoracic echocardiography has limitations. The technique is highly dependent on acoustic windows and observer experience and has limited spatial resolution, which may make it difficult to differentiate between epicardial and pericardial fat . Moreover, the sole quantification of EAT thickness around the right ventricular free wall may be insufficient, because the distribution of this fat depot around the heart is not uniform, and there may exist interindividual differences . In recent studies, the role of magnetic resonance imaging and computed tomography (CT) to detect and quantify EAT has been emphasized . These techniques, in contrast to transthoracic echocardiography, also allow the volumetric quantification of EAT, which may be more exact and reproducible compared to simple thickness measurement at the right ventricular free wall.
Get Radiology Tree app to read full this article<
Materials and methods
Study Population
Get Radiology Tree app to read full this article<
Computed Tomographic Image Acquisition Protocol
Get Radiology Tree app to read full this article<
Coronary Angiography
Get Radiology Tree app to read full this article<
Measurements
Get Radiology Tree app to read full this article<
EAT Measurements
Get Radiology Tree app to read full this article<
Measurement of EAT thickness
Get Radiology Tree app to read full this article<
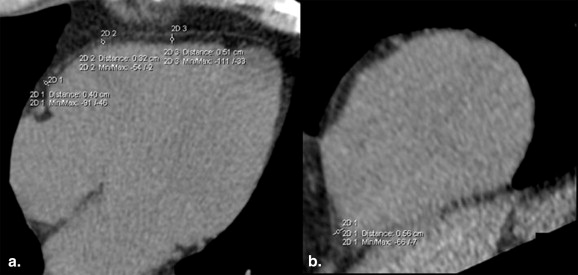
Get Radiology Tree app to read full this article<
Volumetric assessment of EAT
Get Radiology Tree app to read full this article<
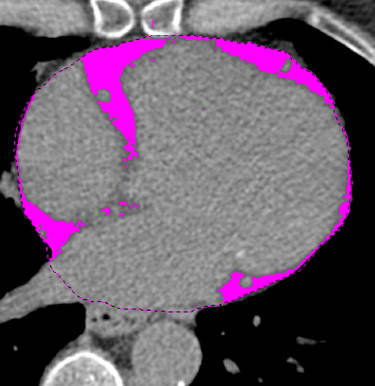
Get Radiology Tree app to read full this article<
CAC Scoring
Get Radiology Tree app to read full this article<
Severity of CAD
Get Radiology Tree app to read full this article<
Statistical Analysis
Get Radiology Tree app to read full this article<
Results
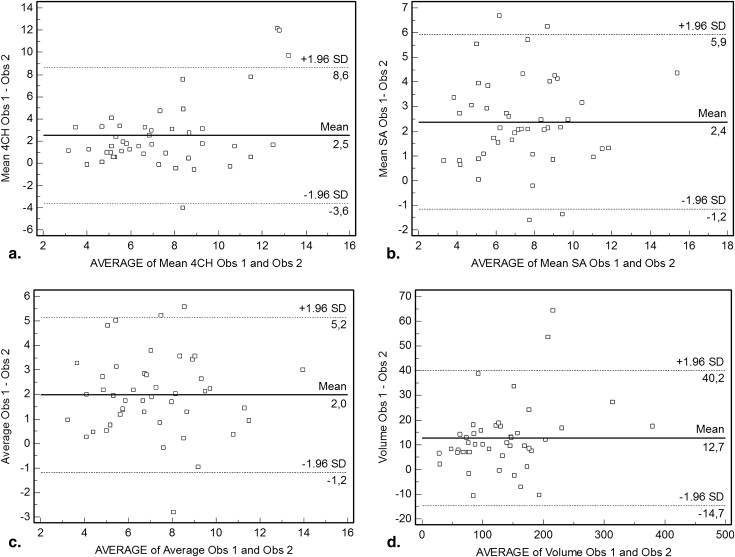
Reproducibility and Interobserver Agreement
Get Radiology Tree app to read full this article<
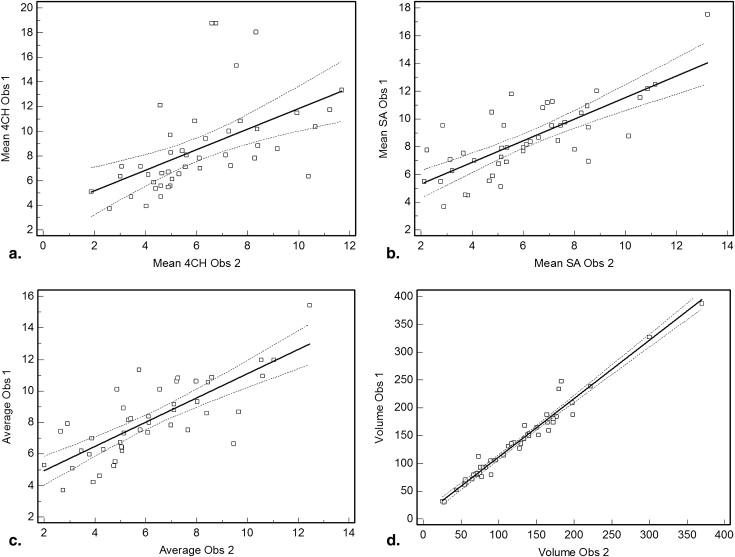
Table 1
Assessments of Interobserver Variability for Estimation of EAT Volume and EAT Thickness Measurements
Parameter CCC Pearson ρ
(95% Confidence Interval) Bias Correction Factor C b EAT thickness (mm) EAT-4CH 0.37 0.53 (0.29–0.72) 0.69 EAT-SA 0.53 0.76 (0.59–0.86) 0.70 Average-EAT 0.58 0.78 (0.63–0.87) 0.75 EAT volume (ml) 0.96 0.98 (0.97–0.99) 0.98
EAT, epicardial adipose tissue; EAT-4CH, epicardial adipose tissue thickness measured in the four-chamber view; EAT-SA, epicardial adipose tissue thickness measured in the short-chamber view; SD, standard deviation; CCC, concordance correlation coefficient. Pearson ρ indicates precision; Bias correction factor C b indicates accuracy.
Get Radiology Tree app to read full this article<
Prevalence of Atherosclerotic Disease
Get Radiology Tree app to read full this article<
Table 2
Gender-related Differences in Individuals With and Without Significant Coronary Artery Stenosis (SCAS)
Male Female_P_ SCAS Age (years) 60.81 ± 11.48 65 ± 8.64 NS BMI (kg/m 2 ) 30.02 ± 3.13 28.96 ± 5.45 NS CAC Agatston score 394 (0–1870.5) 88 (0–1119) NS Gensini score 48.25 (27.5–156) 36 (27–70.5) NS No SCAS Age (years) 54 ± 9.49 55.93 ± 8.62 NS BMI (kg/m 2 ) 27.49 ± 7.74 29.15 ± 6.86 NS CAC Agatston score 0 (0–34) 0 (0–54) NS Gensini score 14 (3–76) 29 (3–99) NS
BMI, body mass index; CAC, coronary artery calcification; NS, not significant.
Get Radiology Tree app to read full this article<
EAT Quantification
Get Radiology Tree app to read full this article<
Table 3
Epicardial Adipose Tissue Quantification in Individuals With and Without Significant Coronary Artery Stenosis (SCAS)
Parameter SCAS No SCAS_P_ EAT thickness (mm) EAT-4CH 9.45 ± 4.12 7.77 ± 2.98 NS EAT-SA 8.99 ± 2.19 8.13 ± 3.03 NS Average-EAT 8.57 ± 2.08 7.69 ± 2.68 NS EAT volume (ml) 154.58 ± 58.91 120.94 ± 81.85 .016
EAT, epicardial adipose tissue; EAT-4CH, epicardial adipose tissue thickness measured in the four-chamber view; EAT-SA, epicardial adipose tissue thickness measured in the short-chamber view; NS, not significant.
Table 4
Gender-related Differences in Epicardial Fat Measurements in Individuals With and Without Significant Coronary Artery Stenosis (SCAS)
Male Female_P_ SCAS EAT thickness (mm) EAT-4CH 9.41 ± 4.09 9.53 ± 4.53 NS EAT-SA 8.89 ± 1.93 9.22 ± 2.88 NS Average-EAT 8.48 ± 1.85 8.78 ± 2.70 NS EAT volume (ml) 166.26 ± 64.10 127.89 ± 35.45 NS No SCAS EAT thickness (mm) EAT-4CH 7 ± 1.97 8.12 ± 3.35 NS EAT-SA 7.97 ± 2.33 8.20 ± 3.38 NS Average-EAT 7.48 ± 2.13 7.79 ± 2.97 NS EAT volume (ml) 142.42 ± 71.16 110.93 ± 86.84 NS
EAT, epicardial adipose tissue, EAT-4CH, epicardial adipose tissue thickness measured in the four-chamber view; EAT-SA, epicardial adipose tissue thickness measured in the short-chamber view; NS, not significant.
Table 5
Overall Correlation of Epicardial Adipose Tissue Measurements to Age, BMI, and CAC Agatston Score
Age (years) BMI CAC Agatston Score Gensini Score Parameter_r__P__r__P__r__P__r__P_ EAT thickness (mm) EAT-4CH 0.203 NS 0.325 0.029 0.114 NS 0.384 0.009 EAT-SA 0.148 NS 0.382 0.01 0.123 NS 0.347 0.020 Average-EAT 0.158 NS 0.376 0.011 0.115 NS 0.346 0.020 EAT volume (ml) 0.215 NS 0.432 0.003 0.368 0.013 0.43 0.003
BMI, body mass index; CAC, coronary artery calcification; EAT, epicardial adipose tissue; EAT-4CH, epicardial adipose tissue thickness measured in the four-chamber view; EAT-SA, epicardial adipose tissue thickness measured in the short-chamber view; NS, not significant.
Get Radiology Tree app to read full this article<
Discussion
Get Radiology Tree app to read full this article<
Get Radiology Tree app to read full this article<
Get Radiology Tree app to read full this article<
Get Radiology Tree app to read full this article<
Get Radiology Tree app to read full this article<
Get Radiology Tree app to read full this article<
Get Radiology Tree app to read full this article<
References
1. Fox C.S., Massaro J.M., Hoffmann U., et. al.: Abdominal visceral and subcutaneous adipose tissue compartments: association with metabolic risk factors in the Framingham Heart Study. Circulation 2007; 116: pp. 39-48.
2. Iacobellis G., Assael F., Ribaudo M.C., et. al.: Epicardial fat from echocardiography: a new method for visceral adipose tissue prediction. Obes Res 2003; 11: pp. 304-310.
3. Kahn H.S., Austin H., Williamson D.F., et. al.: Simple anthropometric indices associated with ischemic heart disease. J Clin Epidemiol 1996; 49: pp. 1017-1024.
4. Lemieux S., Prud’homme D., Moorjani S., et. al.: Do elevated levels of abdominal visceral adipose tissue contribute to age-related differences in plasma lipoprotein concentrations in men?. Atherosclerosis 1995; 118: pp. 155-164.
5. Nicklas B.J., Penninx B.W., Ryan A.S., et. al.: Visceral adipose tissue cutoffs associated with metabolic risk factors for coronary heart disease in women. Diabetes Care 2003; 26: pp. 1413-1420.
6. Goodpaster B.H., Krishnaswami S., Resnick H., et. al.: Association between regional adipose tissue distribution and both type 2 diabetes and impaired glucose tolerance in elderly men and women. Diabetes Care 2003; 26: pp. 372-379.
7. Kanaya A.M., Harris T., Goodpaster B.H., et. al.: Adipocytokines attenuate the association between visceral adiposity and diabetes in older adults. Diabetes Care 2004; 27: pp. 1375-1380.
8. Ding J., Visser M., Kritchevsky S.B., et. al.: The association of regional fat depots with hypertension in older persons of white and African American ethnicity. Am J Hypertens 2004; 17: pp. 971-976.
9. Mazurek T., Zhang L., Zalewski A., et. al.: Human epicardial adipose tissue is a source of inflammatory mediators. Circulation 2003; 108: pp. 2460-2466.
10. Iacobellis G., Leonetti F.: Epicardial adipose tissue and insulin resistance in obese subjects. J Clin Endocrinol Metab 2005; 90: pp. 6300-6302.
11. Iacobellis G., Ribaudo M.C., Assael F., et. al.: Echocardiographic epicardial adipose tissue is related to anthropometric and clinical parameters of metabolic syndrome: a new indicator of cardiovascular risk. J Clin Endocrinol Metab 2003; 88: pp. 5163-5168.
12. Willens H.J., Byers P., Chirinos J.A., et. al.: Effects of weight loss after bariatric surgery on epicardial fat measured using echocardiography. Am J Cardiol 2007; 99: pp. 1242-1245.
13. Wheeler G.L., Shi R., Beck S.R., et. al.: Pericardial and visceral adipose tissues measured volumetrically with computed tomography are highly associated in type 2 diabetic families. Invest Radiol 2005; 40: pp. 97-101.
14. Chaldakov G.N., Stankulov I.S., Aloe L.: Subepicardial adipose tissue in human coronary atherosclerosis: another neglected phenomenon. Atherosclerosis 2001; 154: pp. 237-238.
15. Baker A.R., Silva N.F., Quinn D.W., et. al.: Human epicardial adipose tissue expresses a pathogenic profile of adipocytokines in patients with cardiovascular disease. Cardiovasc Diabetol 2006; 5: pp. 1.
16. Rosito G.A., Massaro J.M., Hoffmann U., et. al.: Pericardial fat, visceral abdominal fat, cardiovascular disease risk factors, and vascular calcification in a community-based sample: the Framingham Heart Study. Circulation 2008; 117: pp. 605-613.
17. de Vos A.M., Prokop M., Roos C.J., et. al.: Peri-coronary epicardial adipose tissue is related to cardiovascular risk factors and coronary artery calcification in post-menopausal women. Eur Heart J 2008; 29: pp. 777-783.
18. Sarin S., Wenger C., Marwaha A., et. al.: Clinical significance of epicardial fat measured using cardiac multislice computed tomography. Am J Cardiol 2008; 102: pp. 767-771.
19. Chaowalit N., Somers V.K., Pellikka P.A., et. al.: Subepicardial adipose tissue and the presence and severity of coronary artery disease. Atherosclerosis 2006; 186: pp. 354-359.
20. Jeong J.W., Jeong M.H., Yun K.H., et. al.: Echocardiographic epicardial fat thickness and coronary artery disease. Circ J 2007; 71: pp. 536-539.
21. Taguchi R., Takasu J., Itani Y., et. al.: Pericardial fat accumulation in men as a risk factor for coronary artery disease. Atherosclerosis 2001; 157: pp. 203-209.
22. Prescott M.F., McBride C.K., Venturini C.M., et. al.: Leukocyte stimulation of intimal lesion formation is inhibited by treatment with diclofenac sodium and dexamethasone. J Cardiovasc Pharmacol 1989; 6: pp. S76-S81.
23. Zhang L., Zalewski A., Liu Y., et. al.: Diabetes-induced oxidative stress and low-grade inflammation in porcine coronary arteries. Circulation 2003; 108: pp. 472-478.
24. Abbara S., Desai J.C., Cury R.C., et. al.: Mapping epicardial fat with multi-detector computed tomography to facilitate percutaneous transepicardial arrhythmia ablation. Eur J Radiol 2006; 57: pp. 417-422.
25. Flüchter S., Haghi D., Dinter D., et. al.: Volumetric assessment of epicardial adipose tissue with cardiovascular magnetic resonance imaging. Obesity (Silver Spring) 2007; 15: pp. 870-878.
26. Tansey D.K., Aly Z., Sheppard M.N.: Fat in the right ventricle of the normal heart. Histopathology 2005; 46: pp. 98-104.
27. Gorter P.M., van Lindert A.S., de Vos A.M., et. al.: Quantification of epicardial and peri-coronary fat using cardiac computed tomography; reproducibility and relation with obesity and metabolic syndrome in patients suspected of coronary artery disease. Atherosclerosis 2008; 197: pp. 896-903.
28. Shapiro M.D., Pena A.J., Nichols J.H., et. al.: Efficacy of pre-scan beta-blockade and impact of heart rate on image quality in patients undergoing coronary multidetector computed tomography angiography. Eur J Radiol 2008; 66: pp. 37-41.
29. Pepine C.J., Allen H.D., Bashore T.M., et. al.: ACC/AHA guidelines for cardiac catheterization and cardiac catheterization laboratories. American College of Cardiology/American Heart Association Ad Hoc Task Force on Cardiac Catheterization. Circulation 1991; 84: pp. 2213-2247.
30. Agatston A.S., Janowitz W.R., Hildner F.J., et. al.: Quantification of coronary artery calcium using ultrafast computed tomography. J Am Coll Cardiol 1990; 15: pp. 827-832.
31. Gensini G.G.: A more meaningful scoring system for determining the severity of coronary heart disease. Am J Cardiol 1983; 51: pp. 606.
32. Lin L.I.: A concordance correlation coefficient to evaluate reproducibility. Biometrics 1989; 45: pp. 255-268.
33. Rumberger J.A., Simons D.B., Fitzpatrick L.A., et. al.: Coronary artery calcium area by electron-beam computed tomography and coronary atherosclerotic plaque area. A histopathologic correlative study. Circulation 1995; 92: pp. 2157-2162.
34. Schejbal V.: Epicardial fatty tissue of the right ventricle—morphology, morphometry and functional significance [article in German]. Pneumologie 1989; 43: pp. 490-499.
35. Ahn S.G., Lim H.S., Joe D.Y., et. al.: Relationship of epicardial adipose tissue by echocardiography to coronary artery disease. Heart 2008; 94: e7
36. Callister T.Q., Cooil B., Raya S.P., et. al.: Coronary artery disease: improved reproducibility of calcium scoring with an electron-beam CT volumetric method. Radiology 1998; 208: pp. 807-814.
37. Hong C., Bae K.T., Pilgram T.K., et. al.: Coronary artery calcium measurement with multi-detector row CT: in vitro assessment of effect of radiation dose. Radiology 2002; 225: pp. 901-906.
38. Ulzheimer S., Kalender W.A.: Assessment of calcium scoring performance in cardiac computed tomography. Eur Radiol 2003; 13: pp. 484-497.
39. Shemesh J., Evron R., Koren-Morag N., et. al.: Coronary artery calcium measurement with multi-detector row CT and low radiation dose: comparison between 55 and 165 mAs. Radiology 2005; 236: pp. 810-814.
40. Horiguchi J., Matsuura N., Yamamoto H., et. al.: Coronary artery calcium scoring on low-dose prospective electrocardiographically-triggered 64-slice CT. Acad Radiol 2009; 16: pp. 187-193.