
Rationale and Objectives
The clinimetric properties of blood oxygen level‒dependent (BOLD) magnetic resonance imaging (MRI) for assessment of musculoskeletal changes have been poorly investigated. The study objectives were to assess the interframework reliability of data acquisition of BOLD MRI and to test its convergent validity in chronic arthritis in a rabbit model of inflammatory arthritis as compared with corresponding clinical and laboratory measures.
Materials and Methods
One of the knees of 12 New Zealand male white rabbits was injected with a 1% carrageenin solution, and the contralateral (control) one was not. Twelve rabbits were euthanized on day 28 of arthritis (chronic arthritis). Clinical (joint diameters), laboratory (serum amyloid A concentration), and BOLD MRI measurements were obtained on days 0, 1, and 28 of arthritis. Twenty paradigms of data acquisition and analysis were applied.
Results
The most reliable MRI parameters set, regardless of threshold values used for data analysis, was spiral technique (level 1), 40 ms of echo time (level 2), 60 seconds of on_ and off_ paradigm (level 3) and carbogen mixture of gases (95% O2 + 5% CO2) (level 4). With regard to construct validity, BOLD imaging correlated moderately ( r = −.54, P < .0001) with knee diameters, and weakly ( r = −.35, P = .01) with laboratory indices (high threshold for analysis).
Conclusion
BOLD MRI has a substantial or excellent interframework reliability for assessment of arthritic rabbit knees; however, it correlates only moderately or poorly with clinical and laboratory measures. Nevertheless, this study supports further validation of BOLD MRI for assessment of soft tissue changes in a rabbit model of arthritis.
The clinical diagnosis of juvenile idiopathic arthritis is defined by a constellation of clinical signs present during the first 6 months of illness . However, at this point no single clinical and laboratory marker is able to accurately detect the disease and predict an unfavorable outcome (severe cartilage degeneration leading to functional handicap) early on during the course of the disease.
Blood oxygen level-dependent (BOLD) magnetic resonance imaging (MRI) is a noninvasive method that is dependent on changes in deoxyhemoglobin concentrations which in turn are inversely proportional to changes in local blood flow . This technique therefore holds promise for being used as a surrogate indicator of changes in tissue blood flow such as for increase in perisynovial tissue perfusion as a compensatory effect for hypoxia in early disease. In cases of responsive hypoxic tissues, the use of BOLD MRI allows measurement of the local vascular reactivity.
Get Radiology Tree app to read full this article<
Get Radiology Tree app to read full this article<
Get Radiology Tree app to read full this article<
Get Radiology Tree app to read full this article<
Get Radiology Tree app to read full this article<
 Open full size image
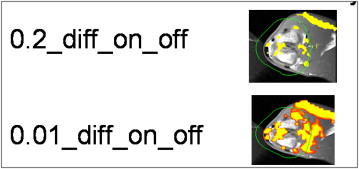
Figure 1
Analytic framework for data acquisition of blood oxygen level‒dependent (BOLD) magnetic resonance imaging (MRI) using two different setups for data analysis. Setup #1: Diff_on_off_0.2 vs Diff_on_off_0.01 (levels 1, 2, 3, and 4); setup #2: PT%_0.2 vs PT%_0.01 (levels 1, 2, 3, and 4).
Get Radiology Tree app to read full this article<
Materials and methods
Experimental Protocol
Get Radiology Tree app to read full this article<
Get Radiology Tree app to read full this article<
Get Radiology Tree app to read full this article<
Get Radiology Tree app to read full this article<
Imaging and Postimaging Protocol
Get Radiology Tree app to read full this article<
Get Radiology Tree app to read full this article<
Get Radiology Tree app to read full this article<
Get Radiology Tree app to read full this article<
Table 1
BOLD MRI Sequences that were Obtained at Each Time Point in this Study in Accordance with the Analytic Framework of Figure 1
Framework Level Type of Sequence Type of Readout Echo time (ms) On- and Off- paradigms (seconds) Stimulus 1 T2* GRESpiral 40 30 100% O2 1 T2* GREEcho-planar 40 30 100% O2 2 T2* GRE Spiral40 30 100% O2 2 T2* GRE Spiral20 30 100% O2 3 T2* GRE Spiral 4030 100% O2 3 T2* GRE Spiral 4060 100% O2 4 T2* GRE Spiral 40 30100% O2 4 T2* GRE Spiral 40 3095% O2 + 5% CO2
Test parameters are shown in bold type.
BOLD, blood oxygen level‒dependent; GRE, gradient-echo; MRI, magnetic resonance imaging.
Get Radiology Tree app to read full this article<
Imaging Analysis
Get Radiology Tree app to read full this article<
Get Radiology Tree app to read full this article<
Get Radiology Tree app to read full this article<
Get Radiology Tree app to read full this article<
EPI; TE = 40, 100% O2, 30 seconds diff on_off_0.2 EPI; TE = 40, 100% O2, 30 seconds PT%_0.2 EPI; TE = 40, 100% O2, 30 seconds diff_on_diff_0.01 EPI; TE = 40, 100% O2, 30 seconds PT%_0.01 Spiral; TE = 40, 100% O2, 30 seconds diff on_off_0.2 Spiral; TE = 40, 100% O2, 30 seconds PT%_0.2 Spiral; TE = 40, 100% O2, 30 seconds diff_on_diff_0.01 Spiral; TE = 40, 100% O2, 30 seconds PT%_0.01 Spiral; TE = 20, 100% O2, 30 seconds diff on_off_0.2 Spiral; TE = 20, 100% O2, 30 seconds PT%_0.2 Spiral; TE = 20, 100% O2, 30 seconds diff_on_diff_0.01 Spiral; TE = 20, 100% O2, 30 seconds PT%_0.01 Spiral; TE = 40, 100% O2, 60 seconds diff on_off_0.2 Spiral; TE = 40, 100% O2, 60 seconds PT%_0.2 Spiral; TE = 40, 100% O2, 60 seconds diff_on_diff_0.01 Spiral; TE = 40, 100% O2, 60 seconds PT%_0.01 Spiral; TE = 40, 95% O2 + 5% CO2, 30 seconds diff on_off_0.2 Spiral; TE = 40, 95% O2 + 5% CO2, 30 seconds PT%_0.2 Spiral; TE = 40, 95% O2 + 5% CO2, 30 seconds diff_on_diff_0.01 Spiral; TE = 40, 95% O2 + 5% CO2, 30 seconds PT%_0.01
Get Radiology Tree app to read full this article<
Get Radiology Tree app to read full this article<
Clinical Assessment
Get Radiology Tree app to read full this article<
Laboratory Assessment
Get Radiology Tree app to read full this article<
Get Radiology Tree app to read full this article<
Get Radiology Tree app to read full this article<
Statistical Analysis
Get Radiology Tree app to read full this article<
Get Radiology Tree app to read full this article<
Get Radiology Tree app to read full this article<
Get Radiology Tree app to read full this article<
Get Radiology Tree app to read full this article<
Results
Clinical Assessment of Arthritis
Get Radiology Tree app to read full this article<
Table 2
Clinical Measurements (Laterolateral and Anterior-posterior Diameters) of Injected and Non-injected Knees of Rabbits at Different Time Points of the Study
Injection Status Time Point (Day of Experiment) Laterolateral Diameter (mm) of Knees_P_ values (Between Injected and Noninjected Knees at Time Points) Anteroposterior Diameter (mm) of Knees_P_ values (Between Injected and Noninjected Knees at Time Points) Knee to be injected 0 19.45 0.77 35.60 .87 Knee not to be injected 0 19.33 35.27 Injected 1 21.37 0.003 39.72 .14 Noninjected 1 19.83 37.93 Injected 28 21.44 0.31 40.65 .55 Noninjected 28 20.71 39.80
Injections of carrageenin solution were performed on day 1 of the experiment.
Get Radiology Tree app to read full this article<
Inter-rabbit Reliability of BOLD MRI Measurements in Chronic Arthritic and Nonarthritic Knees
On- and off- differences using low (0.01) and high (0.2) thresholds
Get Radiology Tree app to read full this article<
Table 3
Inter-joint Reliability of BOLD MRI Measurements in Non-arthritic and Chronic Arthritic Knees using Different Thresholds for Data Analysis of On- and Off-change Differences
Thresholds Constants Diff_on_off_0.01 Diff_on_off_0.2 Kept constant TE = 40 ms, 100% O2, 30 seconds TE = 40 ms, 100% O2, 30 seconds ICC EPI (95% CIs) ICC Spiral (95% CIs) ICC EPI (95% CIs) ICC Spiral (95% CIs) Nonarthritic knees Nonarthritic knees Level 1: EPI vs. Spiral 0.86 (0.60–0.96) 0.87 (0.74–0.95) 0.86 (0.60–0.96) 0.83 (0.67–0.94) Narrower CIs Narrower CIs Arthritic knees Arthritic knees ∗ 0.56 (0.16–0.88) ∗ 0.67 (0.06–0.92) Narrower CIs Kept constant Spiral, 100% O2, 30 seconds Spiral, 100% O2, 30 seconds ICC 20 ms (95% CIs) ICC 40 ms (95% CIs) ICC 20 ms (95% CIs) ICC 40 ms (95% CIs) Nonarthritic knees Nonarthritic knees Level 2: 20 ms vs. 40 ms 0.79 (0.59–0.92) 0.84 (0.68–0.94) 0.66 (0.41–0.86) 0.83 (0.67–0.94) Narrower CIs Arthritic knees Arthritic knees ∗ ∗ ∗ 0.67 (0.06–0.92) Kept constant Spiral, TE = 40 ms, 100% O2 Spiral, TE = 40 ms, 100% O2 ICC 30 seconds (95% CIs) ICC 60 seconds (95% CIs) ICC 30 seconds (95% CIs) ICC 60 seconds (95% CIs) Nonarthritic knees Nonarthritic knees Level 3: 30 seconds vs. 60 seconds 0.84 (0.68–0.94) 0.91 (0.75–0.97) 0.80 (0.62–0.93) 0.95 (0.86–0.99) Narrower CIs Narrower CIs Kept constant Spiral, TE = 40 ms, 30 seconds Spiral, TE = 40 ms, 30 seconds ICC 100% O2 (95% CIs) ICC 95% O2 + 5% CO2 (95% CIs) ICC 100% O2 (95% CIs) ICC 95% O2 + 5% CO2 (95% CIs) Nonarthritic knees Nonarthritic knees Level 4: 100 O2 vs. 95% O2 + 5% CO2 0.80 (0.62–0.93) 0.92 (0.77–0.98) 0.80 (0.62–0.93) 0.93 (0.79–0.98) 95% O2+5% CO2 Narrower CIs Narrower CIs Arthritic knees Arthritic knees ∗ ∗ 0.53 (0.16–0.88)
ICC, intraclass correlation coefficients; 95% CIs, 95% coefficient intervals.
Get Radiology Tree app to read full this article<
Get Radiology Tree app to read full this article<
Get Radiology Tree app to read full this article<
Get Radiology Tree app to read full this article<
Get Radiology Tree app to read full this article<
Get Radiology Tree app to read full this article<
Get Radiology Tree app to read full this article<
Percentage of activated voxels (PT%) using low (0.01) and high (0.2) thresholds
Get Radiology Tree app to read full this article<
Table 4
Inter-joint Reliability of BOLD MRI Measurements in Nonarthritic and Chronic Arthritic Knees Using Different Thresholds for Data Analysis of Percentage of Activated Voxels
Thresholds Constants PT%_0.01 PT%_0.2 Kept constant TE = 40 ms, 100% O2, 30 seconds TE = 40 ms, 100% O2, 30 seconds ICC EPI (95% CIs) ICC Spiral (95% CIs) ICC EPI (95% CIs) ICC Spiral (95% CIs) Nonarthritic knees Nonarthritic knees Level 1: EPI vs. spiral 0.61 (0.10–0.87) 0.80 (0.62–0.92) 0.61 (0.11–0.87) 0.39 (0.12–0.70) Narrower CIs Suboptimal lower CI Kept constant Spiral, 100% O2, 30 seconds Spiral, 100% O2, 30 sec ICC 20 ms (95% CIs) ICC 40 ms (95% CIs) ICC 20 ms (95% CIs) ICC 40 ms (95% CIs) Nonarthritic knees Nonarthritic knees Level 2: 20 ms vs. 40 ms 0.67 (0.43–0.87) 0.81 (0.64–0.93) 0.63 (0.38–0.85) 0.42 (0.14–0.72) Narrower CIs Suboptimal lower CI Kept constant Spiral, TE = 40 ms, 100% O2 Spiral, TE = 40 ms, 100% O2 ICC 30 seconds (95% CIs) ICC 60 seconds (95% CIs) ICC 30 seconds (95% CIs) ICC 60 seconds (95% CIs) Non-arthritic knees Non-arthritic knees Level 3: 30 seconds vs. 60 seconds 0.80 (0.62–0.92) 0.94 (0.82–0.98) 0.42 (0.14–0.72) 0.88 (0.67–0.96) Narrower CIs Narrower CIs Kept constant Spiral, TE = 40 ms, 30 seconds ICC 100% O2 (95% CIs) ICC 95% O2 + 5% CO2 (95% CIs) ICC 100% O2 (95% CIs) ICC 95% O2 + 5% CO2 (95% CIs) Nonarthritic knees Nonarthritic knees Level 4: 100 O2 vs. 95% O2 + 5% CO2 0.80 (0.62–0.92) 0.77 (0.41–0.92) 0.39 (0.12–0.70) 0.72 (0.33–0.91) Suboptimal lower CI Kept constant Spiral, TE = 40 ms, 30 seconds ICC 100% O2 (95% CIs) ICC 95% O2 + 5% CO2 (95% CIs) ICC 100% O2 (95% CIs) ICC 95% O2 + 5% CO2 (95% CIs) Level 4: 100 O2 vs. 95% O2 + 5% CO2 Arthritic knees Arthritic knees ∗ 0.63 (0.02–0.91) ∗ 0.64 (0.07–0.91)
ET, echo time; ICC, intraclass correlation coefficients; 95% CIs, 95% coefficient intervals, PT%, percentage of activated voxels.
Get Radiology Tree app to read full this article<
Get Radiology Tree app to read full this article<
Get Radiology Tree app to read full this article<
Convergent validity of BOLD MRI measurements and clinical and laboratory constructs
Get Radiology Tree app to read full this article<
Table 5
Overall Convergent Validity of BOLD MRI Measurements (Most Reliable Set of Parameters) and Clinical and Laboratory Constructs in Carrageenin-injected Rabbits Considering the Different Time Points of the Study (Days 0, 1, and 28 after Induction of Arthritis)
BOLD MRI Parameters’ Sets Anteroposterior Knee Diameters (mm) Serum Concentration of VEGF Serum Concentration of Amyloid A Data acquisition:
Spiral, TE = 40 ms, 60 seconds (time interval paradigm), 95% O2+5% CO2 (stimulus) Data analysis:
high threshold = 0.2r = −.54
P < .0001r = .34
P = .006r = −.35
P = .01 Data analysis:
low threshold = 0.01r = −.51
P < .0001r = .47
P = .0001r = −.32
P = .02 Data acquisition:
Spiral, TE = 40 ms, 30 seconds (time interval paradigm), 100% O2 (stimulus) Data analysis:
high threshold = 0.2r = −.58
P < .0001r = .35
P = .003r = −.33
P = .01
BOLD MRI parameters’ sets Anteroposterior knee diameters Serum concentration of VEGF Serum concentration of amyloid A Data acquisition:
Spiral, TE = 40 ms, 30 seconds (time interval paradigm), 100% O2 (stimulus) Data analysis:
low threshold = 0.01r = −.50
P < .0001r = .39
P = .001r = −.26
P = .01
ms, milliseconds; sec, seconds; TE, echo time; VEGF, vascular endothelial growth factor.
By applying Bonferroni’s correction for data acquisition multitesting a P value < .006 was considered statistically significant.
Get Radiology Tree app to read full this article<
Get Radiology Tree app to read full this article<
Discussion
Get Radiology Tree app to read full this article<
Get Radiology Tree app to read full this article<
Get Radiology Tree app to read full this article<
Get Radiology Tree app to read full this article<
Get Radiology Tree app to read full this article<
Get Radiology Tree app to read full this article<
Get Radiology Tree app to read full this article<
Get Radiology Tree app to read full this article<
Get Radiology Tree app to read full this article<
Get Radiology Tree app to read full this article<
Acknowledgments
Get Radiology Tree app to read full this article<
References
1. Brewer E.J., Bass J., Baum J., et. al.: Current proposed revision of JRA Criteria. JRA Criteria Subcommittee of the Diagnostic and Therapeutic Criteria Committee of the American Rheumatism Section of The Arthritis Foundation. Arthritis Rheum 1977; 20: pp. 195-199.
2. Cassidy J.T., Levinson J.E., Bass J.C., et. al.: A study of classification criteria for a diagnosis of juvenile rheumatoid arthritis. Arthritis Rheum 1986; 29: pp. 274-281.
3. Prisman E., Slessarev M., Han J., et. al.: Comparison of the effect of independently-controlled end-tidal pCO2 and pO2 on blood oxygen level-dependent (BOLD) MRI. J Magn Reson Imag 2008; 27: pp. 185-191.
4. Bulte D.P., Alfonsi J., Bells S., et. al.: Vasomodulation of skeletal muscle BOLD signal. J Magn Reson Imaging 2006; 24: pp. 886-890.
5. Noseworthy M.D., Bulte D.P., Alfonsi J.: BOLD magnetic resonance imaging of skeletal muscle. Semin Musculoskel Radiol 2003; 7: pp. 307-315.
6. Doria A.S., Dick P.: Region-of-interest-based analysis of clustered BOLD MRI data in experimental arthritis. Acad Radiol 2005; 12: pp. 841-852.
7. Doria A.S., Noseworthy M.D., Oakden W., et. al.: Dynamic contrast-enhanced MRI quantification of synovium microcirculation in experimental arthritis. Am J Roentgenol 2006; 186: pp. 1165-1171.
8. de Vet H., Terwee C., Bouter L.: Current challenges in clinimetrics. J Clin Epidemiol 2003; 56: pp. 1137-1141.
9. Zou K.H., Greve D.N., Wang M., et. al., FIRST BIRN Research Group: Reproducibility of functional MR imaging: preliminary results of prospective multi-institutional study performed by Biomedical Informatics Research Network. Radiology 2005; 237: pp. 781-789.
10. Boxerman J.L., Bandettini P.A., Kwong K.K., et. al.: The intravascular contribution to fMRI signal change: Monte Carlo modeling and diffusion-weighted studies in vivo. Magn Reson Med 1995; 34: pp. 4-10.
11. Mazurchuk R., Zhou R., Straubinger R.M., et. al.: Functional magnetic resonance (fMR) imaging of a rat brain tumor model: implications for evaluation of tumor microvasculature and therapeutic response. Magn Reson Imaging 1999; 17: pp. 537-548.
12. Portney L.G., Watkins M.P.: Validity of measurements.Portney L.G.Watkins M.P.Foundations of clinical research. Applications to practice.2000.Prentice Hall HealthUpper Saddle River, NJ:pp. 79-110.
13. Imrie R.C.: Animal models of arthritis. Lab Anim Sci 1976; 26: pp. 345-351.
14. Di Sabato G.: Methods in enzymology. Immunochemical techniques.1988.Academic Press Inc.San Diego, CA
15. Motohashi N., Nakamichi Y., Mori I., et. al.: Concentration and degradation of hyaluronic acid in knee synovial fluid from carrageenin-induced rabbit arthritis. Chem Pharm Bull (Tokyo) 1990; 38: pp. 1953-1956.
16. van Dijke C.F., Peterfy C.G., Brasch R.C., et. al.: MR imaging of the arthritic rabbit knee joint using albumin-(Gd-DTPA)30 with correlation to histopathology. Magn Reson Imaging 1999; 17: pp. 237-245.
17. Glover G.H., Lai S.: Self-navigated spiral fMRI: interleaved versus single-shot. Magn Reson Med 1998; 39: pp. 361-368.
18. Frahm J., Merboldt K.D., Hanicke W.: Functional MRI of human brain activation at high spatial resolution. Magn Reson Med 1993; 29: pp. 139-144.
19. Resnick D.: Common disorders of synovium-lined joints: pathogenesis, imaging abnormalities, and complications. AJR Am J Roentgenol 1988; 151: pp. 1079-1093.
20. Kane D., Roth J., Frosch M., et. al.: Increased perivascular synovial membrane expression of myeloid-related proteins in psoriatic arthritis. Arthritis Rheum 2003; 48: pp. 1676-1685.
21. Roth J., Teigelkamp S., Wilke M., et. al.: Complex pattern of the myelo-monocytic differentiation antigens MRP8 and MRP14 during chronic airway inflammation. Immunobiology 1992; 186: pp. 304-314.
22. Brenchley P.E.C.: Antagonising angiogenesis in rheumatoid arthritis. Ann Rheum Dis 2001; 60: pp. iii71-iii74.
23. Alikacem N., Yoshizawa T., Nelson K.D., et. al.: Quantitative MR imaging study of intravitreal sustained release of VEGF in rabbits. Invest Ophthalmol Vis Sci 2000; 41: pp. 1561-1569.
24. Streiner D.L., Norman G.R.: Reliability.Streiner D.L.Norman G.R.Health measurement scales: a practical guide to their development and use.2001.Oxford University PressOxford:pp. 104-127.
25. Altman D.G.: Practical statistics for medical research.1991.Chapman and HallLondon, UK
26. Fleiss J.L.: Statistical methods for rates and proportions.1981.WileyNew York
27. Hanley J.A., McNeil B.J.: The meaning and use of the area under a receiver operating characteristic (ROC) curve. Radiology 1982; 143: pp. 29-36.
28. Norman G.R., Streiner D.L.: More than two groups.Norman G.R.Streiner D.L.Biostatistics. The bare essentials.2000.B.C. Becker Inc.Hamilton, ON:pp. 68-78.
29. Losert C., Peller M., Schneider P., et. al.: Oxygen-enhanced MRI of the brain. Magn Reson Med 2002; 48: pp. 271-277.
30. Simon-Zoula S.C., Boesch C., De Keyzer F., et. al.: Functional imaging of the parotid glands using blood oxygenation level dependent (BOLD)-MRI at 1.5T and 3T. J Magn Reson Imaging 2008; 27: pp. 43-48.
31. Howe F.A., Robinson S.P., Rodrigues L.M., et. al.: Flow and oxygenation dependent (FLOOD) contrast MR imaging to monitor the response of rat tumors to carbogen breathing. Magn Reson Imaging 1999; 17: pp. 1307-1318.
32. Dorner G.T., Garhoefer G., Zawinka C., et. al.: Response of retinal blood flow to CO2-breathing in humans. Eur J Ophthalmol 2002; 12: pp. 459-466.
33. Mas A., Saura P., Joseph D., et. al.: Effect of acute moderate changes in PaCO2 on global hemodynamics and gastric perfusion. Crit Care Med 2000; 28: pp. 360-365.
34. Watson N.A., Beards S.C., Altaf N., et. al.: The effect of hyperoxia on cerebral blood flow: a study in healthy volunteers using magnetic resonance phase-contrast angiography. Eur J Anaesthesiol 2000; 17: pp. 152-159.
35. Ojemann J.G., Buckner R.L., Akbudak E., et. al.: Functional MRI studies of word-stem completion: reliability across laboratories and comparison to blood flow imaging with PET. Hum Brain Mapp 1998; 6: pp. 203-215.
36. Ledermann H.P., Heidecker H.G., Schulte A.C., et. al.: Calf muscles imaged at BOLD MR: correlation with TcPO2 and flowmetry measurements during ischemia and reactive hyperemia—initial experience. Radiology 2006; 241: pp. 477-484.
37. Bern R.M., Levy M.N.: Principles of physiology.1996.John Wiley and SonsNew York
38. Zandbelt B.B., Gladwin T.E., Raemaekers M., et. al.: Within-subject variation in BOLD-fMRI signal changes across repeated measurements: quantification and implications for sample size. Neuroimage 2008; 42: pp. 196-206.