
Rationale and Objectives
The aim of this study was to evaluate the reliability and validity of soft copy images based on flat-panel detector of digital radiography (DR-FPD soft copy images) compared to analog radiographs (ARs) in pneumoconiosis classification and diagnosis.
Materials and Methods
DR-FPD soft copy images and ARs from 349 subjects were independently read by four-experienced readers according to the International Labor Organization 2000 guidelines. DR-FPD soft copy images were used to obtain consensus reading (CR) by all readers as the gold standard. Reliability and validity were evaluated by a κ and receiver operating characteristic analysis, respectively.
Results
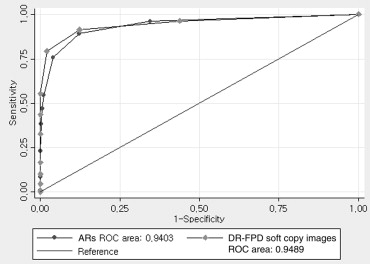
In small opacity, overall interreader agreement of DR-FPD soft copy images was significantly higher than that of ARs, but it was not significantly different in large opacity and costophrenic angle obliteration. In small opacity, agreement of DR-FPD soft copy images with CR was significantly higher than that of ARs with CR. It was also higher than that of ARs with CR in pleural plaque and thickening. Receiver operating characteristic areas were not different significantly between DR-FPD soft copy images and ARs.
Conclusions
DR-FPD soft copy images showed accurate and reliable results in pneumoconiosis classification and diagnosis compared to ARs.
Pneumoconiosis develops as a result of exposure to dusts, and chest radiography remains the first diagnostic step for the evaluation of lung parenchymal and pleural diseases . Chest analog radiographs based on film with screen (ARs) have been used as the standard method for recognizing pneumoconiosis according to the International Labor Organization (ILO) 2000 guidelines by referring to the 22 standard analog radiographs (SARs) . This is because they have relatively lower costs, good image quality, and high spatial resolution.
Since digital technology was first introduced in the early 1980s , chest digital radiography (DR) has resulted in a significant reduction of radiation dose without loss of image quality compared with ARs , as well as improvement of diagnostic performance and work flow. Consequently, it offers an instant image display, a wide dynamic range, an exposure latitude, postprocessing, and greater imaging efficiency .
Get Radiology Tree app to read full this article<
Get Radiology Tree app to read full this article<
Get Radiology Tree app to read full this article<
Get Radiology Tree app to read full this article<
Materials and methods
Subjects
Get Radiology Tree app to read full this article<
Table 1
Equipment and Exposure Conditions of Chest Radiography Used in This Study
Parameters Digital Radiography Analog Radiography Korean Guidelines ∗ Model Digital Diagnost, Philips MXO-15B, Toshiba – Generator 150 kVp, 1100 mA 150 kVp, 500 mA >125 kVp, 300 mA Tube voltage (kVp) 125 124 ≥120 Tube current (mA) 640 500 ≥300 Phototimer (sec) AEC 0.005 <0.03 Filtration 1.0 mm Al + 0.1 mm Cu 1.2 mm Al 1.0 mm Al + 0.1 mm Cu Grid ratio (moving) 12:1 12:1 >10:1 Detector type/film Amorphous silicon Fuji HR-C type Medium sensitivity ‡ Pixels/screen 300l × 300l (9 million) Fuji Grenex HR-4 medium Medium speed ‡ Pixel size/auto processor 143 μm (3.5 lp/mm) 90 sec/cycle † <90 sec ‡
AEC, automatic exposure control.
Exposure conditions (tube voltage and current, phototimer) were for the standard size of subject (weight 75 kg).
Get Radiology Tree app to read full this article<
Get Radiology Tree app to read full this article<
Get Radiology Tree app to read full this article<
Get Radiology Tree app to read full this article<
Get Radiology Tree app to read full this article<
Radiological Examinations
Get Radiology Tree app to read full this article<
Get Radiology Tree app to read full this article<
Get Radiology Tree app to read full this article<
Pneumoconiosis Classification According to ILO Guidelines
Get Radiology Tree app to read full this article<
Get Radiology Tree app to read full this article<
Statistical Analysis
Get Radiology Tree app to read full this article<
Ethics Statement
Get Radiology Tree app to read full this article<
Results
Effect of Technical Image Quality for Inter-reader Agreement
Get Radiology Tree app to read full this article<
Table 2
Interreader Agreement for Small Opacity According to Technical Image Quality
Technical Image Quality Overall κ Value (SE) 95% CI DR-FPD with CR Satisfied 0.66 (0.23) 0.62 to 0.70 Unsatisfied 0.45 (0.21) 0.41 to 0.49 ARs with CR Satisfied 0.52 (0.21) 0.48 to 0.56 Unsatisfied 0.34 (0.21) 0.30 to 0.38
DR-FPD, soft copy images based on flat-panel detector of digital radiography; ARs, analog radiographs; CR, consensus reading; SE, standard error; CI, confidence interval.
Technical image quality of DR-FPD soft copy images and ARs was divided as either satisfied group (grade 1 and 2) or unsatisfied group (grade 3), and small opacity was classified as four categories according to the ILO guidelines.
Get Radiology Tree app to read full this article<
Reliability of DR-FPD Soft Copy Images and ARs in Pneumoconiosis Classification
Get Radiology Tree app to read full this article<
Table 3
Intrareader Agreement of DR-FPD Soft Copy Images with ARs for Small and Large Opacities and CPAO
Reader Small Opacity Large Opacity CPAO R1 0.54 (0.46 to 0.61) 0.69 (0.58 to 0.79) 0.58 (0.33 to 0.82) R2 0.51 (0.43 to 0.59) 0.60 (0.47 to 0.71) 0.59 (0.47 to 0.69) R3 0.46 (0.38 to 0.52) 0.51 (0.40 to 0.62) 0.61 (0.42 to 0.79) R4 0.59 (0.51 to 0.67) 0.48 (0.37 to 0.57) 0.34 (0.23 to 0.45) Overall 0.52 (0.48 to 0.56) 0.57 (0.51 to 0.61) 0.49 (0.42 to 0.55)
DR-FPD, soft copy images based on flat-panel detector of digital radiography; ARs, analog radiographs; CPAO, costophrenic angle obliteration.
Small opacity was classified as four categories according to the ILO 2000 guidelines. Data are expressed as κ value with 95% confidence interval.
Get Radiology Tree app to read full this article<
Get Radiology Tree app to read full this article<
Table 4
Comparison of Interreader Agreement between DR-FPD Soft Copy Images and ARs for Small and Large Opacity and CPAO
Finding DR-FPD ARs Small opacity 0.50 (0.47 to 0.53) 0.39 (0.36 to 0.41) Large opacity 0.47 (0.42 to 0.51) 0.51 (0.46 to 0.55) CPAO 0.42 (0.37 to 0.46) 0.37 (0.31 to 0.43)
DR-FPD, soft copy images based on flat-panel detector of digital radiography; ARs, analog radiographs; CPAO, costophrenic angle obliteration.
Small opacity was classified as four categories according to the ILO 2000 guidelines. Data are expressed as overall κ value with 95% confidence interval by four readers.
Get Radiology Tree app to read full this article<
Validity of DR-FPD Soft Copy Images and ARs in Pneumoconiosis Classification
Get Radiology Tree app to read full this article<
Table 5
Comparison of Overall κ Values between DR-FPD Soft Copy Images with CR and ARs with CR for Parenchymal and Pleural Findings
Finding DR-FPD with CR ARs with CR Parenchymal Small opacity 0.66 (0.61 to 0.67) 0.51 (0.47 to 0.54) Large opacity 0.63 (0.57 to 0.68) 0.63 (0.57 to 0.68) Pleural CPAO 0.38 (0.31 to 0.45) 0.39 (0.31 to 0.47) PP Left 0.26 (0.17 to 0.36) 0.14 (0.05 to 0.22) Right 0.37 (0.29 to 0.45) 0.18 (0.11 to 0.24) DPT Left 0.29 (0.16 to 0.42) 0.21 (0.10 to 0.32) Right 0.20 (0.10 to 0.30) 0.11 (0.01 to 0.21)
DR-FPD, soft copy images based on flat-panel detector of digital radiography; ARs, analog radiographs; CR, consensus reading; CPAO, costophrenic angle obliteration; PP, pleural plaque; DPT, diffuse pleural thickening.
Small opacity was classified as four categories according to the ILO guidelines. Data are expressed as overall κ value with 95% confidence interval by four readers.
Get Radiology Tree app to read full this article<
Comparison of Diagnostic Performance between DR-FPD Soft Copy Images and ARs for Pneumoconiosis
Get Radiology Tree app to read full this article<
Get Radiology Tree app to read full this article<
Discussion
Get Radiology Tree app to read full this article<
Get Radiology Tree app to read full this article<
Get Radiology Tree app to read full this article<
Get Radiology Tree app to read full this article<
Get Radiology Tree app to read full this article<
Get Radiology Tree app to read full this article<
Get Radiology Tree app to read full this article<
Get Radiology Tree app to read full this article<
Get Radiology Tree app to read full this article<
Get Radiology Tree app to read full this article<
Get Radiology Tree app to read full this article<
Get Radiology Tree app to read full this article<
Get Radiology Tree app to read full this article<
Get Radiology Tree app to read full this article<
Get Radiology Tree app to read full this article<
Get Radiology Tree app to read full this article<
Acknowledgments
Get Radiology Tree app to read full this article<
Get Radiology Tree app to read full this article<
References
1. Wagner G.R., Attfield M.D., Parker J.E.: Chest radiography in dust-exposed miners: promise and problems, potential and imperfections. Occup Med 1993; 8: pp. 127-141.
2. International Labour Organisation : Guidelines for the use of ILO international classification of radiographs of pneumoconioses: Revised edition 2000.2002.International Labour OfficeGeneva, Switzerland
3. Sonoda M., Takano M., Miyahara J., et. al.: Computed radiography utilizing scanning laser stimulated luminescence. Radiology 1983; 148: pp. 833-838.
4. Fink C., Hallscheidt P.J., Noeldge G., et. al.: Clinical comparative study with a large-area amorphous silicon flat-panel detector: image quality and visibility of anatomic structures on chest radiography. AJR Am J Roentgenol 2002; 178: pp. 481-486.
5. Ganten M., Radeleff B., Kampschulte A., et. al.: Comparing image quality of flat-panel chest radiography with storage phosphor radiography and film-screen radiography. AJR Am J Roentgenol 2003; 181: pp. 171-176.
6. Garmer M., Hennigs S.P., Jäger H.J., et. al.: Digital radiography versus conventional radiography in chest imaging diagnostic performance of a large-area flat-panel detector in a clinical CT-controlled study. AJR Am J Roentgenol 2000; 174: pp. 75-80.
7. Rong X.J., Shaw C.C., Liu X., et. al.: Comparison of an amorphous silicon/cesium iodide flat-panel digital chest radiography systems with screen/film and computed radiography systems: a contrast-detail phantom study. Med Phys 2001; 28: pp. 2328-2335.
8. Lee W.J., Choi B.S.: Utility of digital radiography for the screening of pneumoconiosis as compared to analog radiography: radiation dose, image quality, and pneumoconiosis classification. Health Phys 2012; 103: pp. 64-69.
9. Takashima Y., Suganuma N., Sakurazawa H., et. al.: A flat-panel detector digital radiography and a storage phosphor computed radiography: screening for pneumoconiosis. J Occup Health 2007; 49: pp. 39-45.
10. Franzblau A., Kazerooni E.A., Sen A., et. al.: Comparison of digital radiographs with film radiographs for the classification of pneumoconiosis. Acad Radiol 2009; 16: pp. 669-677.
11. Laney A.S., Petsonk E.L., Wolfe A.L., et. al.: Comparison of storage phosphor computed radiography with conventional film-screen radiography in the recognition of pneumoconiosis. Eur Respir J 2010; 36: pp. 122-127.
12. Sen A., Lee S.Y., Gillespie B.W., et. al.: Comparing film and digital radiographs for reliability of pneumoconiosis classifications: a modeling approach. Acad Radiol 2010; 17: pp. 511-519.
13. Mao L., Laney A.S., Wang M.L., et. al.: Comparison of digital direct readout radiography with conventional film-screen radiography for the recognition of pneumoconiosis in dust-exposed Chinese workers. J Occup Health 2011; 53: pp. 320-326.
14. Larson T.C., Holiday D.B., Antao V.C., et. al.: Comparison of digital with film radiographs for the classification of pneumoconiotic pleural abnormalities. Acad Radiol 2012; 19: pp. 131-140.
15. Occupational Safety and Health Research Institute. Guidelines of quality assurance for pneumoconiosis. Available at: http://oshri.kosha.or.kr/board?tc=RetrieveBoardViewCmd&boardType=A&contented=208741&pageNum=1&urlCode=T1|Y|404|371|||||/board&tabId , Accessed June 2, 2010.
16. Choi B.S., Park S.Y., Lee J.O.: Current status of pneumoconiosis patients in Korea. J Korean Med Sci 2010; 25: pp. S13-S19.
17. Sim J., Wright C.C.: The kappa statistic in reliability studies: use, interpretation, and sample size requirements. Phys Ther 2005; 85: pp. 257-268.
18. Obuchowski N.A.: Receiver operating characteristic curves and their use in radiology. Radiology 2003; 229: pp. 3-8.
19. Park S.H., Goo J.M., Jo C.H.: Receiver operating characteristic (ROC) curve: practical review for radiologists. Korean J Radiol 2004; 5: pp. 11-18.
20. Welch L.S., Hunting K.L., Balmes J., et. al.: Variability in the classification of radiographs using the 1980 International Labor Organization Classification for Pneumoconioses. Chest 1998; 114: pp. 1740-1748.
21. Reger R.B., Smith C.A., Kibelstis J.A., et. al.: The effect of film quality and other factors on the roentgenographic categorization of coal workers’ pneumoconiosis. Am J Roentgenol Radium Ther Nucl Med 1972; 115: pp. 462-472.
22. Musch D.C., Landis J.R., Higgins I.T., et. al.: An application of kappa-type analyses to interobserver variation in classifying chest radiographs for pneumoconiosis. Stat Med 1984; 3: pp. 73-83.
23. Musch D.C., Higgins I.T., Landis J.R.: Some factors influencing interobserver variation in classifying simple pneumoconiosis. Br J Ind Med 1985; 42: pp. 346-349.
24. Frumkin H., Pransky G., Cosmatos I.: Radiologic detection of pleural thickening. Am Rev Respir Dis 1990; 142: pp. 1325-1330.
25. Schaefer-Prokop C., Neitzel U., Venema H.W., et. al.: Digital chest radiography: an update on modern technology, dose containment and control of image quality. Eur Radiol 2008; 18: pp. 1818-1830.