
Rationale and Objectives
Presurgical assessment of fatty degeneration is important in the management of patients with rotator cuff tears. The Goutallier classification is widely accepted as a qualitative scoring system, although it is highly observer-dependent and has poor reproducibility. The objective of this study was to quantify fatty degeneration of the supraspinatus muscle using a 2-point Dixon technique in patients with rotator cuff tears by multiple readers, and to evaluate the reproducibility compared to Goutallier classification.
Materials and Methods
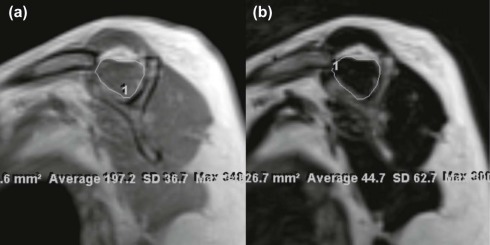
Two hundred patients with rotator cuff tears who underwent magnetic resonance imaging (MRI), including 2-point Dixon sequence at 3.0-T, were selected retrospectively. Qualitative and quantitative analyses of fatty degeneration were performed by two radiologists and three orthopedic surgeons independently. The fat quantification was performed by measuring signal intensity values of in phase (S(In)) and fat image (S(Fat)), and calculating fat fraction as S(Fat)/S(In). The reproducibility of MR quantification was analyzed by the intra- and interclass correlation coefficients and Bland-Altman plots.
Results
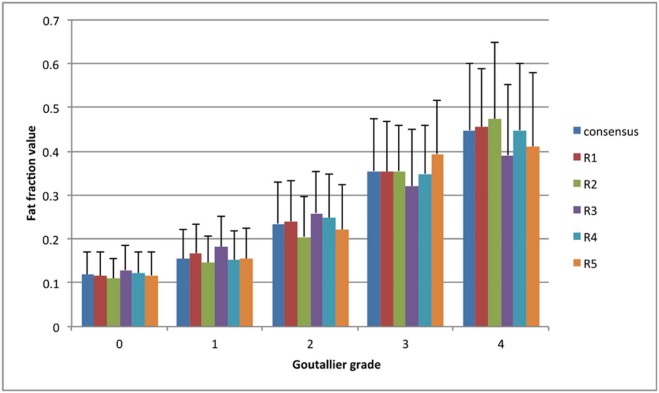
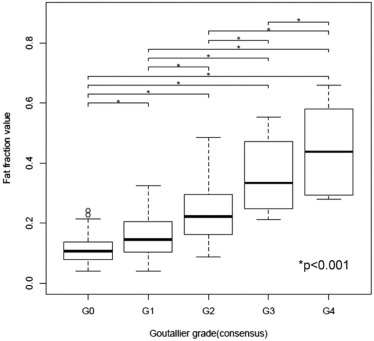
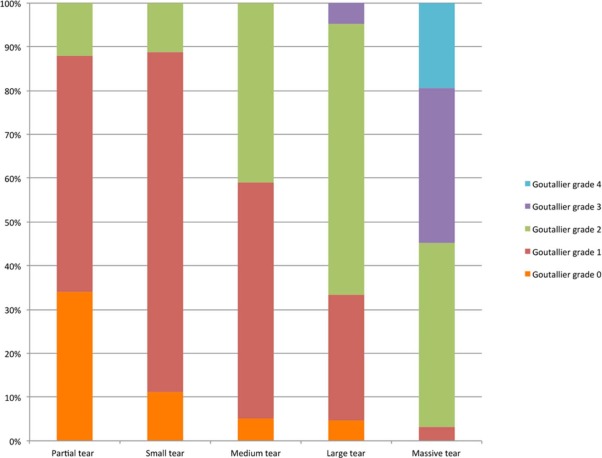
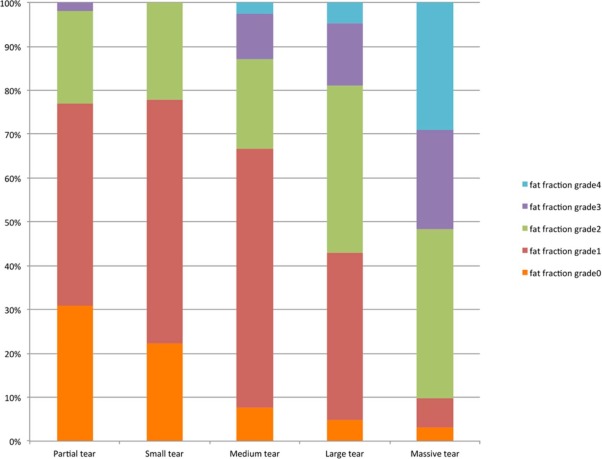
The interobserver agreement of the Goutallier classification among five readers was moderate (k = 0.51), whereas the interclass correlation coefficient regarding fat fraction value quantified in 2-point Dixon sequence was excellent (0.893). The mean differences in fat fraction values from the individual segmentation results were from −0.072 to 0.081. Proposed fat fraction grading and Goutallier grading showed similar frequency and distribution in severity of rotator cuff tears.
Conclusions
Fat quantification in the rotator cuff muscles using a 2-point Dixon technique at 3.0-T MRI is highly reproducible and clinically feasible in comparison to the qualitative evaluation using Goutallier classification.
Introduction
The assessment of rotator cuff muscle abnormalities after tear is one of the main factors in clinical decision-making in the management of patients with rotator cuff tears . Severity of presurgical fatty degeneration is especially relevant to the higher frequency of retear and worse functional outcomes after treatment . An accurate determination of fatty degeneration in the rotator cuff muscle is therefore a crucial element in evaluating surgical indications and postoperative prognosis.
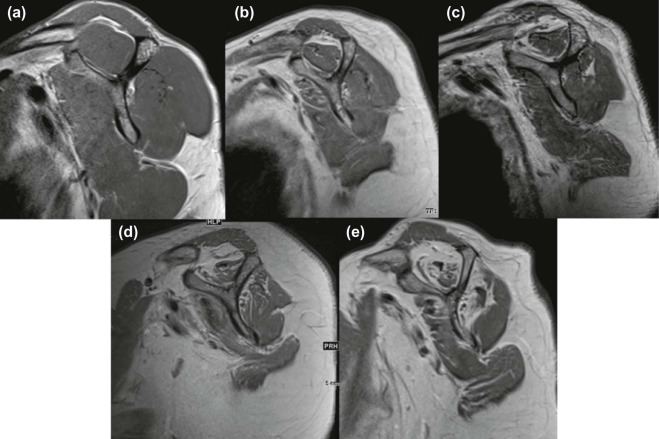
For the qualitative assessment of fatty degeneration, computed tomography and magnetic resonance imaging (MRI)-based classifications have been established. The Goutallier classification has become widely accepted as standard 5-grade scoring systems for muscle fatty degeneration in current practice . The Goutallier classification was initially created based on axial computed tomography images; however, recently it was adapted for the evaluation of fatty degeneration on sagittal MR images. Although the Goutallier classification has been widely used, it is shown to be highly observer-dependent, and inter- and intraobserver reliability is not high . This fact has been a critical problem for the preoperative evaluation of fatty degeneration and assessment of operative indication.
Get Radiology Tree app to read full this article<
Get Radiology Tree app to read full this article<
Materials and Methods
Patients
Get Radiology Tree app to read full this article<
MRI Acquisition
Get Radiology Tree app to read full this article<
Evaluation of the Rotator Cuff
Get Radiology Tree app to read full this article<
Qualitative Analysis of Fatty Degeneration
Get Radiology Tree app to read full this article<
Get Radiology Tree app to read full this article<
Quantitative Analysis of Fatty Degeneration
Get Radiology Tree app to read full this article<
S(Water)+S(Fat)=S(In) S
(
Water
)
+
S
(
Fat
)
=
S
(
In
)
Fat fraction=S(Fat)/(S(Water)+S(Fat))=S(Fat)/S(In) Fat fraction
=
S
(
Fat
)
/
(
S
(
Water
)
+
S
(
Fat
)
)
=
S
(
Fat
)
/
S
(
In
)
Get Radiology Tree app to read full this article<
Statistical Analysis
Get Radiology Tree app to read full this article<
Get Radiology Tree app to read full this article<
Get Radiology Tree app to read full this article<
Get Radiology Tree app to read full this article<
Get Radiology Tree app to read full this article<
Results
Get Radiology Tree app to read full this article<
TABLE 1
Patient’s Demographic Data
Group Partial Tear Small Tear Medium Tear Large Tear Massive Tear Combined No. of patients 100 9 39 21 31 200 Percentage of patients 50 4.5 19.5 10.5 15.5 100 Age, y, mean ± standard deviation 63.3 ± 11 56.6 ± 9.2 68.6 ± 8.5 68.8 ± 8.2 7.29 ± 10 66.1 ± 10.8 Sex, n (%) Male 48 (48.0) 4 (44.4) 16 (41.0) 8 (38.0) 10 (32.3) 86 (43.0) Female 52 (52.0) 5 (55.6) 23 (59.0) 13 (62.0) 21 (67.7) 114 (57.0)
Get Radiology Tree app to read full this article<
Get Radiology Tree app to read full this article<
TABLE 2
Unweighted/Weighted Cohen’s Kappa Value of the Goutallier Classification Between Reader Pairs
Reader 1 Reader 2 Reader 3 Reader 4 Reader 5 Reader 1 0.47/0.73 0.44/0.80 0.65/0.86 0.53/0.78 Reader 2 0.16/0.64 0.54/0.78 0.50/0.76 Reader 3 0.36/0.76 0.34/0.68 Reader 4 0.52/0.79 Reader 5
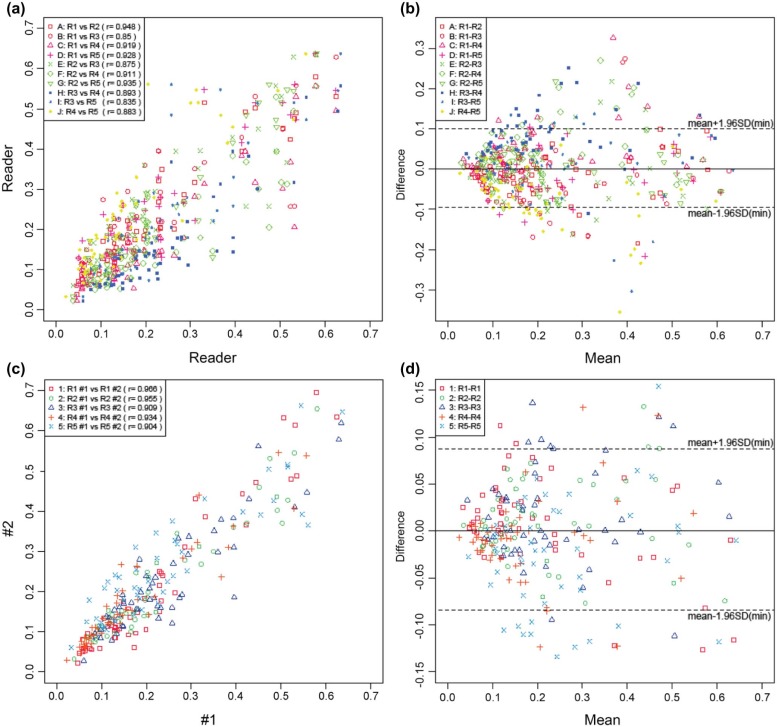
TABLE 3
Bland-Altman Analysis of Interobserver Agreement of Measurement of Fat Fraction Value of Supraspinatus Muscles
Proportional Bias Fixed Bias Reader PMC \* 95% CI_P_ Value † Mean Difference SD 95% Limits of Agreement R1-R2 0.211 (−0.103, 0.437) 0.353 −0.011 0.05 (−0.109, 0.087) R1-R3 0.149 (−0.076, 0.459)0.048 −0.032 0.083 (−0.195, 0.131) R1-R40.001 (0.191, 0.644)<0.001 0.049 0.064 (−0.076, 0.174) R1-R5 0.863 (−0.256, 0.301)0.048 −0.023 0.059 (−0.139, 0.093) R2-R3 0.451 (−0.175, 0.376) 0.176 −0.021 0.072 (−0.162, 0.120) R2-R40.025 (0.042, 0.547)<0.001 0.06 0.061 (−0.060, 0.180) R2-R5 0.345 (−0.400, 0.148) 0.353 −0.012 0.055 (−0.120, 0.096) R3-R4 0.203 (−0.100, 0.439)<0.001 0.081 0.063 (−0.042, 0.204) R3-R5 0.205 (−0.439, 0.101) 0.444 0.009 0.086 (−0.160, 0.178) R4-R50.008 (−0.588, −0.103)<0.001 −0.072 0.073 (−0.215, 0.071)
CI, confidence interval; SD, standard deviation.
Bold: statistically significant difference at P < 0.05.
Get Radiology Tree app to read full this article<
Get Radiology Tree app to read full this article<
TABLE 4
Bland-Altman Analysis of Intraobserver Agreement of Measurement of Fat Fraction Value of Supraspinatus Muscles
Proportional Bias Fixed Bias Reader PMC \* 95% CI_P_ Value † Mean Difference SD 95% Limits of Agreement R1(#1-#2)<0.001 (−0.668, −0.231) 0.27 0.008 0.05 (−0.090, 0.106) R2(#1-#2) 0.508 (−0.188, 0.364) 0.227 0.01 0.044 (−0.076, 0.096) R3(#1-#2) 0.51 (−0.188, 0.364)0.017 0.021 0.059 (−0.095, 0.137) R4(#1-#2) 0.275 (−0.127, 0.417) 0.189 −0.009 0.046 (−0.099, 0.081) R5(#1-#2) 0.149 (−0.075, 0.459)0.026 −0.022 0.066 (−0.151, 0.107)
CI, confidence interval; SD, standard deviation.
Bold: statistically significant difference at P < 0.05.
Get Radiology Tree app to read full this article<
Get Radiology Tree app to read full this article<
Get Radiology Tree app to read full this article<
Get Radiology Tree app to read full this article<
Get Radiology Tree app to read full this article<
Get Radiology Tree app to read full this article<
Get Radiology Tree app to read full this article<
Discussion
Get Radiology Tree app to read full this article<
Get Radiology Tree app to read full this article<
Get Radiology Tree app to read full this article<
Get Radiology Tree app to read full this article<
Get Radiology Tree app to read full this article<
Conclusion
Get Radiology Tree app to read full this article<
Acknowledgment
Get Radiology Tree app to read full this article<
References
1. Gladstone J.N., Bishop J.Y., Lo I.K., et. al.: Fatty infiltration and atrophy of the rotator cuff do not improve after rotator cuff repair and correlate with poor functional outcome. Am J Sports Med 2007; 35: pp. 719-728.
2. Barry J.J., Lansdown D.A., Cheung S., et. al.: The relationship between tear severity, fatty infiltration, and muscle atrophy in the supraspinatus. J Shoulder Elbow Surg 2013; 22: pp. 18-25.
3. Nozaki T., Tasaki A., Horiuchi S., et. al.: Quantification of fatty degeneration within the supraspinatus muscle by using a 2-point Dixon method on 3-T MRI. AJR Am J Roentgenol 2015; 205: pp. 116-122.
4. Goutallier D., Postel J.M., Gleyze P., et. al.: Influence of cuff muscle fatty degeneration on anatomic and functional outcomes after simple suture of full-thickness tears. J Shoulder Elbow Surg 2003; 12: pp. 550-554.
5. Burkhart S.S., Barth J.R., Richards D.P., et. al.: Arthroscopic repair of massive rotator cuff tears with stage 3 and 4 fatty degeneration. Arthroscopy 2007; 23: pp. 347-354.
6. Mellado J.M., Calmet J., Olona M., et. al.: Surgically repaired massive rotator cuff tears: MRI of tendon integrity, muscle fatty degeneration, and muscle atrophy correlated with intraoperative and clinical findings. AJR Am J Roentgenol 2005; 184: pp. 1456-1463.
7. Sugihara T., Nakagawa T., Tsuchiya M., Ishizuki M.: Prediction of primary reparability of massive tears of the rotator cuff on preoperative magnetic resonance imaging. J Shoulder Elbow Surg 2003; 12: pp. 222-225.
8. Liem D., Lichtenberg S., Magosch P., et. al.: Magnetic resonance imaging of arthroscopic supraspinatus tendon repair. J Bone Joint Surg Am 2007; 89: pp. 1770-1776.
9. Goutallier D., Postel J.M., Bernageau J., et. al.: Fatty muscle degeneration in cuff ruptures. Pre- and postoperative evaluation by CT scan. Clin Orthop Relat Res 1994; 304: pp. 78-83.
10. Fuchs B., Weishaupt D., Zanetti M., et. al.: Fatty degeneration of the muscles of the rotator cuff: assessment by computed tomography versus magnetic resonance imaging. J Shoulder Elbow Surg 1999; 8: pp. 599-605.
11. Slabaugh M.A., Friel N.A., Karas V., et. al.: Interobserver and intraobserver reliability of the Goutallier classification using magnetic resonance imaging: proposal of a simplified classification system to increase reliability. Am J Sports Med 2012; 40: pp. 1728-1734.
12. Lippe J., Spang J.T., Leger R.R., et. al.: Inter-rater agreement of the Goutallier, Patte, and Warner classification scores using preoperative magnetic resonance imaging in patients with rotator cuff tears. Arthroscopy 2012; 28: pp. 154-159.
13. Nardo L., Karampinos D.C., Lansdown D.A., et. al.: Quantitative assessment of fat infiltration in the rotator cuff muscles using water-fat MRI. J Magn Reson Imaging 2014; 39: pp. 1178-1185.
14. Williams M.D., Ladermann A., Melis B., et. al.: Fatty infiltration of the supraspinatus: a reliability study. J Shoulder Elbow Surg 2009; 18: pp. 581-587.
15. Nozaki T., Tasaki A., Horiuchi S., et. al.: Predicting retear after repair of full-thickness rotator cuff tear: two-point Dixon MR imaging quantification of fatty muscle degeneration-initial experience with 1-year follow-up. Radiology 2016; 280: pp. 500-509.
16. Cofield R.H.: Subscapular muscle transposition for repair of chronic rotator cuff tears. Surg Gynecol Obstet 1982; 154: pp. 667-672.
17. Cohen J.: A power primer. Psychol Bull 1992; 112: pp. 155-159.
18. Bland J.M., Altman D.G.: Statistical methods for assessing agreement between two methods of clinical measurement. Lancet 1986; 1: pp. 307-310.
19. Bland J.M., Altman D.G.: Measuring agreement in method comparison studies. Stat Methods Med Res 1999; 8: pp. 135-160.
20. Gokalp G., Yildirim N., Yazici Z., et. al.: Using chemical-shift MR imaging to quantify fatty degeneration within supraspinatus muscle due to supraspinatus tendon injuries. Skeletal Radiol 2010; 39: pp. 1211-1217.
21. Jost B., Pfirrmann C.W., Gerber C., et. al.: Clinical outcome after structural failure of rotator cuff repairs. J Bone Joint Surg Am 2000; 82: pp. 304-314.