
Rationale and Objectives
Ultrasound is a proven method for examining soft tissue structures, including tendons, and recently quantitative ultrasound has become more prevalent in research settings. However, limited reliability data have been published for these new quantitative ultrasound measures. The main objective of this study was to quantify the reliability and measurement error of multiple quantitative ultrasound imaging protocols for the biceps and supraspinatus tendons.
Materials and Methods
Two examiners captured ultrasound images of the non-dominant long head of the biceps tendon and supraspinatus tendon from 15 able-bodied participants and five manual wheelchair users. Each examiner captured two images per subject under two different preparations, which included subject positioning and reference marker placement. Image processing (reading) was performed twice to compute nine quantitative ultrasound measures of grayscale tendon appearance using first-order statistics and texture analysis. Generalizability theory was applied to compute interrater and intrarater reliability using the coefficient of dependability (Φ) for multiple study design protocols.
Results
Interrater reliability was generally low (0.26 < Φ < 0.82), and it is recommended that a single evaluator capture all images for quantitative ultrasound protocols. Most of the quantitative ultrasound measures ( n = 14 of 18) exhibited at least moderate (Φ > 0.50) intrarater reliability for a single image captured under one preparation and read once.
Conclusion
By following a protocol designed to minimize measurement error, one can increase the reliability of quantitative ultrasound measures. An appropriately designed protocol will allow quantitative ultrasound to be used as an outcome measure to identify structural changes within tendons.
Ultrasound is a well-established, noninvasive method for examining soft tissue structures of the shoulder, including the rotator cuff tendons and the long head of the biceps tendon. Traditionally, ultrasound imaging has been a valuable tool in clinical practice to qualitatively evaluate the integrity of musculoskeletal structures. Symptoms of pathology of the rotator cuff detected by ultrasound include a hypoechoic tendon appearance and hypertrophy of the long biceps tendon . Biceps tendon inflammation often coexists with rotator cuff disease and may be a result of chronic inflammation and impingement or bicipital tenosynovitis . Healthy tendons are known to have a well-organized, uniform, hyperechoic pattern of collagen along the long axis of the tendon. Conversely, tendons with pathology have a more disorganized, diffuse, or hypoechoic appearance on ultrasound. In essence, tendon health is clinically evaluated by visually examining the grayscale image texture of the tendon. Quantifying tendon grayscale texture has many potential benefits, particularly in research focused on reducing the risk for chronic tendinopathy.
To date, quantitative analysis of tendons on ultrasound has primarily been limited to measurements of tendon thickness or cross-sectional area . However, researchers have applied first-order statistics and texture analysis to other medical images to characterize microstructure . One study classified muscle on the basis of the concentration of contractile components using first-order grayscale statistics . Another research group used quantitative ultrasound techniques, including structural measurements and mean echogenicity, to discriminate between skeletal muscle in children with and without neuromuscular disease . Finally, a recently published study examined eight spatial frequency parameters, derived from two-dimensional Fourier analysis of the ultrasound images, that discriminated between subjects with and without Achilles tendinopathy with approximately 80% accuracy . These studies provide a basis for the application of quantitative ultrasound to understanding the development of chronic musculoskeletal pathology. Despite the growing interest in this well-established technique in research settings, there have been very few attempts to establish the psychometric properties of quantitative ultrasound measures . None have evaluated reliability and measurement error for a set of tendon image features under multiple testing conditions. This information is needed to develop effective measurement protocols to quantify acute or chronic tendon changes linked to cumulative trauma disorders of the upper limb.
Get Radiology Tree app to read full this article<
Materials and methods
Participants
Get Radiology Tree app to read full this article<
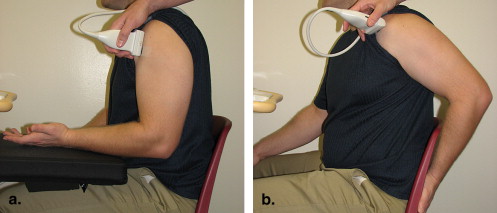
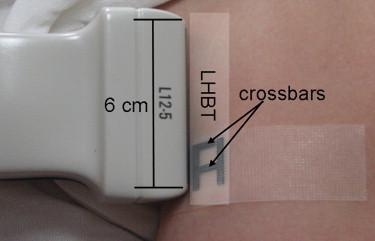
Ultrasound Examination
Get Radiology Tree app to read full this article<
Test
Get Radiology Tree app to read full this article<
Get Radiology Tree app to read full this article<
Get Radiology Tree app to read full this article<
Retest
Get Radiology Tree app to read full this article<
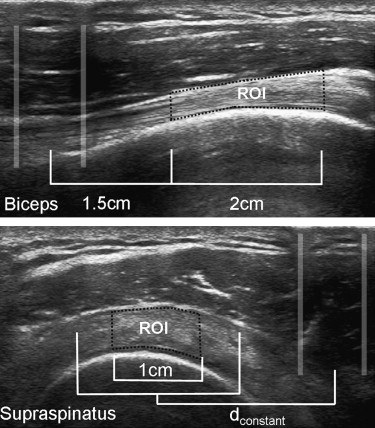
Image Analysis
Get Radiology Tree app to read full this article<
Get Radiology Tree app to read full this article<
Get Radiology Tree app to read full this article<
Get Radiology Tree app to read full this article<
Statistical Analysis
Get Radiology Tree app to read full this article<
Get Radiology Tree app to read full this article<
Get Radiology Tree app to read full this article<
Table 1
Quantitative Ultrasound Outcome Measures Computed for Each Evaluator ∗
Ultrasound Outcome Measures Tendon Evaluator 1 Evaluator 2 Overall Φ † Interevaluator Φ ‡ Interpreparation Φ § Interimage Φ ‖ Thickness Biceps 4.02 ± 0.86 4.03 ± 0.89 0.804 0.819 0.872 0.941 Supraspinatus 4.87 ± 0.78 4.78 ± 0.92 0.804 0.814 0.908 0.962 Echogenicity Biceps 114.33 ± 18.85 103.84 ± 17.66 0.396 0.397 0.686 0.836 Supraspinatus 105.97 ± 18.08 111.04 ± 23.12 0.605 0.659 0.771 0.829 Variance Biceps 2052.4 ± 669.7 2064.8 ± 713.6 0.310 0.330 0.660 0.806 Supraspinatus 1306.4 ± 359.1 1536.7 ± 575.8 0.368 0.402 0.631 0.728 Skewness Biceps 0.56 ± 0.32 0.82 ± 0.34 0.261 0.355 0.569 0.677 Supraspinatus 0.17 ± 0.33 0.12 ± 0.36 0.339 0.360 0.551 0.678 Kurtosis Biceps 3.66 ± 0.97 4.03 ± 1.27 0.385 0.453 0.664 0.684 Supraspinatus 3.66 ± 0.47 3.47 ± 0.52 0.252 0.259 0.535 0.463 Entropy Biceps 7.11 ± 0.27 7.06 ± 0.35 0.312 0.312 0.636 0.768 Supraspinatus 6.88 ± 0.22 6.99 ± 0.26 0.335 0.376 0.528 0.669 Contrast Biceps 6.02 ± 1.72 5.86 ± 2.08 0.328 0.348 0.625 0.707 Supraspinatus 4.08 ± 0.92 4.35 ± 1.17 0.504 0.589 0.666 0.700 Energy Biceps 0.58 ± 0.24 0.68 ± 0.29 0.270 0.297 0.752 0.826 Supraspinatus 0.71 ± 0.22 0.65 ± 0.21 0.506 0.518 0.649 0.629 Homogeneity Biceps 3.46 ± 0.21 3.54 ± 0.24 0.360 0.400 0.698 0.825 Supraspinatus 3.65 ± 0.18 3.61 ± 0.20 0.581 0.655 0.723 0.736
E, number of evaluators; I, number of ultrasound images recorded; P, number of times markers were affixed to the skin and the upper limb positioned.
Get Radiology Tree app to read full this article<
Get Radiology Tree app to read full this article<
Get Radiology Tree app to read full this article<
Get Radiology Tree app to read full this article<
Get Radiology Tree app to read full this article<
Get Radiology Tree app to read full this article<
Results
Interrater Reliability
Get Radiology Tree app to read full this article<
Intrarater Reliability
Get Radiology Tree app to read full this article<
Table 2
Dependability Coefficients (Φ) and SEMs Calculated for Various D-Study Designs Using a Single Value (Design: P = 1, I = 1, and R = 1) or a Mean Value (All Other Designs) Obtained by Evaluator 1
D-Study Measurement Error Estimations for Multiple Study Designs Biceps Tendon Supraspinatus Tendon Outcome Measure P = 1, I = 1, R = 1 P = 1, I = 1, R = 2 P = 1, I = 2, R = 1 P = 1, I = 1, R = 1 P = 1, I = 1, R = 2 P = 1, I = 2, R = 1 Thickness Φ 0.906 0.910 0.919 0.921 0.926 0.937 SEM 0.271 0.265 0.250 0.221 0.213 0.196 SEM norm (%) 6.727 6.582 6.206 4.547 4.384 4.038 Echogenicity Φ 0.742 0.743 0.793 0.754 0.764 0.851 SEM 10.610 10.591 9.190 9.985 9.723 7.316 SEM norm (%) 9.288 9.272 8.046 9.405 9.158 6.891 Variance Φ 0.614 0.616 0.673 0.474 0.482 0.632 SEM 480.747 478.994 423.072 328.352 322.874 237.531 SEM norm (%) 23.442 23.357 20.630 25.382 24.958 18.361 Skewness Φ 0.533 0.535 0.677 0.579 0.600 0.693 SEM 0.265 0.264 0.196 0.260 0.250 0.203 SEM norm (%) 47.302 47.097 34.917 163.133 156.348 127.432 Kurtosis Φ 0.462 0.463 0.568 0.477 0.506 0.635 SEM 0.887 0.886 0.716 0.443 0.418 0.320 SEM norm (%) 24.214 24.180 19.559 12.035 11.368 8.714 Entropy Φ 0.616 0.620 0.681 0.484 0.516 0.643 SEM 0.196 0.194 0.170 0.198 0.185 0.142 SEM norm (%) 2.756 2.731 2.389 0.484 0.516 0.643 Contrast Φ 0.646 0.651 0.708 0.589 0.607 0.725 SEM 1.162 1.148 1.006 0.725 0.698 0.534 SEM norm (%) 19.260 19.033 16.674 17.655 16.988 13.015 Energy Φ 0.709 0.714 0.796 0.618 0.627 0.756 SEM 0.150 0.148 0.118 0.162 0.159 0.117 SEM norm (%) 25.884 25.551 20.470 22.973 22.500 16.582 Homogeneity Φ 0.764 0.768 0.826 0.657 0.673 0.779 SEM 0.113 0.112 0.094 0.124 0.119 0.091 SEM norm (%) 3.272 3.237 2.704 3.392 3.267 2.495
D-study, dependability study; I, number of ultrasound images recorded; P, number of times markers were affixed to the skin and the upper limb positioned; R, number of readings completed for each ultrasound image recorded; SEM, standard error of measurement; SEM norm = normalized standard error of measurement.
Get Radiology Tree app to read full this article<
Get Radiology Tree app to read full this article<
Discussion
Get Radiology Tree app to read full this article<
Interevaluator Repeatability
Get Radiology Tree app to read full this article<
Get Radiology Tree app to read full this article<
Effect of Study Design
Get Radiology Tree app to read full this article<
Get Radiology Tree app to read full this article<
Get Radiology Tree app to read full this article<
Get Radiology Tree app to read full this article<
Limitations
Get Radiology Tree app to read full this article<
Get Radiology Tree app to read full this article<
Conclusions
Get Radiology Tree app to read full this article<
Acknowledgment
Get Radiology Tree app to read full this article<
Get Radiology Tree app to read full this article<
References
1. Arslan G., Apaydin A., Kabaalioglu A., Sindel T., Luleci E.: Sonographically detected subacromical/subdeltoid bursal effusion and biceps tendon sheath fluid: reliable signs of rotator cuff tear?. J Clin Ultrasound 1999; 27: pp. 335-339.
2. Thain L., Adler R.: Sonography of the rotator cuff and biceps tendon: technique, normal anatomy, and pathology. J Clin Ultrasound 1999; 27: pp. 446-458.
3. Zanetti M., Hodler J.: Imaging of degenerative and posttraumatic disease in the shoulder joint with ultrasound. Eur J Radiol 2000; 35: pp. 119-125.
4. Teefey S., Middleton W., Yamaguchi K.: Musculoskeletal ultrasound: shoulder sonography: state of the art. Radiol Clin North Am 1999; 37: pp. 767-785.
5. Wallny T., Wagner U., Prange S., Schmitt O., Reich H.: Evaluation of chronic tears of the rotator cuff by ultrasound: a new index. J Bone Joint Surg Br 1999; 81: pp. 675-678.
6. Hashimoto B., Kramer D., Wiitala L.: Applications of musculoskeletal sonography. J Clin Ultrasound 1999; 27: pp. 293-318.
7. Leung J.L.Y., Griffith J.F.: Sonography of chronic Achilles tendinopathy: a case-control study. J Clin Ultrasound 2008; 36: pp. 27-32.
8. Alvarenga A., Pereira W.C.A., Infantosi A.F.C.: Complexity curve and grey level co-occurrence matrix in the texture evaluation of breast tumor on ultrasound images. Med Phys 2007; 34: pp. 379-387.
9. Nielsen P.K., Jensen B.R., Darvann T., Jorgensen K., Bakke M.: Quantitative ultrasound tissue characterization in shoulder and thigh muscles—a new approach. BMC Musculoskelet Disord 2006; 7: pp. 2.
10. Sharma N., Ray A.K., Sharma S., Shukla K.K., Pradhan S., Aggarwal L.M.: Segmentation and classification of medical images using texture-primative features: application of BAM-type artificial neural network. J Med Phys 2008; 33: pp. 119-126.
11. Scholten R.R., Pillen S., Verrips A., Zwarts M.J.: Quantitative ultrasonography of skeletal muscles in children: normal values. Muscle Nerve 2003; 27: pp. 693-698.
12. Pillen S., Scholten R.R., Zwarts M.J., Verrips A.: Quantitative skeletal muscle ultrasonography in children with suspected neuromuscular disease. Muscle Nerve 2003; 27: pp. 699-705.
13. Bashford G.R., Tomsen N., Arya S., Burnfield J.M., Kulig K.: Tendinopathy discrimination by use of spatial frequency parameters in ultrasound B-mode images. IEEE Trans Med Imag 2008; 27: pp. 608-615.
14. Brushoj C., Henriksen B.M., Albrecht-Beste E., Holmich P., Larsen K., Bachmann Nielsen M.: Reproducibility of ultrasound and magnetic resonance imaging measurements of tendon size. Acta Radiologica 2006; 9: pp. 954-959.
15. O’Connor P.J., Grainger A.J., Morgan S.R., Smith K.L., Waterton J.C., Nash A.F.P.: Ultrasound assessment of tendons in asymptomatic volunteers: a study of reproducibility. Eur Radiol 2004; 14: pp. 1968-1973.
16. Ying M., Yeung E., Li B., Li W., Lui M., Tsoi C- W.: Sonographic evaluation of the size of the Achilles tendon: the effect of exercise and dominance of the ankle. Ultrasound Med Biol 2003; 29: pp. 637-642.
17. Haralick R., Shanmugam K., Dinstein I.: Textural features for image classification. IEEE Trans Syst Man Cybern 1993; SMC-3: pp. 610-621.
18. Nielsen P.K., Jensen B.R., Darvann T., Jorgensen K., Bakke M.: Quantitative ultrasound image analysis of the supraspinatus muscle. Clin Biomech 2000; 15: pp. S13-S16.
19. The MathWorks, Inc. MATLAB reference documentation (version 2008a). Natick, MA: The MathWorks, Inc.
20. Shavelson R.J., Webb N.M.: Generalizability theory: a primer.1991.SageNewbury Park, CA
21. Brennan R., Kane M.: An index of dependability for mastery tests. J Educ Manage 1977; 14: pp. 277-289.
22. Portney L.G., Watkins M.P.: Foundations of clinical research: application to practice.2nd ed2000.Appleton & LangeStamford, CT