
Rationale and Objectives
Total renal volume (TRV) is an important quantitative indicator of the progression of autosomal dominant polycystic kidney disease (ADPKD). The Consortium for Radiologic Imaging Studies of Polycystic Kidney Disease proposes a method for TRV computation based on manual tracing and geometric modeling. Alternative approaches for TRV computation are represented by the application of advanced image processing techniques. In this study, we aimed to compare TRV estimates derived from these two different approaches.
Materials and Methods
The nearly automated technique for the analysis of magnetic resonance (MR) images was tested on 30 ADPKD patients. TRV was computed from both axial (KV ax ) and coronal (KV cor ) acquisitions and compared to measurements based on geometric modeling (KV ap ) by linear regression and Bland–Altman analysis. In addition, to assess reproducibility, intraobserver and interobserver variabilities were computed.
Results
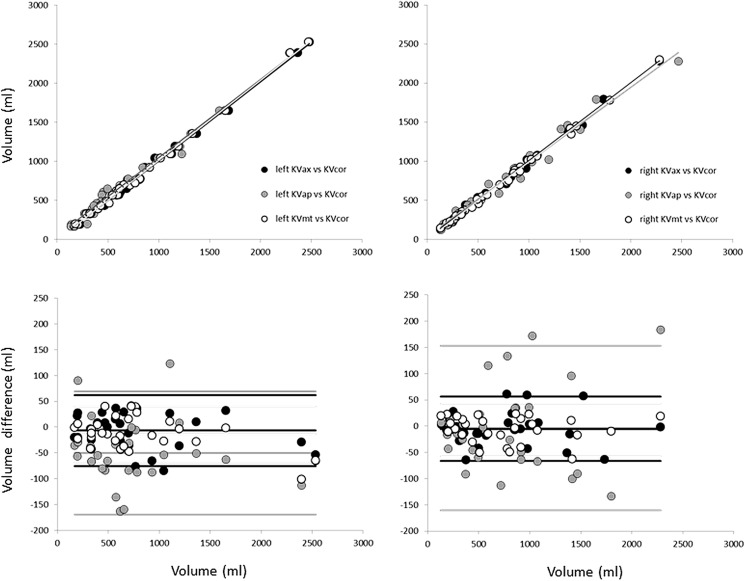
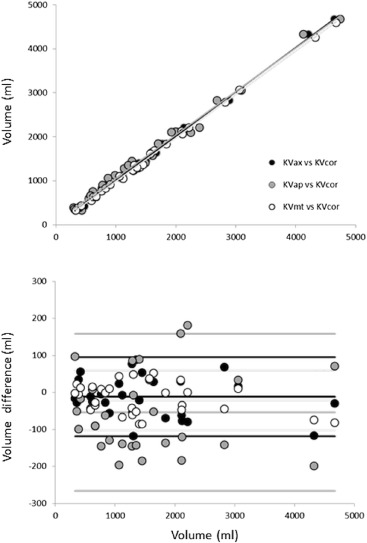
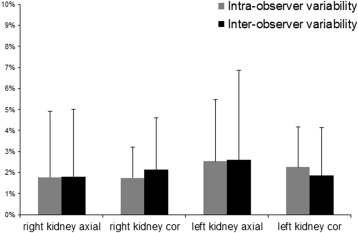
Linear regression analysis between KV ax and KV cor resulted in an excellent correlation (KV ax = 1KV cor − 0.78; r 2 = 0.997). Bland–Altman analysis showed a negligible bias and narrow limits of agreement (bias: −11.7 mL; SD: 54.3 mL). Similar results were obtained by comparison of volumes obtained applying the nearly automated method and the one based on geometric modeling ( y = 0.98 x + 75.9; r 2 = 0.99; bias: −53.7 mL; SD: 108.1 mL). Importantly, geometric modeling does not provide reliable TRV estimates in huge kidney affected by regional deformation. Intraobserver and interobserver variability resulted in very small percentage error <2%.
Conclusions
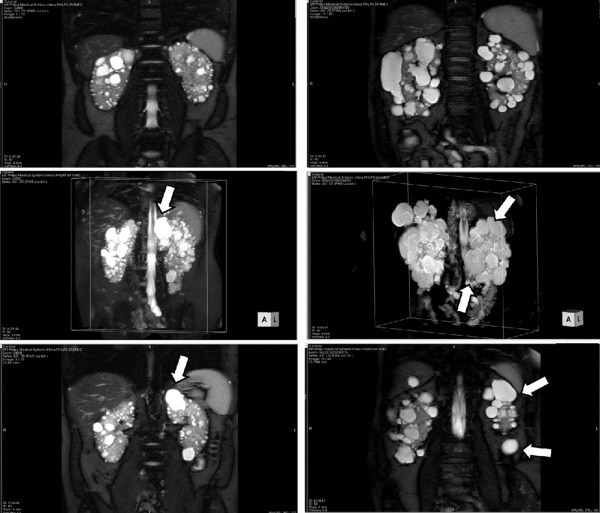
The results of this study provide the feasibility of using a nearly automated approach for accurate and fast evaluation of TRV also in markedly enlarged ADPKD kidneys including exophytic cysts.
Autosomal dominant polycystic kidney disease (ADPKD) is the most common life-threatening genetic disease . In almost 50% of patients with ADPKD, the disease progresses to end-stage renal disease (ESRD) requiring dialysis or transplantation. The progression rate of ADPKD to ESRD is variable, and the mechanism of chronic renal failure in ADPKD is not yet clearly defined. A proposed hypothesis is that growth of cysts leads to renal failure by compressing adjacent normal parenchyma . Cysts initiation begins early in life in a relatively few renal tubules that expand; as cysts become more numerous and enlarged expanding the total cyst volume (TCV), the total renal volume (TRV) increases. Consequently, cysts growth represents the major determinant of TRV increase in ADPKD . Importantly, in polycystic disease, TRV is associated with proteinuria and directly correlated with the reduction in glomerular filtration rate, and it is considered a predictive marker of the chronic renal failure development .
The publication of a large clinical trial on the use of tolvaptan and some preliminary data on analogs of somatostatin give to the scientific and patients’ community the hope for a possible therapeutic strategy of slowing the progression of the disease in the next future.
Get Radiology Tree app to read full this article<
Get Radiology Tree app to read full this article<
Get Radiology Tree app to read full this article<
Get Radiology Tree app to read full this article<
Get Radiology Tree app to read full this article<
Get Radiology Tree app to read full this article<
Get Radiology Tree app to read full this article<
Materials and methods
Patients and Imaging Acquisition
Get Radiology Tree app to read full this article<
Get Radiology Tree app to read full this article<
Get Radiology Tree app to read full this article<
Get Radiology Tree app to read full this article<
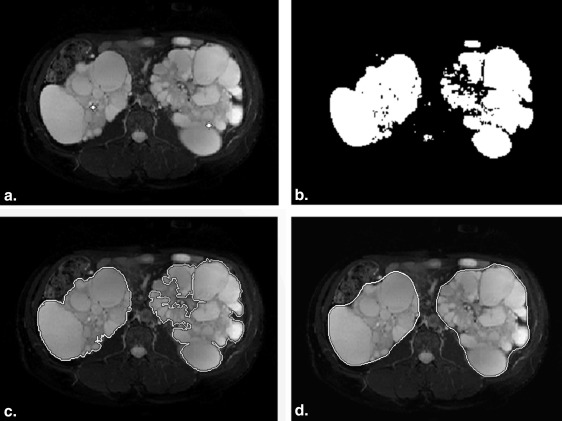
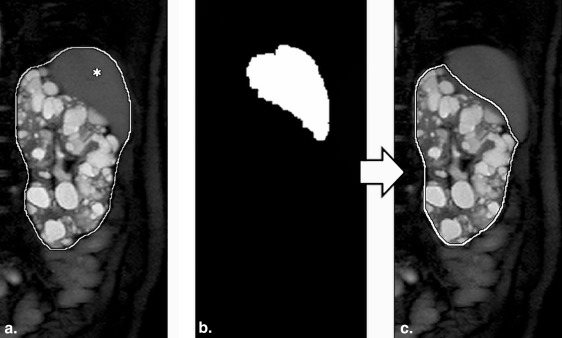
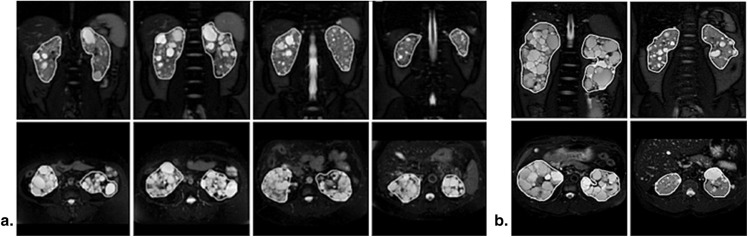
Image Processing
Get Radiology Tree app to read full this article<
Get Radiology Tree app to read full this article<
Get Radiology Tree app to read full this article<
Get Radiology Tree app to read full this article<
Get Radiology Tree app to read full this article<
Get Radiology Tree app to read full this article<
Get Radiology Tree app to read full this article<
Get Radiology Tree app to read full this article<
Get Radiology Tree app to read full this article<
Get Radiology Tree app to read full this article<
Get Radiology Tree app to read full this article<
Data and Statistical Analysis
Get Radiology Tree app to read full this article<
Get Radiology Tree app to read full this article<
Get Radiology Tree app to read full this article<
Get Radiology Tree app to read full this article<
Results
Get Radiology Tree app to read full this article<
Get Radiology Tree app to read full this article<
Get Radiology Tree app to read full this article<
Get Radiology Tree app to read full this article<
Get Radiology Tree app to read full this article<
Get Radiology Tree app to read full this article<
Get Radiology Tree app to read full this article<
Get Radiology Tree app to read full this article<
Get Radiology Tree app to read full this article<
Get Radiology Tree app to read full this article<
Table 1
Total Renal Volume Results Obtained From the Analysis of Coronal Acquisition Applying KV cor and (1) KV mt and (2) KV ap (Significance Level = 0.05)
Comparison between: Regression Line_r_ 2 Bias [mL, (%)] SD (mL) Percent Error |Percent Error|P Left KV mt versus KV cor y = 1.02x − 7.66 0.999 −13.9 (−1.9) 27.7 −2.4 ± 5.6 4.4 ± 4.1 NS Right KV mt versus KV cor y = 0.99x − 2.72 0.999 −7.5 (−1.1) 25.6 0.0 ± 5.9 4.2 ± 4.0 NS Total KV mt versus KV cor y = 0.99x + 3.56 0.999 −21.4 (−1.5) 41.2 −1.3 ± 3.9 3.2 ± 2.5 NS Left KV ap versus KV cor y = 1.00x + 49.37 0.989 −50 (−6.8) 60.8 −10.1 ± 14.1 13.7 ± 10.5 .001 Right KV ap versus KV cor y = 0.95x + 37.54 0.978 −3.7 (−0.5) 81.1 −2.5 ± 10.6 8.7 ± 6.5 NS Total KV ap versus KV cor y = 0.98x + 75.91 0.990 −53.7 (−7.3) 108.1 −5.8 ± 10.8 9.8 ± 7.3 .01
KV ap , method based on geometric approximations proposed in Bae et al. ; KV cor , nearly automated method; KV mt , manual tracing of kidney contours by experts; NS, nonsignificant.
KV mt , first three rows of the table. KV ap , last three rows of the table.
Get Radiology Tree app to read full this article<
Get Radiology Tree app to read full this article<
Get Radiology Tree app to read full this article<
Discussion and conclusions
Get Radiology Tree app to read full this article<
Get Radiology Tree app to read full this article<
Get Radiology Tree app to read full this article<
Get Radiology Tree app to read full this article<
Get Radiology Tree app to read full this article<
Get Radiology Tree app to read full this article<
Get Radiology Tree app to read full this article<
Get Radiology Tree app to read full this article<
Get Radiology Tree app to read full this article<
Get Radiology Tree app to read full this article<
Limitations
Get Radiology Tree app to read full this article<
Get Radiology Tree app to read full this article<
Get Radiology Tree app to read full this article<
Get Radiology Tree app to read full this article<
Acknowledgments
Get Radiology Tree app to read full this article<
References
1. Wilson P.D.: Polycystic kidney disease: new understanding in the pathogenesis. Int J Biochem Cell Biol 2004; 36: pp. 1868-1873.
2. Bae K.T., Zhu F., Chapman A.B., et. al., and the Consortium for Radiologic Imaging Studies of Polycystic Kidney Disease (CRISP): Magnetic resonance imaging evaluation of hepatic cysts in early autosomal-dominant polycystic kidney disease: polycystic kidney disease cohort. Clin J Am Soc Nephrol 2006; 1: pp. 64-69.
3. Grantham J.J., Cook L.T., Torres V.E., et. al., for the CRISP Investigators: Determinants of renal volume in autosomal dominant polycystic kidney disease. Kidney Int 2008; 73: pp. 108-116.
4. Perrone R.: Imaging progression in polycystic kidney disease. N Engl J Med 2006; 354: pp. 2181-2183.
5. Grantham J.J., Torres V.E., Chapman A.B., et. al.: Volume progression in polycystic kidney disease. N Engl J Med 2006; 354: pp. 2122-2130.
6. Torres V.E., Chapman A.B., Devuyst O., et. al.: Tolvaptan in patients with autosomal dominant polycystic kidney disease. N Engl J Med 2012; 367: pp. 2407-2418.
7. Caroli A., Perico N., Perna A., et. al.: Effect of longacting somatostatin analogue on kidney and cyst growth in autosomal dominant polycystic kidney disease (ALADIN): a randomised, placebo-controlled, multicentre trial. Lancet 2013; 382: pp. 1485-1495.
8. Chapman A.B., Guay-Woodford L.M., Grantham J.J., et. al.: Renal structure in early autosomal-dominant polycystic kidney disease (ADPKD): The Consortium for Radiologic Imaging Studies of Polycystic Kidney Disease (CRISP) cohort. Kidney Int 2003; 64: pp. 1035-1045.
9. Kobayashi H., Kawamoto S., Brechbiel M.W., et. al.: Micro-MRI methods to detect renal cysts in mice. Kidney Int 2004; 65: pp. 1511-1516.
10. Grantham J.J.: CRISP: opening a new frontier in the diagnosis and treatment of PKD. Nephrol News Issues 2006; 20: pp. 29-30.
11. Roberts N., Puddephat M.J., McNulty V., et. al.: The benefit of stereology for quantitative radiology. Br J Radiol 2000; 73: pp. 679-697.
12. Bae K., Park B., Sun H., et. al., for the Consortium for Radiologic Imaging Studies of Polycystic Kidney Disease (CRISP): Segmentation of individual renal cysts from MR images in patients with autosomal dominant polycystic kidney disease. Clin J Am Soc Nephrol 2013; 8: pp. 1089-1097.
13. Cohen B.A., Barash I., Kim D.C., et. al.: Intraobserver and interobserver variability of renal volume measurements in polycystic kidney disease using a semiautomated MR segmentation. AJR Am J Roentgenol 2012; 199: pp. 387-393.
14. Bae K.T., Tao C., Wang J., et. al.: Novel approach to estimate kidney and cyst volumes using mid-slice magnetic resonance images in polycystic kidney disease. Am J Nephrol 2013; 38: pp. 333-341.
15. Mignani R., Corsi C., De Marco M., et. al.: Assessment of kidney volume in polycystic kidney disease using magnetic resonance imaging without contrast medium. Am J Nephrol 2011; 33: pp. 176-184.
16. Ravine D., Gibson R.N., Walker R.G., et. al.: Evaluation of ultrasonographic diagnostic criteria for autosomal dominant polycystic kidney disease. Lancet 1994; 343: pp. 824-827.
17. Grantham J.J., Mulamalla S., Grantham C.J., et. al.: Detected renal cysts are tips of the iceberg in adults with ADPKD. Clin J Am Soc Nephrol 2012; 7: pp. 1087-1093.