
Rationale and Objectives
Computer-aided diagnostic (CAD) schemes have been developed for assisting radiologists in the detection of various lesions in medical images. The reliable evaluation of CAD schemes is an important task in the field of CAD research.
Materials and Methods
Many evaluation approaches have been proposed for evaluating the performance of various CAD schemes in the past. However, some important issues in the evaluation of CAD schemes have not been systematically analyzed. The first important issue is the analysis and comparison of various evaluation methods in terms of certain characteristics. The second includes the analysis of pitfalls in the incorrect use of various evaluation methods and the effective approaches to the reduction of the bias and variance caused by these pitfalls. We attempt to address the first important issue in details in this article by conducting Monte Carlo simulation experiments, and to discuss the second issue in the Discussion section.
Results
No single evaluation method is universally superior to the others; different situations of CAD applications require different evaluation methods, as recommended in this article. Bias and variance in the estimated performance levels caused by various pitfalls can be reduced considerably by the correct use of good evaluation methods.
Conclusions
This article would be useful to researchers in the field of CAD research for selecting appropriate evaluation methods and for improving the reliability of the estimated performance of their CAD schemes.
Computer-aided diagnostic (CAD) schemes have been developed for detecting various lesions in many medical imaging modalities, including conventional radiography, computed tomography, magnetic resonance imaging, and ultrasound imaging. An important issue for CAD schemes is the reliable evaluation of their performance levels. In early publications in CAD research, resubstitution (RS) method was commonly used for the evaluation of CAD schemes ( ). Because the performance level estimated by use of the RS method is optimistically biased, investigators in recent years have begun to employ more reliable evaluation methods such as the leave-one-out (LOO), cross-validation (CV), hold-out (HO), and bootstrap (BS) methods. Some investigators have investigated the effect of the sample size on the bias or variance of the estimated performance for classifier ( ) or for CAD schemes ( ). However, to our knowledge, no investigator has systematically analyzed and compared these common evaluation methods in terms of multiple important characteristics, in particular, the bias and generalization performance. As a result, the selection of an evaluation method is generally empirical, and sometimes even arbitrary, in many studies for CAD development. We aim to provide such a comprehensive analysis and comparison to help researchers select appropriate evaluation methods for improving the quality and reliability of performance evaluation of their CAD schemes.
An important characteristic for various evaluation methods is the bias in the estimated performance level of a CAD scheme. Some evaluation methods such as LOO, CV, and HO are almost unbiased if they are used appropriately. Incorrect use of these methods, however, can lead to significant biases in the estimated performance levels. Therefore, we identified a number of typical pitfalls in the incorrect evaluation methods for CAD schemes, and conducted experiments to demonstrate quantitatively the extent of bias or variance caused by each of the pitfalls ( ). In addition, for promoting and using a high standard for reliable evaluation of CAD schemes, we attempted to make recommendations, whenever possible, for overcoming these pitfalls. Because this part the work has been published previously ( ). We will summarize in the Discussion section some important points regarding the reduction of bias and variance.
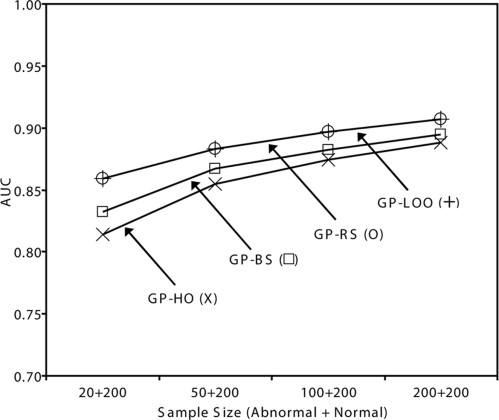
Generalization performance, estimated performance, and bias
Get Radiology Tree app to read full this article<
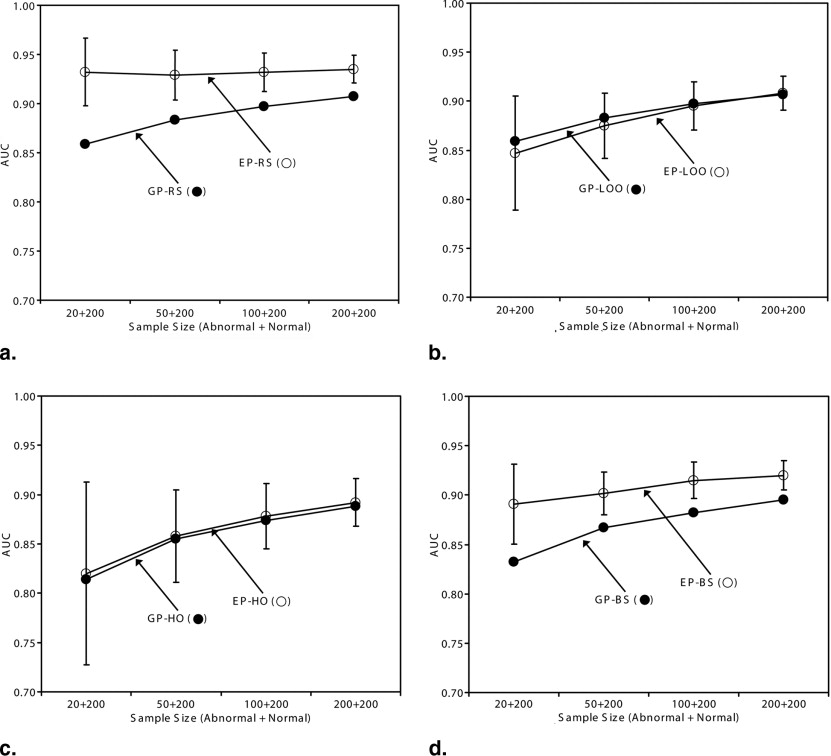
Analysis and comparison of various evaluation methods
Methods
Get Radiology Tree app to read full this article<
Get Radiology Tree app to read full this article<
Get Radiology Tree app to read full this article<
Results
Get Radiology Tree app to read full this article<
Get Radiology Tree app to read full this article<
Get Radiology Tree app to read full this article<
Get Radiology Tree app to read full this article<
Application of Various Evaluation Methods
Get Radiology Tree app to read full this article<
Table 1
Important Characteristics of the Resustitution, Leave-One-Out, Hold-Out, Bootstrap, and Cross-Validation Evaluation Methods
Evaluation Methods Good Generalization Performance? Unbiased Estimated Performance? Unique CAD Algorithm? Small Variance in Estimated Performance? Low Computational Cost? Resubstitution Yes No Yes Yes Yes Hold-out No Yes Yes No Yes Leave-one-out Yes Yes No No No Bootstrap No No No Yes No Twofold cross-validation No Yes No No Yes Tenfold cross-validation Yes Yes No No Yes
Get Radiology Tree app to read full this article<
Get Radiology Tree app to read full this article<
Get Radiology Tree app to read full this article<
Get Radiology Tree app to read full this article<
Discussion
Get Radiology Tree app to read full this article<
Get Radiology Tree app to read full this article<
Get Radiology Tree app to read full this article<
Get Radiology Tree app to read full this article<
Get Radiology Tree app to read full this article<
Get Radiology Tree app to read full this article<
Conclusion
Get Radiology Tree app to read full this article<
Get Radiology Tree app to read full this article<
References
1. Chan H.P., Doi K., Vyborny C.J., et. al.: Improvement in radiologists’ detection of clustered microcalcifications on mammograms: the potential of computer-aided diagnosis. Invest Radiol 1990; 25: pp. 1102-1110.
2. Kobayashi T., Xu X., MacMahon H., et. al.: Effect of a computer-aided diagnosis scheme on radiologists’ performance in detection of lung nodules on radiographs. Radiology 1996; 199: pp. 843-848.
3. Fukunaga F., Hayes R.R.: Effects of sample size on classifier design. IEEE Trans Pattern Anal Mach Intell 1989; 11: pp. 873-885.
4. Fukunaga F., Hayes R.R.: Estimation of classifier performance. IEEE Trans Pattern Anal Mach Intell 1989; 11: pp. 1087-1101.
5. Wagner R.F., Chan H.-P., Mossoba J.T., et. al.: Finite-sample effects and resampling plans: applications to linear classifiers in computer-aided diagnosis. Proc SPIE Conf Medical Imaging 1997; 3034: pp. 467-477.
6. Chan H.-P., Sahiner B., Wagner R.F., et. al.: Classifier design for computer-aided diagnosis: effects of finite sample size on the mean performance of classical and neural network classifiers. Med Phys 1999; 26: pp. 2654-2668.
7. Sahiner B., Chan H.-P., Petrick N., et. al.: Feature selection and classifier performance in computer-aided diagnosis: the effect of finite sample size. Med Phys 2000; 27: pp. 1509-1522.
8. Gur D., Wagner R.F., Chan H.-P.: On the repeated use of database for testing incremental improvement of computer-aided detection schemes. R. Acad Radiol 2004; 11: pp. 103-105.
9. Li Q., Doi K.: The reduction of bias and variance for the evaluation of computer-aided diagnostic scheme. Med Phys 2006; 33: pp. 868-875.
10. Efron B., Tibshirani R.F.: 1993.Chapman and HallNew York
11. Aoyama M., Li Q., Katsuragawa S., et. al.: Automated computerized scheme for distinction between benign and malignant solitary pulmonary nodules on chest images. Med Phys 2002; 29: pp. 701-708.
12. Aoyama M., Li Q., Katsuragawa S., et. al.: Computerized scheme for determination of the likelihood measure of malignancy for pulmonary nodules on low-dose CT images. Med Phys 2003; 30: pp. 387-394.
13. MacKay D.J.C.: 1992. Available online at: http://wol.ra.phy.cam.ac.uk/mackay/thesis.pdf
14. Kupinski M.A., Edwards D.C., Giger M.L., et. al.: Ideal observer approximation using Bayesian classification neural networks. IEEE Trans Med Imaging 2001; 20: pp. 886-899.
15. Kallergi M.: Computer-aided diagnosis of mammographic microcalcification clusters. Med Phys 2004; 31: pp. 314-326.
16. Li H., Giger M.L., Huo Z.: Computerized analysis of mammographic parenchymal patterns for assessing breast cancer risk: effect of ROI size and location. Med Phys 2004; 31: pp. 549-555.
17. Sahiner B., Chan H.-P., Roubidoux M.A., et. al.: Computerized characterization of breast masses on three-dimensional ultrasound volumes. Med Phys 2004; 31: pp. 744-754.
18. Nakayama R., Uchiyama Y., Watanabe R., et. al.: Computer-aided diagnosis scheme for histological classification of clustered microcalcifications on magnification mammograms. Med Phys 2004; 31: pp. 789-799.
19. Nappi J., Frimmel H., Dachman A.H., et. al.: Computerized detection of colorectal masses in CT colonography based on fuzzy merging and wall-thickening analysis. Med Phys 2004; 31: pp. 860-872.
20. Catarious D., Baydush A.H., Floyd A.E.: Incorporation of an iterative, linear segmentation routine into a mammographic mass CAD system. Med Phys 2004; 31: pp. 1512-1520.
21. Iordanescu G., Summers R.M.: Reduction of false positives on the rectal tube in computer-aided detection for CT colonography. Med Phys 2004; 31: pp. 2855-2862.
22. Yin T.-K., Chiu N.-T.: A computer-aided diagnosis for locating abnormalities in bone scintigraphy by a fuzzy system with a three step minimization approach. IEEE Trans Med Imag 2004; 23: pp. 639-654.
23. Paik D.S., Beaulieu C.F., Rubin G.D., et. al.: Surface normal overlap: a computer-aided detection algorithm with application to colonic polyps and lung nodules in helical CT. IEEE Trans Med Imag 2004; 23: pp. 661-675.
24. Joo S., Yang Y.S., Moon W.K., et. al.: Computer-aided diagnosis of solid breast nodules: use of an artificial neural network based on multiple sonographic features. IEEE Trans Med Imaging 2004; 23: pp. 1292-1300.