
Rationale and Objectives
The aim of this study was to assess the repeatability and internal consistency of flow measurements in the renal arteries and pararenal aorta with the use of standard two-dimensional (2D) and novel four-dimensional (4D) phase contrast (PC) magnetic resonance imaging (MRI).
Materials and Methods
Ten healthy volunteers were imaged with a radially undersampled 4D PC technique centered over the renal arteries and with four 2D PC slices placed in the supra/infrarenal aorta and the left/right renal arteries; this MRI exam was performed twice on each subject. Flow measurements in all four vessels were computed from 2D and 4D PC data sets. Student’s t -tests ( P < .05) were used to assess differences between in-flow (suprarenal aorta) and out-flow (infrarenal aorta + left renal artery + right renal artery) for the 2D and 4D techniques, to compare in- and out-flow, and to compare repeated measurements of 2D and 4D flow measurements.
Results
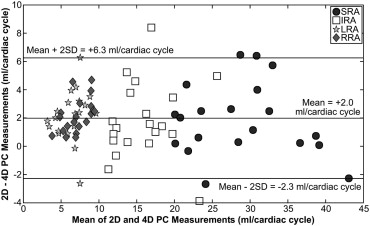
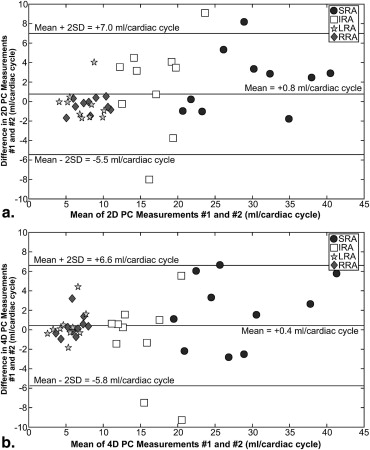
No significant differences were found in repeated measurements of 2D ( P = .15) or 4D ( P = .39) data. No significant difference was found between 2D (3.4 ± 2.8 mL/cardiac cycle) and 4D (3.5 ± 2.7 mL/cardiac cycle) in- and out-flow differences ( P = .88). Out-flow was greater than in-flow for 2D measurements ( P = .003); no difference was found for 4D measurements.
Conclusion
The 2D and 4D techniques demonstrated strong repeatability and internal consistency of flow measurements in the renal arteries and pararenal aorta.
In recent years, four-dimensional (4D) phase contrast (PC) magnetic resonance imaging (MRI) has become more common as a research tool to investigate anatomy, angiography, and flow and velocity information. 4D PC acquisitions provide large volumetric coverage and three-directional velocity encoding for multiple time points in the cardiac cycle. Additionally, 4D PC data sets can be used to derive various flow-related parameters, including pulse wave velocity, pressure gradients, and wall shear stress . A number of studies have been performed to validate 4D PC flow measurements, such as the comparison of 4D PC flow measurements to flow phantoms and to two-dimensional (2D) flow measurements as a reference standard . 4D PC flow measurements have also been compared with laser Doppler velocimetry and with ultrasound flow measurements in the cranial vessels and the left ventricle . Furthermore, pressure gradients derived from 4D PC data sets have been validated with invasive pressure probes . Initial studies showed that pressure gradients measured with 4D PC and invasive pressure probes were found to be in strong agreement in the carotid and iliac arteries. Such studies are useful for demonstrating the feasibility of using 4D PC flow techniques clinically.
Navigator-based respiratory gating, as well as continuously adapting respiratory gating with bellows, has allowed for 4D PC data sets to be collected during free breathing . However, respiratory gating further prolongs the already lengthy acquisitions. Furthermore, the high demands for spatial resolution and large volume coverage needed to assess the complicated anatomy of the abdominal vasculature ( Fig 1 ) have hampered the use of 4D PC MRI in the abdomen. Radial undersampling has been promising as a means to overcome these limitations; radial undersampling has allowed for the assessment of renal flow in addition to the acquisition of high-quality PC angiograms without the need for an external contrast agent . Given the potential for artifacts arising from respiratory and peristaltic motion in abdominal exams, further evaluation is needed to assess the performance of 4D PC techniques in the abdomen.
 Open full size image
Figure 1
Vascular geometry and hemodynamics in the abdominal aorta and renal arteries of a healthy volunteer. Three-dimensional stream lines depict the systolic blood flow in the abdominal vasculature. Planes demonstrate velocities in the suprarenal aorta (SRA), infrarenal aorta (IRA), and left/right renal arteries (LRA/RRA).
Get Radiology Tree app to read full this article<
Get Radiology Tree app to read full this article<
Materials and methods
Subjects
Get Radiology Tree app to read full this article<
MRI
Get Radiology Tree app to read full this article<
Get Radiology Tree app to read full this article<
Data Analysis
Get Radiology Tree app to read full this article<
Get Radiology Tree app to read full this article<
Statistical Analysis
Get Radiology Tree app to read full this article<
Results
Get Radiology Tree app to read full this article<
Get Radiology Tree app to read full this article<
Get Radiology Tree app to read full this article<
![Figure 3, Box and scatter plots of in-flow (suprarenal aorta [SRA]) and out-flow (infrarenal aorta [IRA] + left renal artery [LRA] + right renal artery [RRA]) in 10 volunteers as measured with two-dimensional (2D) and four-dimensional (4D) phase contrast (PC) techniques. Data shown are from both first and second exams in each subject.](https://storage.googleapis.com/dl.dentistrykey.com/clinical/RepeatabilityandInternalConsistencyofAbdominal2Dand4DPhaseContrastMRFlowMeasurements/1_1s20S1076633213000731.jpg)
Get Radiology Tree app to read full this article<
Get Radiology Tree app to read full this article<
Get Radiology Tree app to read full this article<
Discussion
Get Radiology Tree app to read full this article<
Get Radiology Tree app to read full this article<
Get Radiology Tree app to read full this article<
Get Radiology Tree app to read full this article<
Acknowledgment
Get Radiology Tree app to read full this article<
References
1. Markl M., Kilner P.J., Ebbers T.: Comprehensive 4D velocity mapping of the heart and great vessels by cardiovascular magnetic resonance. J Cardiovasc Magn Reson 2011; 13: pp. 7.
2. Gu T., Korosec F.R., Block W.F., et. al.: PC VIPR: a high-speed 3D phase-contrast method for flow quantification and high-resolution angiography. AJNR Am J Neuroradiol 2005; 26: pp. 743-749.
3. Nett E.J., Johnson K.M., Frydrychowicz A., et. al.: Four-dimensional phase contrast MRI with accelerated dual velocity encoding. J Magn Reson Imaging 2012; 35: pp. 1462-1471.
4. Carlsson M., Toger J., Kanski M., et. al.: Quantification and visualization of cardiovascular 4D velocity mapping accelerated with parallel imaging or k-t BLAST: head to head comparison and validation at 1.5 T and 3 T. J Cardiovasc Magn Reson 2011; 13: pp. 55.
5. Eriksson J., Carlhall C.J., Dyverfeldt P., et. al.: Semi-automatic quantification of 4D left ventricular blood flow. J Cardiovasc Magn Reson 2010; 12: pp. 9.
6. Uribe S., Beerbaum P., Sorensen T.S., et. al.: Four-dimensional (4D) flow of the whole heart and great vessels using real-time respiratory self-gating. Magn Reson Med 2009; 62: pp. 984-992.
7. Markl M., Chan F.P., Alley M.T., et. al.: Time-resolved three-dimensional phase-contrast MRI. J Magn Reson Imaging 2003; 17: pp. 499-506.
8. Hollnagel D.I., Summers P.E., Kollias S.S., et. al.: Laser Doppler velocimetry (LDV) and 3D phase-contrast magnetic resonance angiography (PC-MRA) velocity measurements: validation in an anatomically accurate cerebral artery aneurysm model with steady flow. J Magn Reson Imaging 2007; 26: pp. 1493-1505.
9. Chang W., Landgraf B., Johnson K.M., et. al.: Velocity measurements in the middle cerebral arteries of healthy volunteers using 3D radial phase-contrast HYPRFlow: comparison with transcranial Doppler sonography and 2D phase-contrast MR imaging. AJNR Am J Neuroradiol 2011; 32: pp. 54-59.
10. Lum D.P., Johnson K.M., Paul R.K., et. al.: Transstenotic pressure gradients: measurement in swine–retrospectively ECG-gated 3D phase-contrast MR angiography versus endovascular pressure-sensing guidewires. Radiology 2007; 245: pp. 751-760.
11. Francois C.J., Lum D.P., Johnson K.M., et. al.: Renal arteries: isotropic, high-spatial-resolution, unenhanced MR angiography with three-dimensional radial phase contrast. Radiology 2011; 258: pp. 254-260.
12. Bley T.A., Johnson K.M., Francois C.J., et. al.: Noninvasive assessment of transstenotic pressure gradients in porcine renal artery stenoses by using vastly undersampled phase-contrast MR angiography. Radiology 2011; 261: pp. 266-273.
13. Markl M., Harloff A., Bley T.A., et. al.: Time-resolved 3D MR velocity mapping at 3T: improved navigator-gated assessment of vascular anatomy and blood flow. J Magn Reson Imaging 2007; 25: pp. 824-831.
14. Johnson K.M., Markl M.: Improved SNR in phase contrast velocimetry with five-point balanced flow encoding. Magn Reson Med 2010; 63: pp. 349-355.
15. Johnson K.M., Lum D.P., Turski P.A., et. al.: Improved 3D phase contrast MRI with off-resonance corrected dual echo VIPR. Magn Reson Med 2008; 60: pp. 1329-1336.
16. Liu J., Redmond M.J., Brodsky E.K., et. al.: Generation and visualization of four-dimensional MR angiography data using an undersampled 3-D projection trajectory. IEEE Trans Med Imaging 2006; 25: pp. 148-157.
17. Bland J.M., Altman D.G.: Statistical methods for assessing agreement between two methods of clinical measurement. Lancet 1986; 1: pp. 307-310.
18. Bax L., Bakker C.J., Klein W.M., et. al.: Renal blood flow measurements with use of phase-contrast magnetic resonance imaging: normal values and reproducibility. J Vasc Interv Radiol 2005; 16: pp. 807-814.
19. Stalder A.F., Russe M.F., Frydrychowicz A., et. al.: Quantitative 2D and 3D phase contrast MRI: optimized analysis of blood flow and vessel wall parameters. Magn Reson Med 2008; 60: pp. 1218-1231.